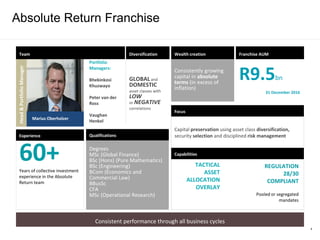
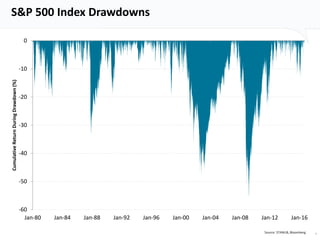
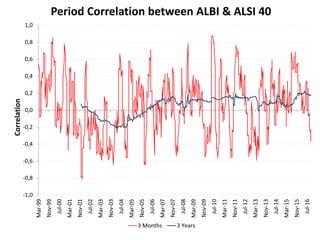
Marius Oberholzer : Head Absolute Return Strategies
March 2017
Absolute Plus Fund
Contents
1. People and Philosophy
2. Absolute Plus Fund Aims
3. High Level Process
4. Performance and Peer Group Comparisons
5. Market Environment
6. Conclusion
Absolute Return Strategies
People & Philosophy
4
Absolute Return Franchise
Consistent performance through all business cycles
Degrees
MSc (Global Finance)
BSc (Hons) (Pure Mathematics)
BSc (Engineering)
BCom (Economics and
Commercial Law)
BBusSc
CFA
MSc (Operational Research)
Qualifications
Consistently growing
capital in absolute
terms (in excess of
inflation)
Wealth creation
R9.5bn
Franchise AUM
60+Years of collective investment
experience in the Absolute
Return team
Experience
Team
TACTICAL
ASSET
ALLOCATION
OVERLAY
Capital preservation using asset class diversification,
security selection and disciplined risk management
Focus
31 December 2016
Portfolio
Managers:
Bhekinkosi
Khuzwayo
Peter van der
Ross
Vaughan
Henkel
GLOBALand
DOMESTIC
asset classes with
LOW
or NEGATIVE
correlations
REGULATION
28/30
COMPLIANT
Pooled or segregated
mandates
Diversification
Marius Oberholzer
Head&PortfolioManager
Capabilities
5
Benefit from wide range of insights, but not obliged to follow them
Dealing Desk
Fixed Income
Head : Henk Viljoen
Team: 9 inv. professionals
Listed Property
Head : Keillen Ndlovu
Team: 5 inv. professionals
Equities
Head : Herman van Velze
Team: 8 inv. professionals
Multi-Asset
Head : Robin Eagar
Team: 6 inv. professionals
Economics
Chief Economist: Kevin Lings
Team: 3 inv. professionals
Pan-Africa
Head : John Mackie
Team: 4 inv. professionals
Beta Quant and Passive
Head : Brian Kipps
Team: 5 inv. professionals
Portfolio Analytics
Risk and Implementations (PARI)
Head : Dr Gareth Witten
Team: 15 inv. support
ABSOLUTE RETURNS GROUP
Marius Oberholzer: Head of Absolute Return & Portfolio Manager
Peter van der Ross
Portfolio Manager
Bheki Khuzwayo
Portfolio Manager
• Average Investment Experience 15 Years
• Experienced in Absolute Return investing
• Specialists - only manage Absolute Return Mandates
• Draw on expertise across Stanlib Asset Management
• Boutique mentality - high degree of client alignment
Head : Alphonso Raats
Team: 3 inv. professionals
Vaughan Henkel
Portfolio Manager
S&P 500 Index Drawdowns
-60
-50
-40
-30
-20
-10
0
Jan-80 Jan-84 Jan-88 Jan-92 Jan-96 Jan-00 Jan-04 Jan-08 Jan-12 Jan-16
CumulativeReturnDuringDrawdown(%)
6Source: STANLIB, Bloomberg
-1,0
-0,8
-0,6
-0,4
-0,2
0,0
0,2
0,4
0,6
0,8
1,0
Mar-99
Nov-99
Jul-00
Mar-01
Nov-01
Jul-02
Mar-03
Nov-03
Jul-04
Mar-05
Nov-05
Jul-06
Mar-07
Nov-07
Jul-08
Mar-09
Nov-09
Jul-10
Mar-11
Nov-11
Jul-12
Mar-13
Nov-13
Jul-14
Mar-15
Nov-15
Jul-16
Correlation
Period Correlation between ALBI & ALSI 40
3 Months 3 Years
8
9
Absolute Return Investing: The Case and Philosophy
“Rule No.1: never lose money; Rule No. 2: don’t forget Rule No. 1”
Warren Buffett
“What if I am wrong? Any rationale investment plan has to start with that question”.
Peter L. Bernstein
Avoiding pain is key to long term gain!
10
What does Absolute Return investing mean to us?
Harness the power of compounding:
o Preserve capital : Risk = short term loss of capital (nominal)
o Expose clients’ capital to risk premia that are priced to deliver
long term rewards : beat inflation over time horizons > 3 years =
Sustainable Growth
Grow our clients’ real purchasing power
Diversify in many ways. We respect the markets.
Path dependency matters….
Deliver steady, consistent returns over time
“You can’t
eat relative returns.”
so
Narrow the range of
potential outcomes to
deliver a predictable
return profile
25%
20%
15%
10%
5%
0%
-5%
-10%
-15%
-20%
-25%
-25% -20% -15% -10% -5% 0% 5% 10% 15% 20% 25%
Limited downside, with
upside participation
Asset Market STANLIB Absolute Return
12
What can you expect over the medium term?
Market Returns
Portfolioreturns
Absolute Plus Fund
Aims and Outcomes
“Significant long-term performance does not appear magically and
suddenly. Long-term profitability is a process, involving trial-and-
error”.
Peter Brandt.
Victory is built on small steps and good decisions
Absolute Plus Fund
• Primarily this is an Asset Allocation Strategy
• Reg 28 Unit Trust
• Broadened asset mix available, relative to its history
• Do use derivatives to protect against adverse outcomes, all on-exchange traded to ensure
transparent pricing.
• Risk Managed and governance
• Liquid and scalable
• Very flexible around Asset Allocation
• Mandated to protect capital over rolling 12 months
• Seek CPI+4% over medium term.
• Lower volatility of returns.
High Level Process
SAA in Risk Seeking mode: 1. Highest probability of meeting the return target,
2. lowest probability of incurring a shorter term drawdown along the way
“It is a mistake to try to look too far ahead. The chain of destiny can only be grasped one
link at a time”
Winston Churchill
Buying and holding an SAA designed to meet CPI hurdles will breach our
drawdown limits, even on conservative mandates.
17
What do we Actually do?
18
Focus on getting the
asset allocation right:
Identify mispricing's
Use hedging and
liquidity
Protect against adverse
outcomes at asset and
portfolio level
Spread exposure
across asset classes,
geographies and
strategies
We embrace active,
passive and hybrid
strategies
Add some asset selection alpha
• Duration and curve strategies
• Credit
• Stock or sector selection in Equity & Property
• Quant factors in Equity
• Instrument selection around expression of view.
19
Identify mispricing across Asset Classes
• Exposed to risk-premia which deliver returns over time
• Seek to make sense of economic and macro environment and blend with our valuation framework
• We apply a Hurdle Rate to each investment
• Our liquidity profile allows us to adapt quickly to change
Deliberate about how we exploit opportunities:
• Where (asset class & geography)
• When (business cycle and valuations)
• Why (explicit rationale and reasoning)
• How (best way to express the investment view: beta, capital structure or derivative)
• Could we be wrong?
• What makes us wrong
Disciplined Risk Management:
• Constant, as well as formal, regular evaluation of positions and portfolio
• Position sizing and hedging
• Stress testing and scenario analysis
STANLIB Absolute Returns Process
20
Risk Management in Absolute Returns Business
“Everyone has a plan until they get punched in the face” Mike Tyson
Risk Management Objectives:
• Proactive rather than reactive risk management to prepare for adverse outcomes
• Culture of risk management. Risk management is seen as part of the Absolute Return process
• Quantify, isolate and manage portfolio risks
• Truncate against losses and tail-risk
General Methodologies:
• Position level and asset class level risks aggregated for portfolio?
• Overlay hedges to bring systemic risks and portfolio volatility with desired limits
• Exposure and drawdown limits to manage more idiosyncratic exposures
• Liquid portfolio
Independent Insights:
• Independent Risk Team report to CEO and COO
• Scenario analysis and Stress testing
• Investment Governance functions
Tools:
• Franchises uses in-house tools, Bloomberg and 3rd party system “Risk 101”
• PARI* uses APT® and FactSet®.
* Portfolio Analytics Risk and Implementations.
Performance and Peer Group
Comparisons
22
Absolute Plus: Asset Allocation over last 12 months.
0%
10%
20%
30%
40%
50%
60%
70%
80%
90%
100%
08-Jan-16
22-Jan-16
29-Feb-16
15-Apr-16
06-May-16
20-May-16
31-May-16
10-Jun-16
30-Jun-16
08-Jul-16
22-Jul-16
05-Aug-16
19-Aug-16
31-Aug-16
16-Sep-16
30-Sep-16
04-Nov-16
18-Nov-16
30-Nov-16
09-Dec-16
30-Dec-16
13-Jan-17
27-Jan-17
03-Feb-17
17-Feb-17
28-Feb-17
Offshore Property
GLD
Offshore Bonds
Offshore Cash
Offshore Equities
SA Equities
SA Property
SA Bonds
SA Cash
SA Short Duration FI
23
STANLIB Absolute Plus vs. Asset Classes
1 Year to February 2017
24
STANLIB Absolute Plus
1 Year Summary Statistics - 28 February 2017
• Equity Type Returns without equity volatility. Portfolio volatility low despite increasing asset class volatility.
• High degree of consistency of returns irrespective of increasing volatility and asset class return inconsistency.
• Robust Sharpe Ratio reflects SA return profile and value-add of the strategy of upside participation without high
levels of downside participation.
Source: STANLIB, I-Net Bridge
1 Year FundStatistics
STANLIB Absolute
Plus Fund
CPI+ 4% SACash SABonds SAProperty SAEquity Global Bonds Global Equity
AnnualisedReturn(%) 6.27 10.18 7.51 13.49 10.96 6.30 -19.34 -1.48
AnnualisedVolatility (%) 3.84 1.22 0.07 6.65 13.39 9.98 18.86 18.28
% Negative Months 8% 0% 0% 8% 11% 14% 28% 19%
Average Negative MonthReturn(%) -0.95 0.00 0.00 -1.70 -3.02 -2.02 -3.77 -3.33
Average Positive MonthReturn(%) 1.00 0.81 0.61 2.00 2.91 2.38 9.01 4.67
Sharpe Ratio -0.32 2.18 0.00 0.90 0.26 -0.12 -1.42 -0.49
MaximumDrawdown(%) -2.82 0.00 0.00 -1.83 -6.60 -5.50 -20.32 -13.38
25
STANLIB Absolute Plus vs. Asset Classes
3 Years to February 2017
26
STANLIB Absolute Plus
3 Year Summary Statistics – 28 February 2017
Source: STANLIB, I-Net Bridge
• Equity Type Returns without equity volatility. Portfolio volatility low despite increasing asset class volatility.
• High degree of consistency of returns irrespective of increasing volatility and asset class return inconsistency.
• Robust Sharpe Ratio reflects SA return profile and value-add of the strategy of upside participation without high
levels of downside participation.
3 Year FundStatistics
STANLIB Absolute
Plus Fund
CPI+ 4% SACash SABonds SAProperty SAEquity
AnnualisedReturn(%) 7.69 9.47 6.71 7.95 16.23 5.69
AnnualisedVolatility (%) 3.57 1.43 0.18 8.21 12.06 9.80
% Negative Months 22% 0% 0% 39% 28% 42%
Average Negative MonthReturn(%) -0.83 0.00 0.00 -1.54 -2.92 -2.10
Average Positive MonthReturn(%) 1.04 0.76 0.54 2.07 2.95 2.36
Sharpe Ratio 0.27 1.94 0.00 0.15 0.79 -0.10
MaximumDrawdown(%) -2.82 0.00 0.00 -9.78 -9.38 -8.33
27
STANLIB Absolute Plus
5 Year Summary Statistics – 28 February 2017
Source: STANLIB, I-Net Bridge
• Equity Type Returns without equity volatility. Portfolio volatility low despite increasing asset class volatility.
• High degree of consistency of returns irrespective of increasing volatility and asset class return inconsistency.
• Robust Sharpe Ratio reflects SA return profile and value-add of the strategy of upside participation without high
levels of downside participation.
5 Year FundStatistics
STANLIB Absolute
Plus Fund
CPI+ 4% SACash SABonds SAProperty SAEquity
AnnualisedReturn(%) 10.03 9.75 6.15 7.32 16.26 11.58
AnnualisedVolatility (%) 4.24 1.39 0.24 7.88 14.35 10.51
% Negative Months 42% 0% 0% 61% 47% 61%
Average Negative MonthReturn(%) -0.82 0.00 0.00 -1.58 -3.85 -2.27
Average Positive MonthReturn(%) 1.35 0.78 0.50 1.89 3.40 2.84
Sharpe Ratio 0.91 2.59 0.00 0.15 0.70 0.52
MaximumDrawdown(%) -2.82 0.00 0.00 -9.78 -14.17 -8.33
Absolute Plus vs Medium Equity Category
29
Absolute Plus versus the Peer group
Stanlib Absolute Plus has reasonable “quality” of returns
Comparison to our identified competitors – End Feb 2017
Market Environment
-1,0
-0,5
0,0
0,5
1,0
1,5
2,0
2,5
3,0
3,5
4,0
2005
2006
2007
2008
2009
2010
2011
2012
2013
2014
2015
2016
%q/q, 3-year moving average
US Real GDP Growth – 3 Year Moving Average
33
-22
-20
-18
-16
-14
-12
-10
-8
-6
-4
-2
0
2
4
6
8
10
12
14
2004
2005
2006
2007
2008
2009
2010
2011
2012
2013
2014
2015
2016
%q/q, 4-quarter moving average
US Real Fixed Investment Spending
34
-25
-20
-15
-10
-5
0
5
10
15
20
25
2005
2006
2007
2008
2009
2010
2011
2012
2013
2014
2015
2016
%y/y
US Monthly Growth in Exports
35
20
40
60
80
100
120
04 05 06 07 08 09 10 11 12 13 14 15 16
Index
US Consumer Confidence – reflects the soft patch
36
-5
-3
-1
1
3
5
7
80
82
84
86
88
90
92
94
96
98
100
102
104
106
108
1985
1990
1995
2000
2005
2010
2015
%y/y (lagged 1 quarter)Index
Correlation = 0.71
Small business confidence (lhs)
GDP (rhs)
US Small Business Confidence Index (NFIB) vs. GDP
37
-3,0
-2,0
-1,0
0,0
1,0
2,0
3,0
4,0
5,0
6,0
7,0
8,0
9,0
10,0
11,0
12,0
2012
2013
2014
2015
2016
%y/y, 12-month moving average
China Growth in Electricity Consumption
38
-40
-30
-20
-10
0
10
20
30
2012 2013 2014 2015 2016
%y/y
World Industrial Commodity Price Inflation
Transitory so what does this mean for global narrative?
39
South Africa Real GDP Growth Year-on-Year
-3
-2
-1
0
1
2
3
4
5
6
7
8
05 06 07 08 09 10 11 12 13 14 15 16
%y/y
40
-15
-10
-5
0
5
10
15
20
25
2005
2006
2007
2008
2009
2010
2011
2012
2013
2014
2015
2016
Confidence Index
Consumer confidence
SA Consumer Confidence
41
15
25
35
45
55
65
75
85
95
2004
2005
2006
2007
2008
2009
2010
2011
2012
2013
2014
2015
2016
Index
SA Business Confidence (BER)
42
-7
-6
-5
-4
-3
-2
-1
0
1
2
3
4
5
2014
2015
2016
%q/q, %q/q, 4-quarter moving average annualised
Growth In Fixed Investment Spending By Private Sector
43
South Africa Corporate Deposits
250
270
290
310
330
350
370
390
410
430
450
470
490
510
530
550
570
590
610
630
650
670
690
710
730
750
770
2006
2007
2008
2009
2010
2011
2012
2013
2014
2015
2016
R billion
44
SA Growth In Exports (Dollars)
-30
-25
-20
-15
-10
-5
0
5
10
15
20
25
30
35
40
45
11
12
13
14
15
16
%y/y
45
South Africa Headline CPI Forecast
2
3
4
5
6
7
8
9
2009
2010
2011
2012
2013
2014
2015
2016
2017
% y/y
46
?
47
Foreign Flows
Foreign sales
> ZAR34bn
48
Repo vs FRAs
7,36 7,36 7,37 7,37 7,37 7,37 7,37 7,38 7,39
6,0
7,0
8,0
Feb '17 Mar '17 Apr '17 May '17 Jul '17 Oct '17 Jan '18 Apr '18 Jul '18
Market View SARB Repo
Market based expectation: No further Repo rate hikes expected
Source: STANLIB, Bloomberg
49
US 10 Year Note: Will Trumponomics be Sustainable
1
2
3
4
5
6
7
1/28/2000 1/28/2003 1/28/2006 1/28/2009 1/28/2012 1/28/2015
US 10 Year Note
Trump effect
Source: STANLIB, Bloomberg
Taper Tantrum
10 Year Real Yields – data correct as 21st March 2017
-3
-2
-1
0
1
2
3
4
Bonds spreads could still compress
5,00
5,50
6,00
6,50
7,00
7,50
8,00
8,50
9,00
9,50
10,00
SA 10Y vs JP 10Y
10Y AGG AGG since GFC
3,00
4,00
5,00
6,00
7,00
8,00
9,00
10,00
SA 10Y Spread to Bunds
4,00
4,50
5,00
5,50
6,00
6,50
7,00
7,50
8,00
8,50
SA 10Y Spread to UST
6
7
8
9
10
11
12
13
14
15
SA 10 Yr vs Peers
Average R186
Valuation
SPX isn’t overly expensive on PE basis
Valuation
Median EV/EBITDA ratio in US has rarely been higher
53
Source: Societe Generale
Keep Calm – Equity Risk Premium
Earnings yield using TREND earnings, less 10 year Treasury yield
Source: Capital
54
Growth and Inflation
Risks to growth are symmetrical - inflation risks “might” be skewed to the upside
55
Growth
Inflation
“Fatter” Tails “Fatter” Tails
Base Case of Higher
Inflation
Left Tail Clipped
Meaningful Risks
to the Upside
Flatter Frontier
Risk return trade off – Four asset class portfolio
Source: Morgan Stanley
Expected Returns1990-2009 2010-2016 Best Return/Vol: 5.8%/3.1%
Best Return/Vol: 5.3%/4.3%
Best Return/Vol: 2.2%/3.5%
56
Conclusion
58
• We believe that market inefficiencies can be exploited through active asset allocation, creating attractive risk-
adjusted and Absolute returns.
• We adjust asset allocation dynamically, based on a bottom up valuation-based process, top-down research and a
pragmatic view of what drives markets. We do not buy-and-hope
• We prepare for adverse outcomes and protect portfolios accordingly. Nimble, tactical and dynamic should
win the day
• We manage against downside volatility of returns. Patience to wait for risk-reward to be in our favour
• Core team members have a boutique mentality with combined investment experience of in excess of 60 years
with diverse, complementary and specialist skillsets.
• Proven True Absolute Return funds with strong track record of downside protection
• We love volatility.
“It is not the strongest of the species that survives.
It is the one that is most adaptable to change”
Why STANLIB Absolute Returns?
Thank You
Collective Investment Schemes (CIS) in Securities are generally medium to long-term investments. An investment in the participations of
a collective investment scheme in securities is not the same as a deposit with a banking institution. The value of participatory interests
may go down as well as up and past performance is not necessarily a guide to the future. CIS are traded at ruling prices and can engage
in borrowing and scrip lending. A schedule of fees and charges and maximum commissions is available on request from STANLIB
Collective Investments (“the Manager”). Commission and incentives may be paid and if so, would be included in the overall costs.
Forward pricing is used. Fluctuations or movements in exchange rates may cause the value of underlying international investments to go
up or down. Liberty is a full member of the Association for Savings & Investment SA (ASISA). The Manager is a member of the Liberty
group of companies.
The information and content of this document are intended to be for information purposes only and STANLIB does not guarantee the
suitability or potential value of any information contained herein. STANLIB Wealth Management Limited does not expressly or by
implication propose that the products or services offered in this document are appropriate to the particular investment objectives or needs
of any existing or prospective client. Potential investors are advised to seek independent advice from an authorised financial adviser in
this regard. STANLIB Wealth Management Limited is an authorised Financial Services Provider in terms of the Financial Advisory and
Intermediary Services Act 37 of 2002 (Licence No. 26/10/590)
Disclaimer
60

Stanlib

  • 1.
    Marius Oberholzer :Head Absolute Return Strategies March 2017 Absolute Plus Fund
  • 2.
    Contents 1. People andPhilosophy 2. Absolute Plus Fund Aims 3. High Level Process 4. Performance and Peer Group Comparisons 5. Market Environment 6. Conclusion
  • 3.
  • 4.
    4 Absolute Return Franchise Consistentperformance through all business cycles Degrees MSc (Global Finance) BSc (Hons) (Pure Mathematics) BSc (Engineering) BCom (Economics and Commercial Law) BBusSc CFA MSc (Operational Research) Qualifications Consistently growing capital in absolute terms (in excess of inflation) Wealth creation R9.5bn Franchise AUM 60+Years of collective investment experience in the Absolute Return team Experience Team TACTICAL ASSET ALLOCATION OVERLAY Capital preservation using asset class diversification, security selection and disciplined risk management Focus 31 December 2016 Portfolio Managers: Bhekinkosi Khuzwayo Peter van der Ross Vaughan Henkel GLOBALand DOMESTIC asset classes with LOW or NEGATIVE correlations REGULATION 28/30 COMPLIANT Pooled or segregated mandates Diversification Marius Oberholzer Head&PortfolioManager Capabilities
  • 5.
    5 Benefit from widerange of insights, but not obliged to follow them Dealing Desk Fixed Income Head : Henk Viljoen Team: 9 inv. professionals Listed Property Head : Keillen Ndlovu Team: 5 inv. professionals Equities Head : Herman van Velze Team: 8 inv. professionals Multi-Asset Head : Robin Eagar Team: 6 inv. professionals Economics Chief Economist: Kevin Lings Team: 3 inv. professionals Pan-Africa Head : John Mackie Team: 4 inv. professionals Beta Quant and Passive Head : Brian Kipps Team: 5 inv. professionals Portfolio Analytics Risk and Implementations (PARI) Head : Dr Gareth Witten Team: 15 inv. support ABSOLUTE RETURNS GROUP Marius Oberholzer: Head of Absolute Return & Portfolio Manager Peter van der Ross Portfolio Manager Bheki Khuzwayo Portfolio Manager • Average Investment Experience 15 Years • Experienced in Absolute Return investing • Specialists - only manage Absolute Return Mandates • Draw on expertise across Stanlib Asset Management • Boutique mentality - high degree of client alignment Head : Alphonso Raats Team: 3 inv. professionals Vaughan Henkel Portfolio Manager
  • 6.
    S&P 500 IndexDrawdowns -60 -50 -40 -30 -20 -10 0 Jan-80 Jan-84 Jan-88 Jan-92 Jan-96 Jan-00 Jan-04 Jan-08 Jan-12 Jan-16 CumulativeReturnDuringDrawdown(%) 6Source: STANLIB, Bloomberg
  • 7.
  • 8.
  • 9.
    9 Absolute Return Investing:The Case and Philosophy “Rule No.1: never lose money; Rule No. 2: don’t forget Rule No. 1” Warren Buffett “What if I am wrong? Any rationale investment plan has to start with that question”. Peter L. Bernstein
  • 10.
    Avoiding pain iskey to long term gain! 10
  • 11.
    What does AbsoluteReturn investing mean to us? Harness the power of compounding: o Preserve capital : Risk = short term loss of capital (nominal) o Expose clients’ capital to risk premia that are priced to deliver long term rewards : beat inflation over time horizons > 3 years = Sustainable Growth Grow our clients’ real purchasing power Diversify in many ways. We respect the markets. Path dependency matters…. Deliver steady, consistent returns over time “You can’t eat relative returns.” so Narrow the range of potential outcomes to deliver a predictable return profile
  • 12.
    25% 20% 15% 10% 5% 0% -5% -10% -15% -20% -25% -25% -20% -15%-10% -5% 0% 5% 10% 15% 20% 25% Limited downside, with upside participation Asset Market STANLIB Absolute Return 12 What can you expect over the medium term? Market Returns Portfolioreturns
  • 13.
    Absolute Plus Fund Aimsand Outcomes “Significant long-term performance does not appear magically and suddenly. Long-term profitability is a process, involving trial-and- error”. Peter Brandt. Victory is built on small steps and good decisions
  • 14.
    Absolute Plus Fund •Primarily this is an Asset Allocation Strategy • Reg 28 Unit Trust • Broadened asset mix available, relative to its history • Do use derivatives to protect against adverse outcomes, all on-exchange traded to ensure transparent pricing. • Risk Managed and governance • Liquid and scalable • Very flexible around Asset Allocation • Mandated to protect capital over rolling 12 months • Seek CPI+4% over medium term. • Lower volatility of returns.
  • 15.
  • 16.
    SAA in RiskSeeking mode: 1. Highest probability of meeting the return target, 2. lowest probability of incurring a shorter term drawdown along the way “It is a mistake to try to look too far ahead. The chain of destiny can only be grasped one link at a time” Winston Churchill
  • 17.
    Buying and holdingan SAA designed to meet CPI hurdles will breach our drawdown limits, even on conservative mandates. 17
  • 18.
    What do weActually do? 18 Focus on getting the asset allocation right: Identify mispricing's Use hedging and liquidity Protect against adverse outcomes at asset and portfolio level Spread exposure across asset classes, geographies and strategies We embrace active, passive and hybrid strategies Add some asset selection alpha • Duration and curve strategies • Credit • Stock or sector selection in Equity & Property • Quant factors in Equity • Instrument selection around expression of view.
  • 19.
    19 Identify mispricing acrossAsset Classes • Exposed to risk-premia which deliver returns over time • Seek to make sense of economic and macro environment and blend with our valuation framework • We apply a Hurdle Rate to each investment • Our liquidity profile allows us to adapt quickly to change Deliberate about how we exploit opportunities: • Where (asset class & geography) • When (business cycle and valuations) • Why (explicit rationale and reasoning) • How (best way to express the investment view: beta, capital structure or derivative) • Could we be wrong? • What makes us wrong Disciplined Risk Management: • Constant, as well as formal, regular evaluation of positions and portfolio • Position sizing and hedging • Stress testing and scenario analysis STANLIB Absolute Returns Process
  • 20.
    20 Risk Management inAbsolute Returns Business “Everyone has a plan until they get punched in the face” Mike Tyson Risk Management Objectives: • Proactive rather than reactive risk management to prepare for adverse outcomes • Culture of risk management. Risk management is seen as part of the Absolute Return process • Quantify, isolate and manage portfolio risks • Truncate against losses and tail-risk General Methodologies: • Position level and asset class level risks aggregated for portfolio? • Overlay hedges to bring systemic risks and portfolio volatility with desired limits • Exposure and drawdown limits to manage more idiosyncratic exposures • Liquid portfolio Independent Insights: • Independent Risk Team report to CEO and COO • Scenario analysis and Stress testing • Investment Governance functions Tools: • Franchises uses in-house tools, Bloomberg and 3rd party system “Risk 101” • PARI* uses APT® and FactSet®. * Portfolio Analytics Risk and Implementations.
  • 21.
    Performance and PeerGroup Comparisons
  • 22.
    22 Absolute Plus: AssetAllocation over last 12 months. 0% 10% 20% 30% 40% 50% 60% 70% 80% 90% 100% 08-Jan-16 22-Jan-16 29-Feb-16 15-Apr-16 06-May-16 20-May-16 31-May-16 10-Jun-16 30-Jun-16 08-Jul-16 22-Jul-16 05-Aug-16 19-Aug-16 31-Aug-16 16-Sep-16 30-Sep-16 04-Nov-16 18-Nov-16 30-Nov-16 09-Dec-16 30-Dec-16 13-Jan-17 27-Jan-17 03-Feb-17 17-Feb-17 28-Feb-17 Offshore Property GLD Offshore Bonds Offshore Cash Offshore Equities SA Equities SA Property SA Bonds SA Cash SA Short Duration FI
  • 23.
    23 STANLIB Absolute Plusvs. Asset Classes 1 Year to February 2017
  • 24.
    24 STANLIB Absolute Plus 1Year Summary Statistics - 28 February 2017 • Equity Type Returns without equity volatility. Portfolio volatility low despite increasing asset class volatility. • High degree of consistency of returns irrespective of increasing volatility and asset class return inconsistency. • Robust Sharpe Ratio reflects SA return profile and value-add of the strategy of upside participation without high levels of downside participation. Source: STANLIB, I-Net Bridge 1 Year FundStatistics STANLIB Absolute Plus Fund CPI+ 4% SACash SABonds SAProperty SAEquity Global Bonds Global Equity AnnualisedReturn(%) 6.27 10.18 7.51 13.49 10.96 6.30 -19.34 -1.48 AnnualisedVolatility (%) 3.84 1.22 0.07 6.65 13.39 9.98 18.86 18.28 % Negative Months 8% 0% 0% 8% 11% 14% 28% 19% Average Negative MonthReturn(%) -0.95 0.00 0.00 -1.70 -3.02 -2.02 -3.77 -3.33 Average Positive MonthReturn(%) 1.00 0.81 0.61 2.00 2.91 2.38 9.01 4.67 Sharpe Ratio -0.32 2.18 0.00 0.90 0.26 -0.12 -1.42 -0.49 MaximumDrawdown(%) -2.82 0.00 0.00 -1.83 -6.60 -5.50 -20.32 -13.38
  • 25.
    25 STANLIB Absolute Plusvs. Asset Classes 3 Years to February 2017
  • 26.
    26 STANLIB Absolute Plus 3Year Summary Statistics – 28 February 2017 Source: STANLIB, I-Net Bridge • Equity Type Returns without equity volatility. Portfolio volatility low despite increasing asset class volatility. • High degree of consistency of returns irrespective of increasing volatility and asset class return inconsistency. • Robust Sharpe Ratio reflects SA return profile and value-add of the strategy of upside participation without high levels of downside participation. 3 Year FundStatistics STANLIB Absolute Plus Fund CPI+ 4% SACash SABonds SAProperty SAEquity AnnualisedReturn(%) 7.69 9.47 6.71 7.95 16.23 5.69 AnnualisedVolatility (%) 3.57 1.43 0.18 8.21 12.06 9.80 % Negative Months 22% 0% 0% 39% 28% 42% Average Negative MonthReturn(%) -0.83 0.00 0.00 -1.54 -2.92 -2.10 Average Positive MonthReturn(%) 1.04 0.76 0.54 2.07 2.95 2.36 Sharpe Ratio 0.27 1.94 0.00 0.15 0.79 -0.10 MaximumDrawdown(%) -2.82 0.00 0.00 -9.78 -9.38 -8.33
  • 27.
    27 STANLIB Absolute Plus 5Year Summary Statistics – 28 February 2017 Source: STANLIB, I-Net Bridge • Equity Type Returns without equity volatility. Portfolio volatility low despite increasing asset class volatility. • High degree of consistency of returns irrespective of increasing volatility and asset class return inconsistency. • Robust Sharpe Ratio reflects SA return profile and value-add of the strategy of upside participation without high levels of downside participation. 5 Year FundStatistics STANLIB Absolute Plus Fund CPI+ 4% SACash SABonds SAProperty SAEquity AnnualisedReturn(%) 10.03 9.75 6.15 7.32 16.26 11.58 AnnualisedVolatility (%) 4.24 1.39 0.24 7.88 14.35 10.51 % Negative Months 42% 0% 0% 61% 47% 61% Average Negative MonthReturn(%) -0.82 0.00 0.00 -1.58 -3.85 -2.27 Average Positive MonthReturn(%) 1.35 0.78 0.50 1.89 3.40 2.84 Sharpe Ratio 0.91 2.59 0.00 0.15 0.70 0.52 MaximumDrawdown(%) -2.82 0.00 0.00 -9.78 -14.17 -8.33
  • 28.
    Absolute Plus vsMedium Equity Category
  • 29.
  • 30.
    Stanlib Absolute Plushas reasonable “quality” of returns
  • 31.
    Comparison to ouridentified competitors – End Feb 2017
  • 32.
  • 33.
  • 34.
  • 35.
  • 36.
    20 40 60 80 100 120 04 05 0607 08 09 10 11 12 13 14 15 16 Index US Consumer Confidence – reflects the soft patch 36
  • 37.
    -5 -3 -1 1 3 5 7 80 82 84 86 88 90 92 94 96 98 100 102 104 106 108 1985 1990 1995 2000 2005 2010 2015 %y/y (lagged 1quarter)Index Correlation = 0.71 Small business confidence (lhs) GDP (rhs) US Small Business Confidence Index (NFIB) vs. GDP 37
  • 38.
  • 39.
    -40 -30 -20 -10 0 10 20 30 2012 2013 20142015 2016 %y/y World Industrial Commodity Price Inflation Transitory so what does this mean for global narrative? 39
  • 40.
    South Africa RealGDP Growth Year-on-Year -3 -2 -1 0 1 2 3 4 5 6 7 8 05 06 07 08 09 10 11 12 13 14 15 16 %y/y 40
  • 41.
  • 42.
  • 43.
    -7 -6 -5 -4 -3 -2 -1 0 1 2 3 4 5 2014 2015 2016 %q/q, %q/q, 4-quartermoving average annualised Growth In Fixed Investment Spending By Private Sector 43
  • 44.
    South Africa CorporateDeposits 250 270 290 310 330 350 370 390 410 430 450 470 490 510 530 550 570 590 610 630 650 670 690 710 730 750 770 2006 2007 2008 2009 2010 2011 2012 2013 2014 2015 2016 R billion 44
  • 45.
    SA Growth InExports (Dollars) -30 -25 -20 -15 -10 -5 0 5 10 15 20 25 30 35 40 45 11 12 13 14 15 16 %y/y 45
  • 46.
    South Africa HeadlineCPI Forecast 2 3 4 5 6 7 8 9 2009 2010 2011 2012 2013 2014 2015 2016 2017 % y/y 46 ?
  • 47.
  • 48.
    48 Repo vs FRAs 7,367,36 7,37 7,37 7,37 7,37 7,37 7,38 7,39 6,0 7,0 8,0 Feb '17 Mar '17 Apr '17 May '17 Jul '17 Oct '17 Jan '18 Apr '18 Jul '18 Market View SARB Repo Market based expectation: No further Repo rate hikes expected Source: STANLIB, Bloomberg
  • 49.
    49 US 10 YearNote: Will Trumponomics be Sustainable 1 2 3 4 5 6 7 1/28/2000 1/28/2003 1/28/2006 1/28/2009 1/28/2012 1/28/2015 US 10 Year Note Trump effect Source: STANLIB, Bloomberg Taper Tantrum
  • 50.
    10 Year RealYields – data correct as 21st March 2017 -3 -2 -1 0 1 2 3 4
  • 51.
    Bonds spreads couldstill compress 5,00 5,50 6,00 6,50 7,00 7,50 8,00 8,50 9,00 9,50 10,00 SA 10Y vs JP 10Y 10Y AGG AGG since GFC 3,00 4,00 5,00 6,00 7,00 8,00 9,00 10,00 SA 10Y Spread to Bunds 4,00 4,50 5,00 5,50 6,00 6,50 7,00 7,50 8,00 8,50 SA 10Y Spread to UST 6 7 8 9 10 11 12 13 14 15 SA 10 Yr vs Peers Average R186
  • 52.
    Valuation SPX isn’t overlyexpensive on PE basis
  • 53.
    Valuation Median EV/EBITDA ratioin US has rarely been higher 53 Source: Societe Generale
  • 54.
    Keep Calm –Equity Risk Premium Earnings yield using TREND earnings, less 10 year Treasury yield Source: Capital 54
  • 55.
    Growth and Inflation Risksto growth are symmetrical - inflation risks “might” be skewed to the upside 55 Growth Inflation “Fatter” Tails “Fatter” Tails Base Case of Higher Inflation Left Tail Clipped Meaningful Risks to the Upside
  • 56.
    Flatter Frontier Risk returntrade off – Four asset class portfolio Source: Morgan Stanley Expected Returns1990-2009 2010-2016 Best Return/Vol: 5.8%/3.1% Best Return/Vol: 5.3%/4.3% Best Return/Vol: 2.2%/3.5% 56
  • 57.
  • 58.
    58 • We believethat market inefficiencies can be exploited through active asset allocation, creating attractive risk- adjusted and Absolute returns. • We adjust asset allocation dynamically, based on a bottom up valuation-based process, top-down research and a pragmatic view of what drives markets. We do not buy-and-hope • We prepare for adverse outcomes and protect portfolios accordingly. Nimble, tactical and dynamic should win the day • We manage against downside volatility of returns. Patience to wait for risk-reward to be in our favour • Core team members have a boutique mentality with combined investment experience of in excess of 60 years with diverse, complementary and specialist skillsets. • Proven True Absolute Return funds with strong track record of downside protection • We love volatility. “It is not the strongest of the species that survives. It is the one that is most adaptable to change” Why STANLIB Absolute Returns?
  • 59.
  • 60.
    Collective Investment Schemes(CIS) in Securities are generally medium to long-term investments. An investment in the participations of a collective investment scheme in securities is not the same as a deposit with a banking institution. The value of participatory interests may go down as well as up and past performance is not necessarily a guide to the future. CIS are traded at ruling prices and can engage in borrowing and scrip lending. A schedule of fees and charges and maximum commissions is available on request from STANLIB Collective Investments (“the Manager”). Commission and incentives may be paid and if so, would be included in the overall costs. Forward pricing is used. Fluctuations or movements in exchange rates may cause the value of underlying international investments to go up or down. Liberty is a full member of the Association for Savings & Investment SA (ASISA). The Manager is a member of the Liberty group of companies. The information and content of this document are intended to be for information purposes only and STANLIB does not guarantee the suitability or potential value of any information contained herein. STANLIB Wealth Management Limited does not expressly or by implication propose that the products or services offered in this document are appropriate to the particular investment objectives or needs of any existing or prospective client. Potential investors are advised to seek independent advice from an authorised financial adviser in this regard. STANLIB Wealth Management Limited is an authorised Financial Services Provider in terms of the Financial Advisory and Intermediary Services Act 37 of 2002 (Licence No. 26/10/590) Disclaimer 60