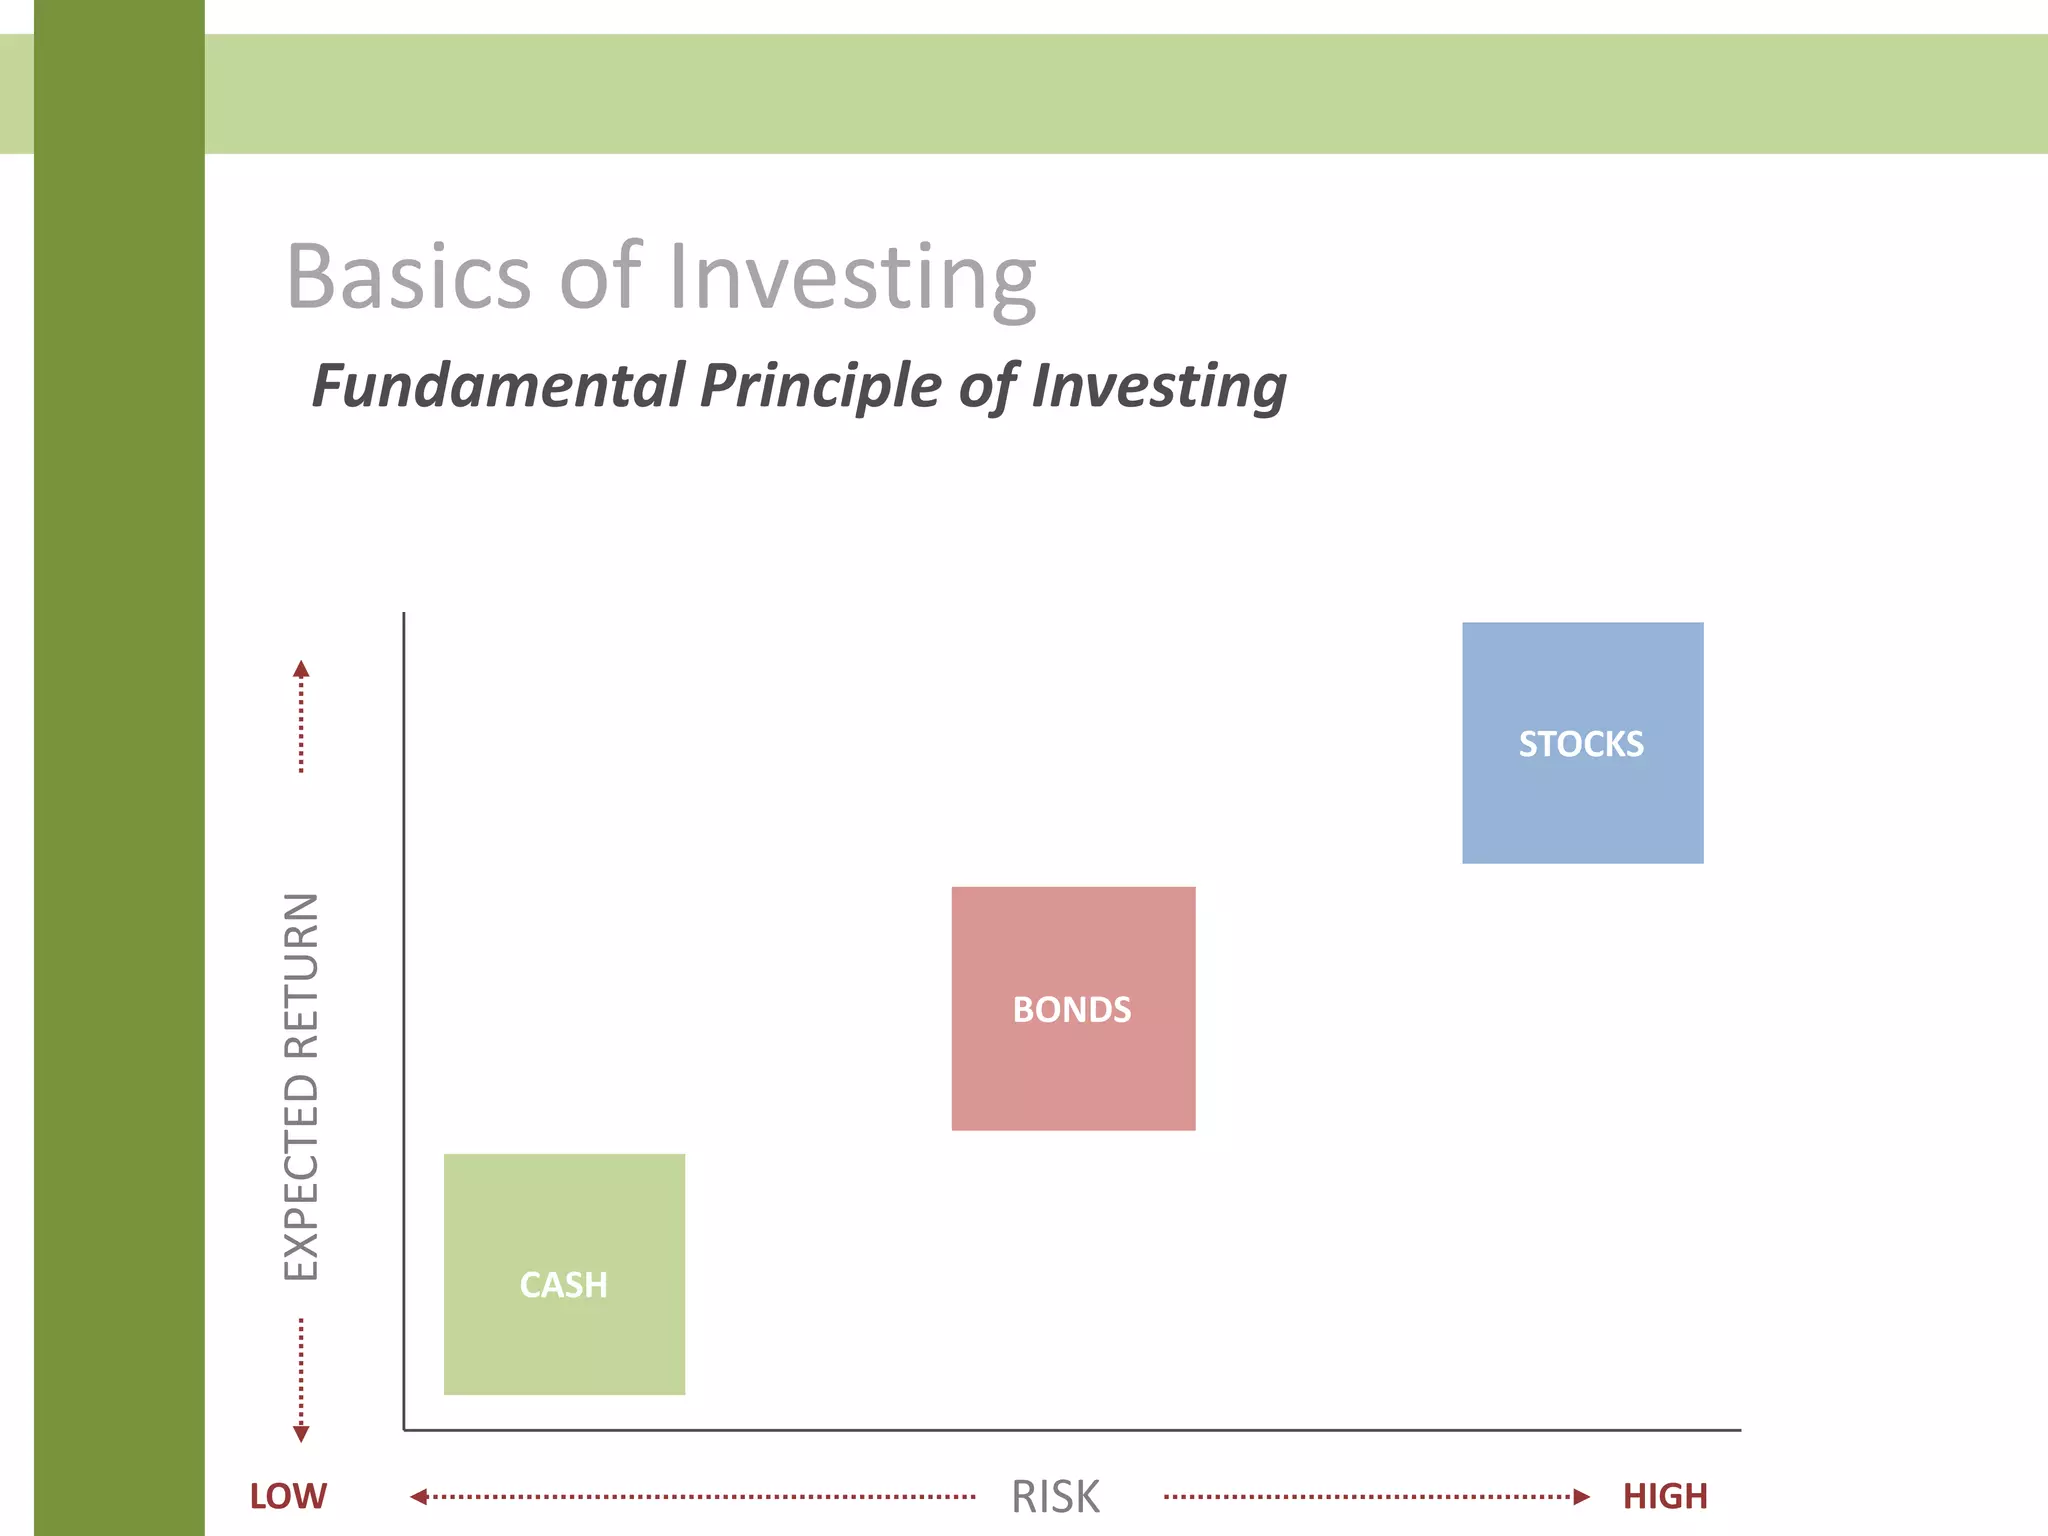
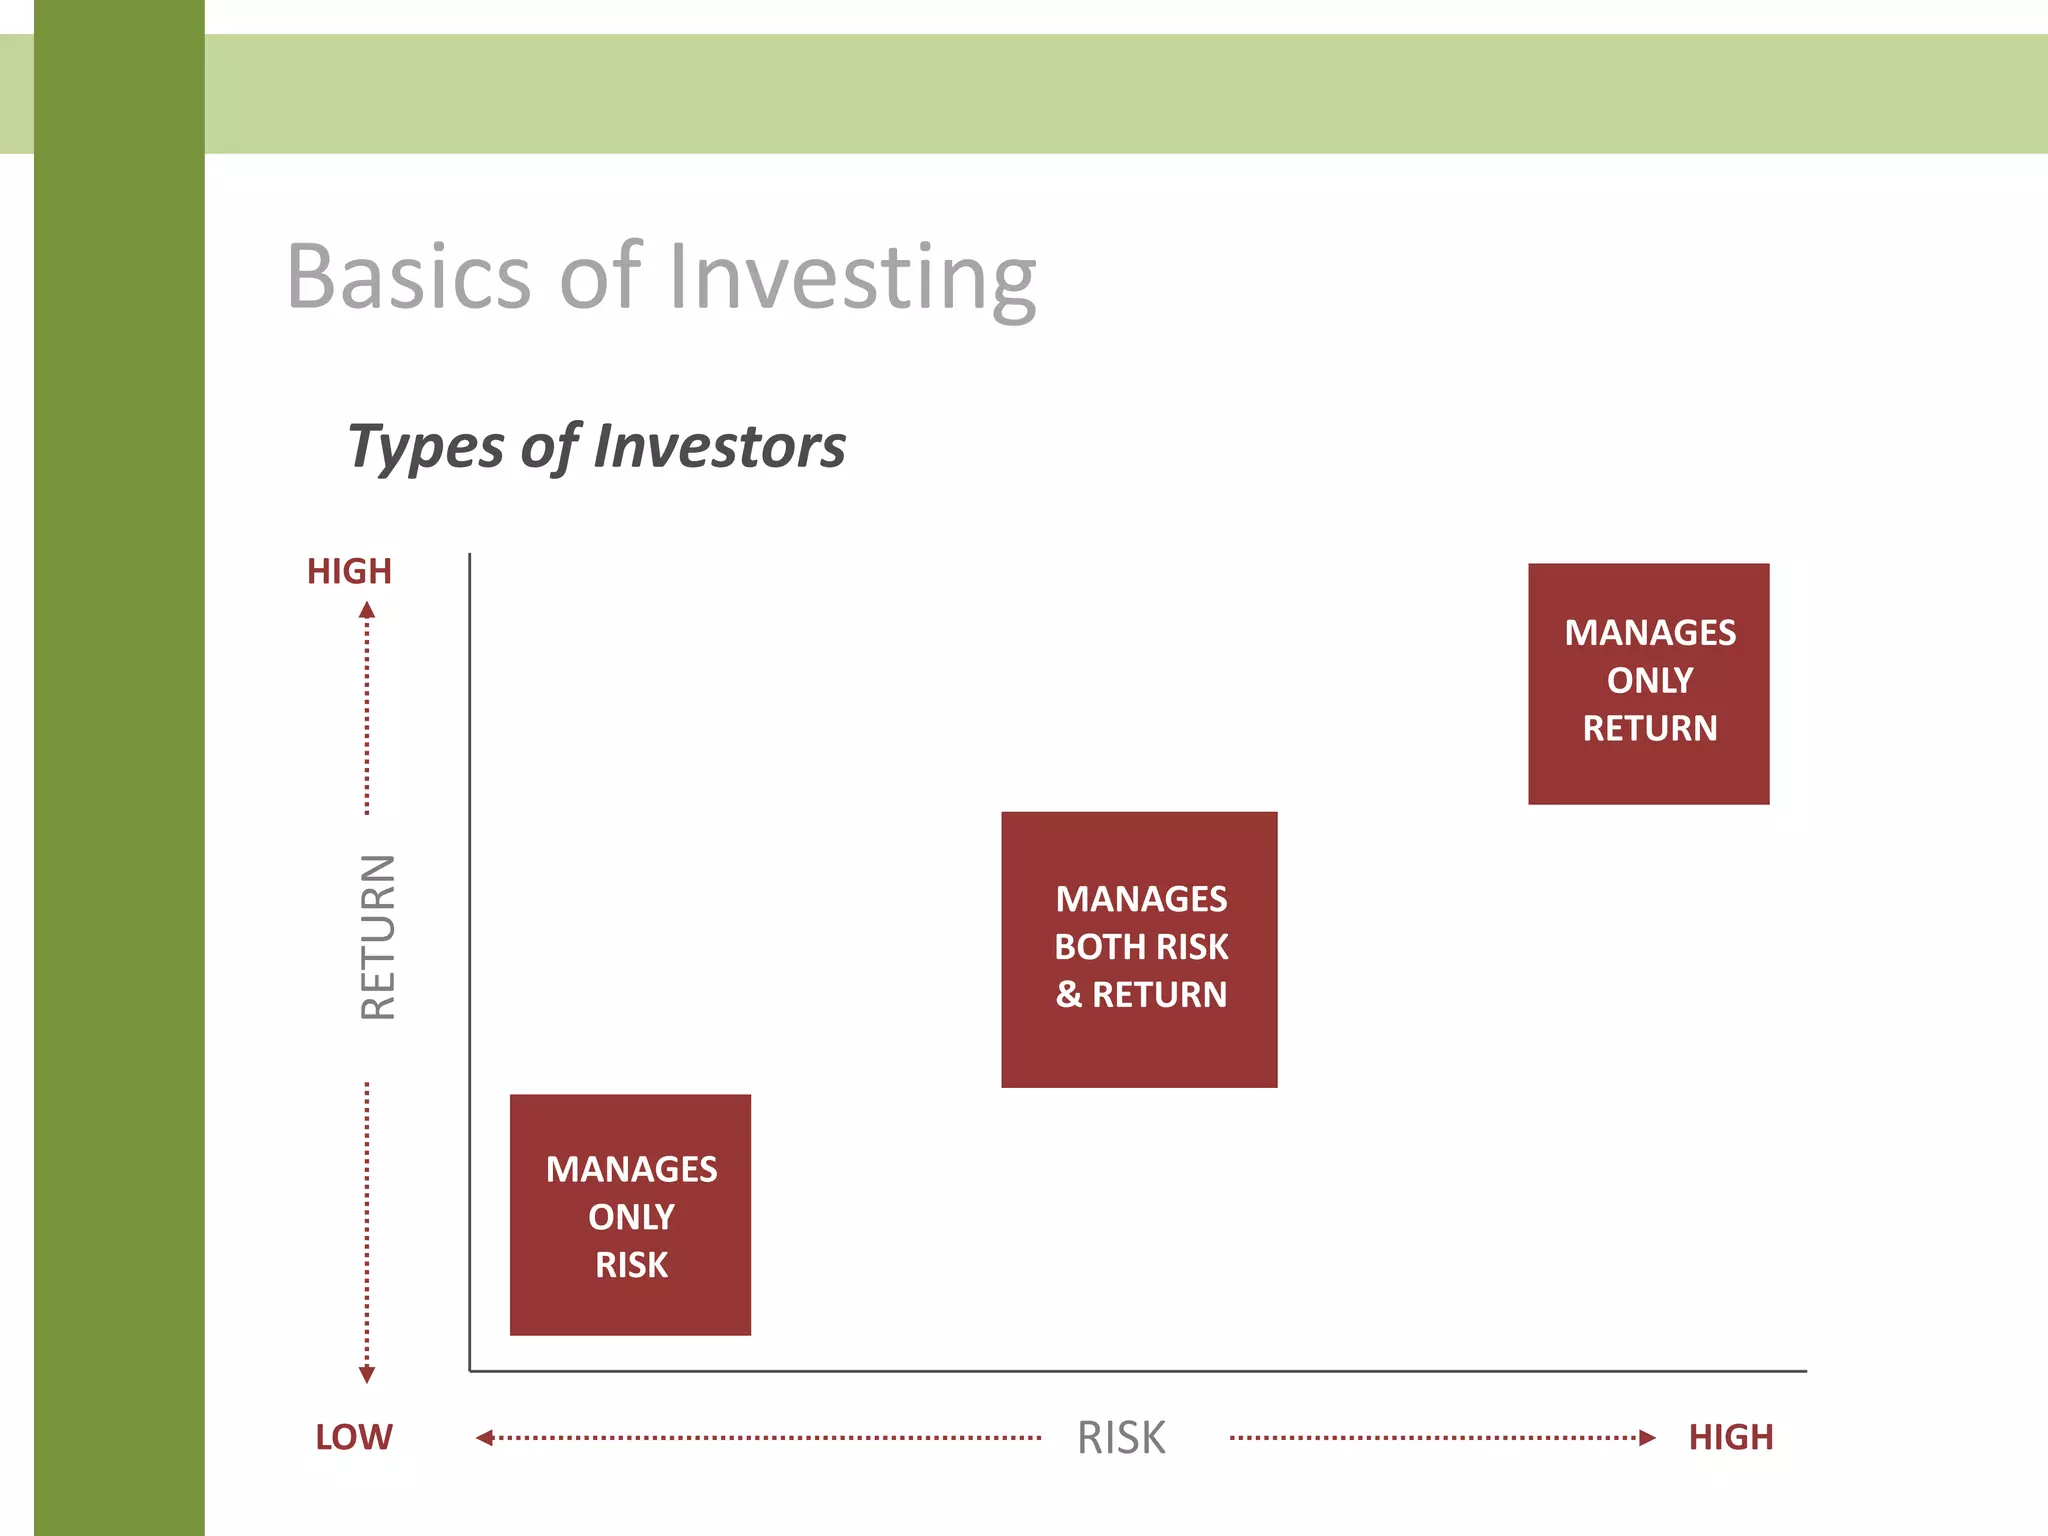
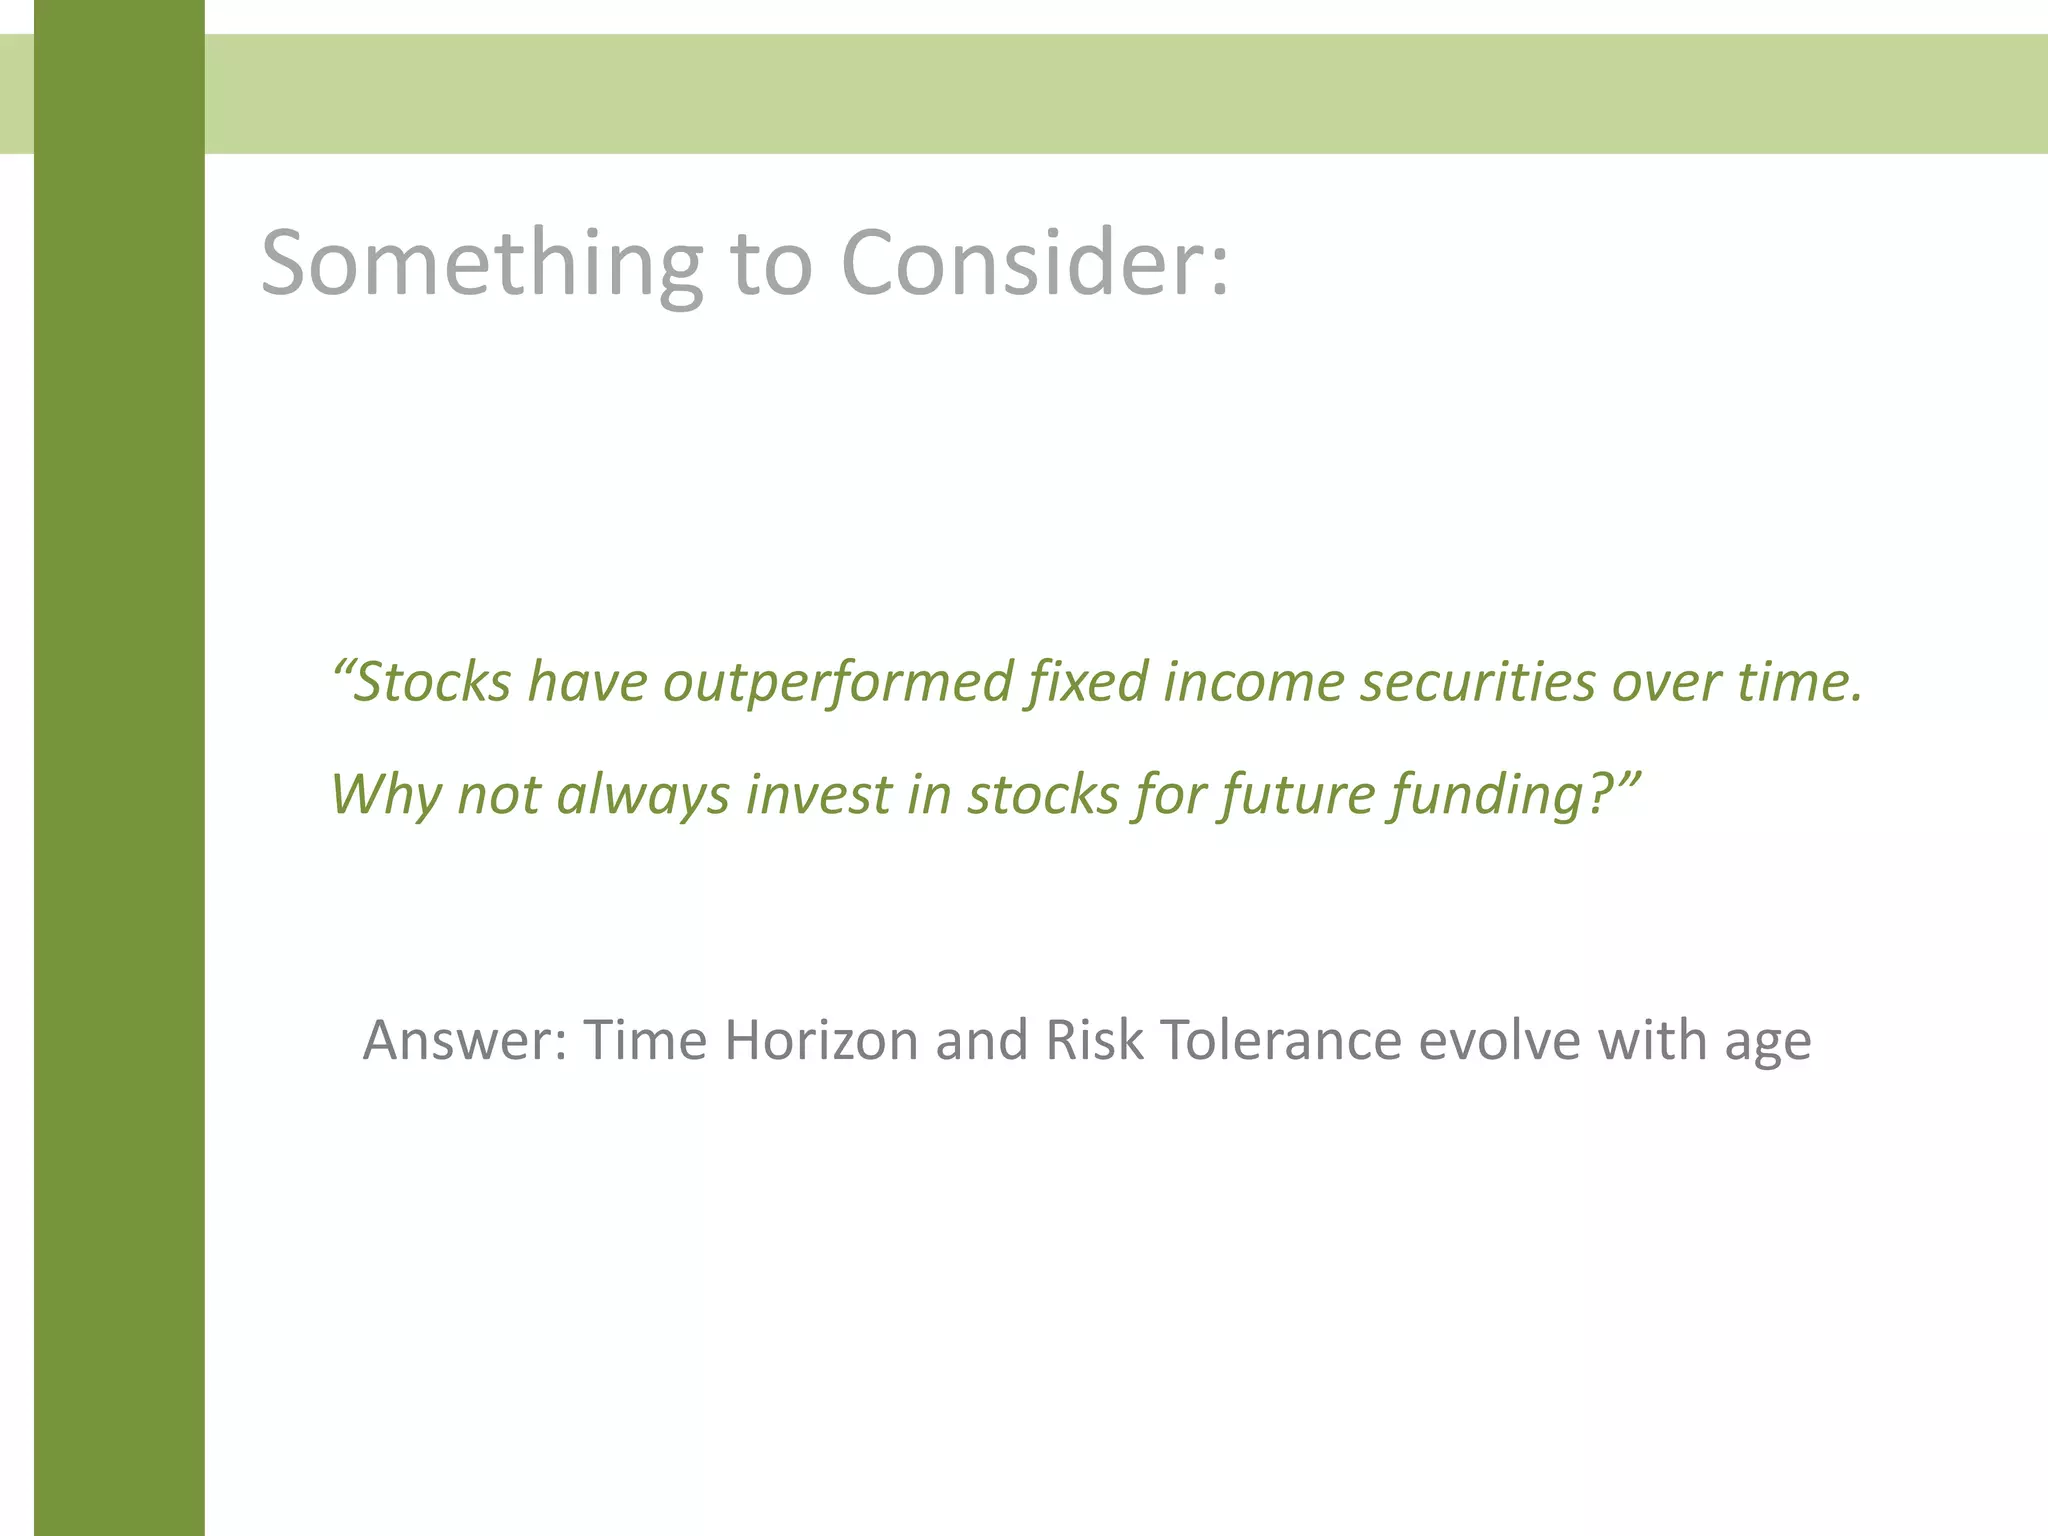
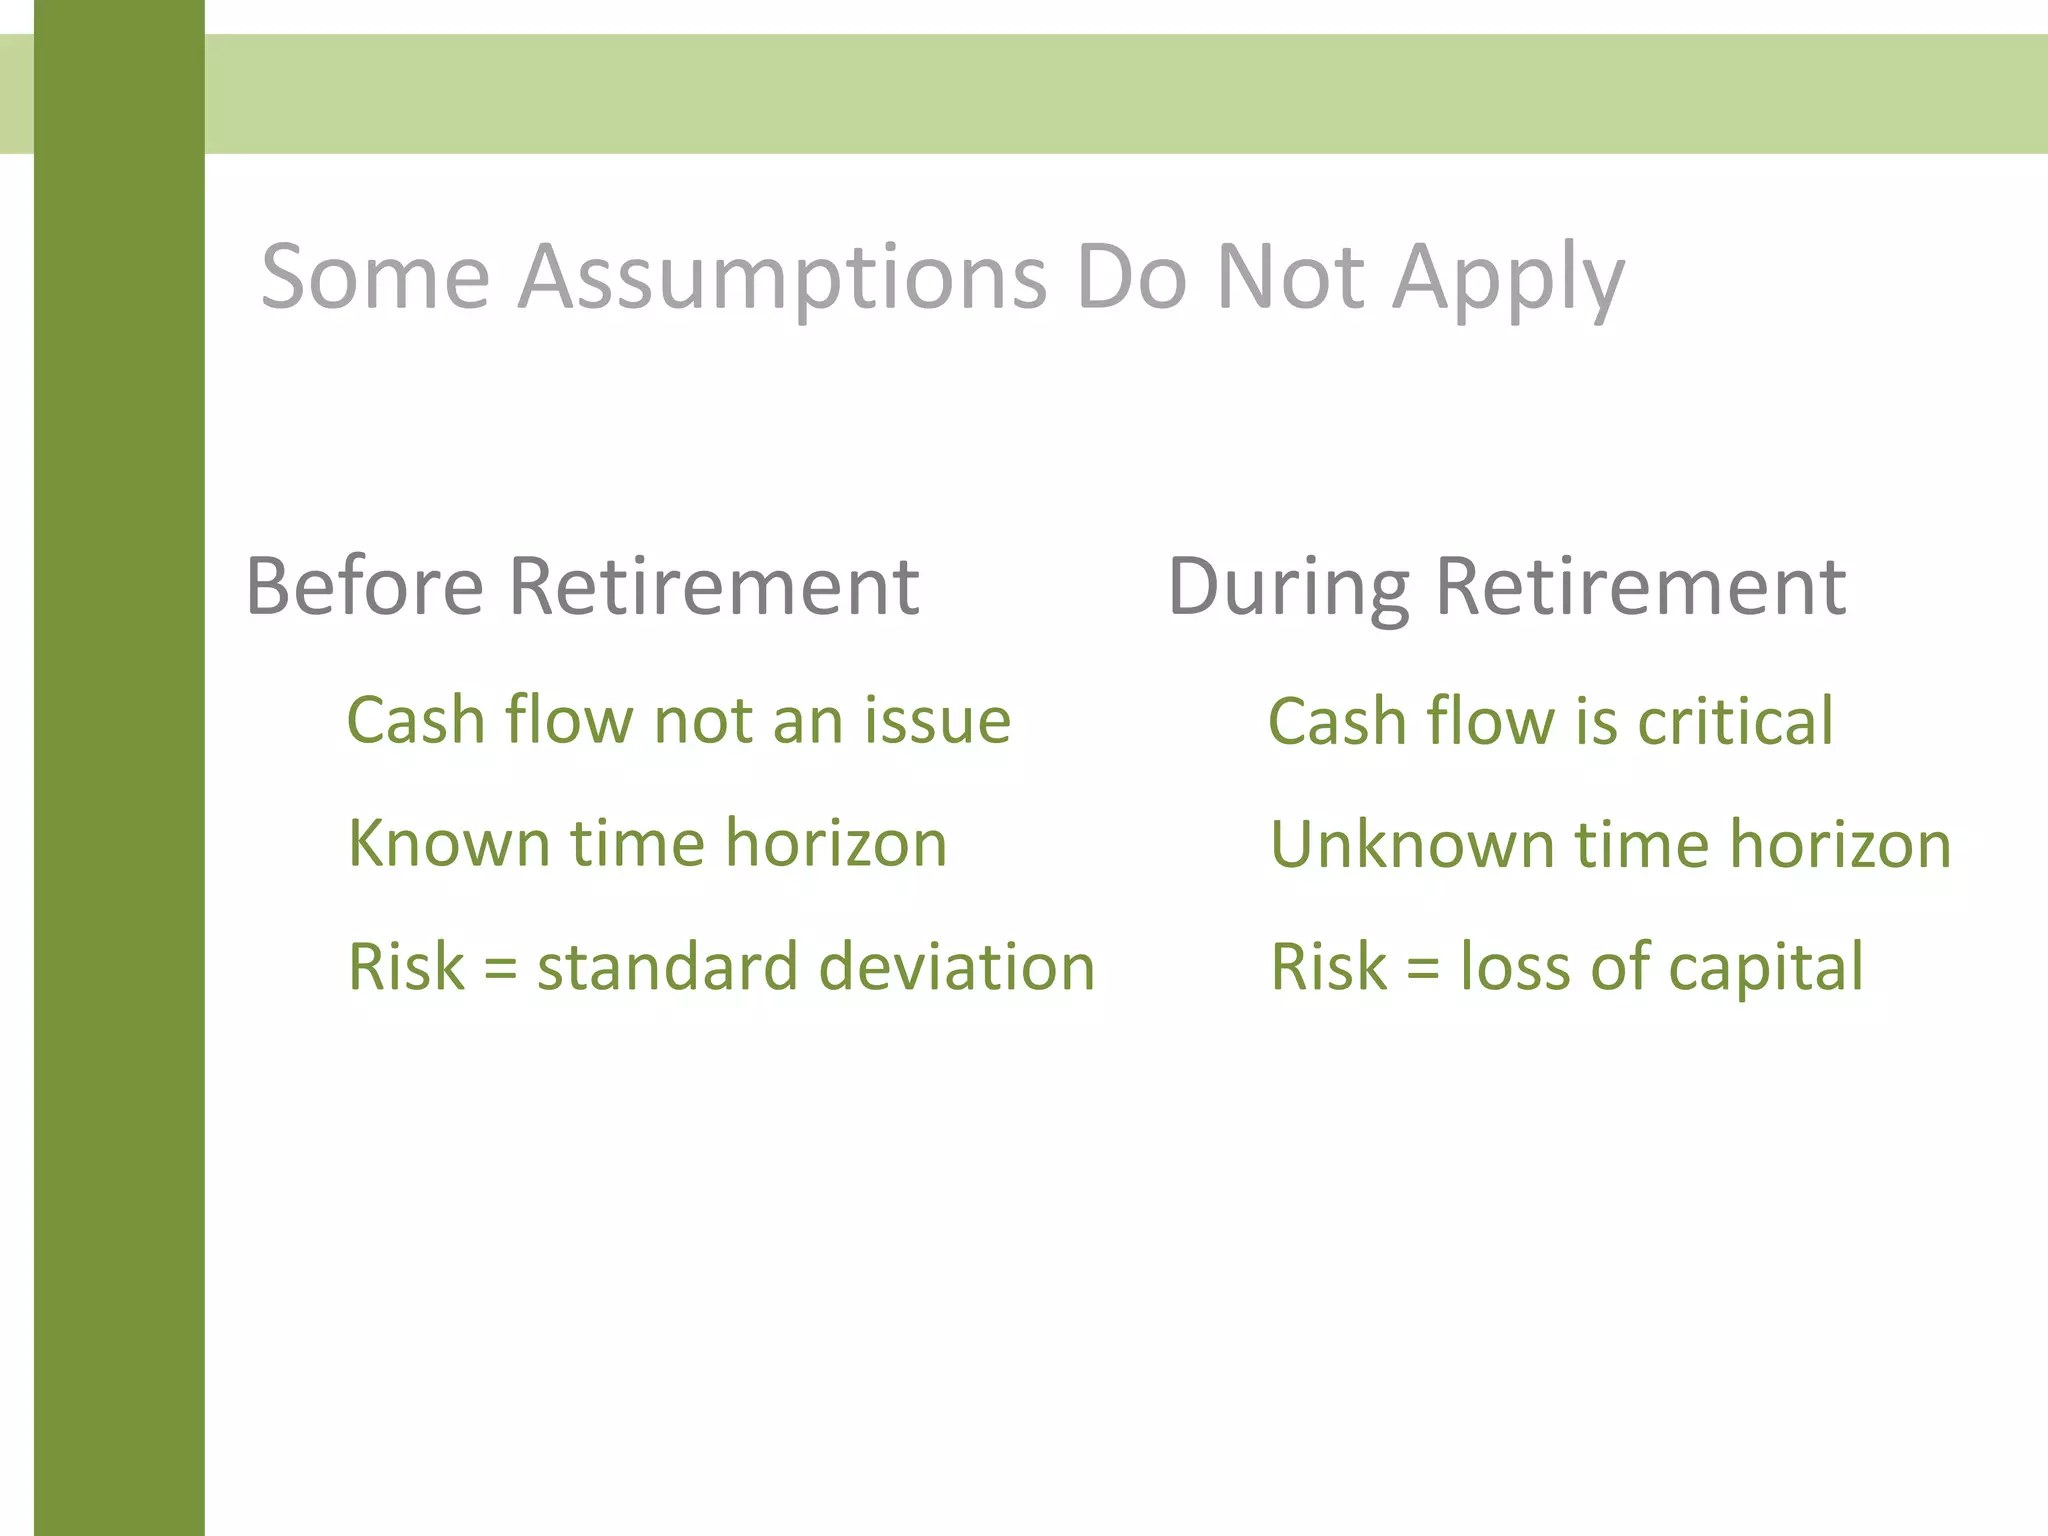
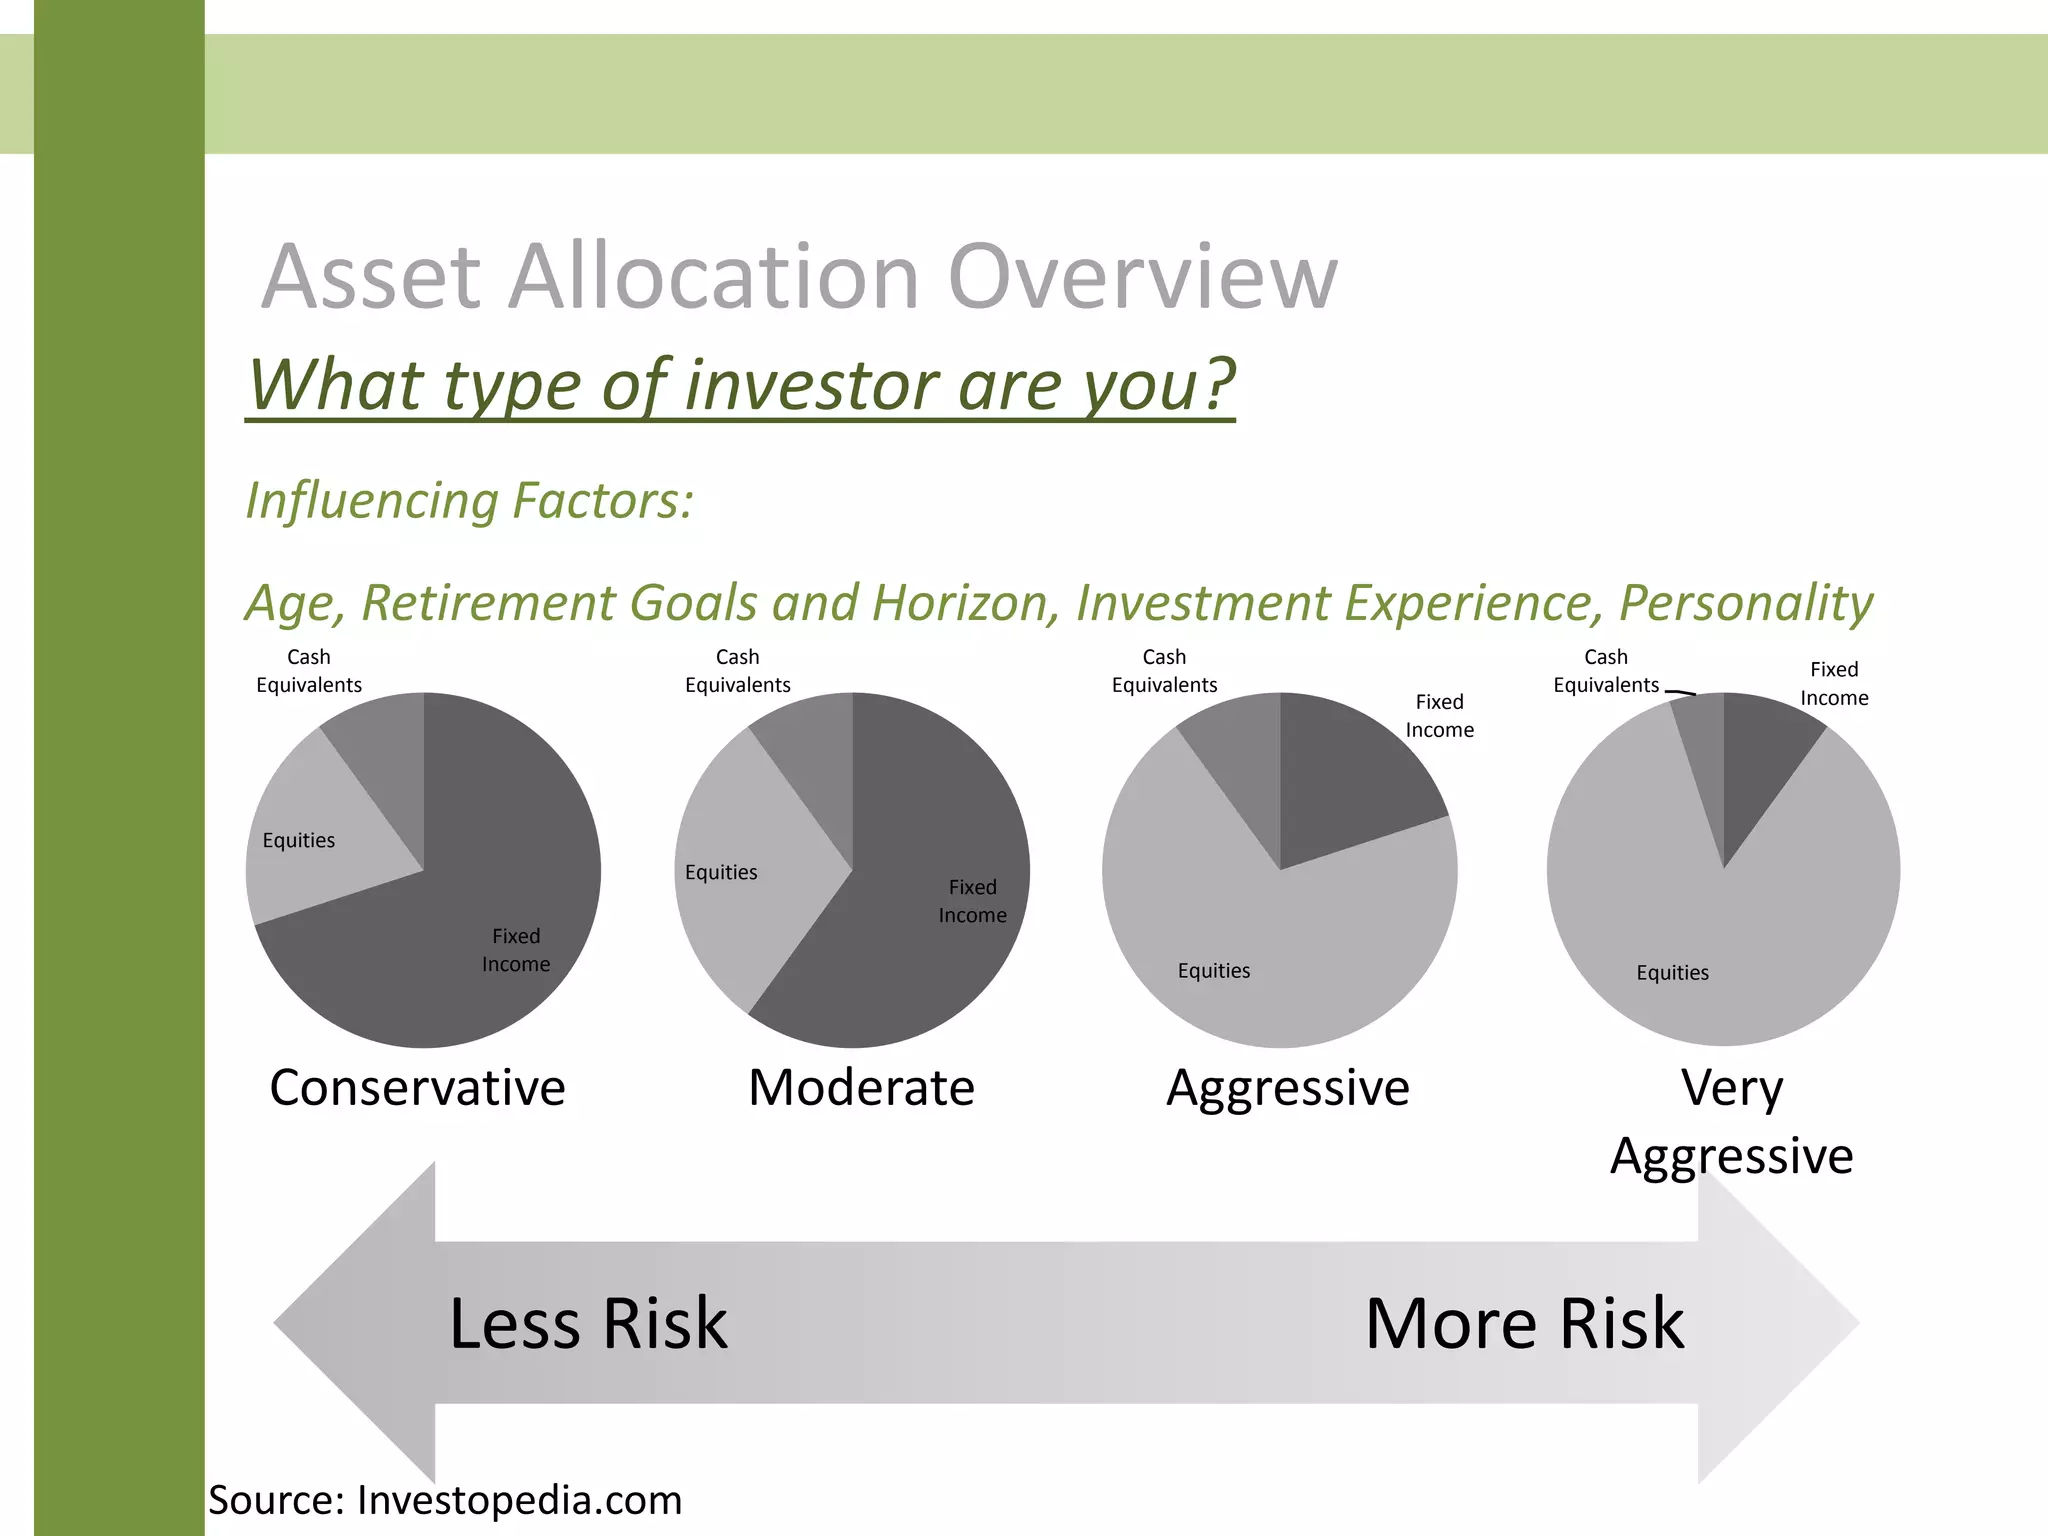
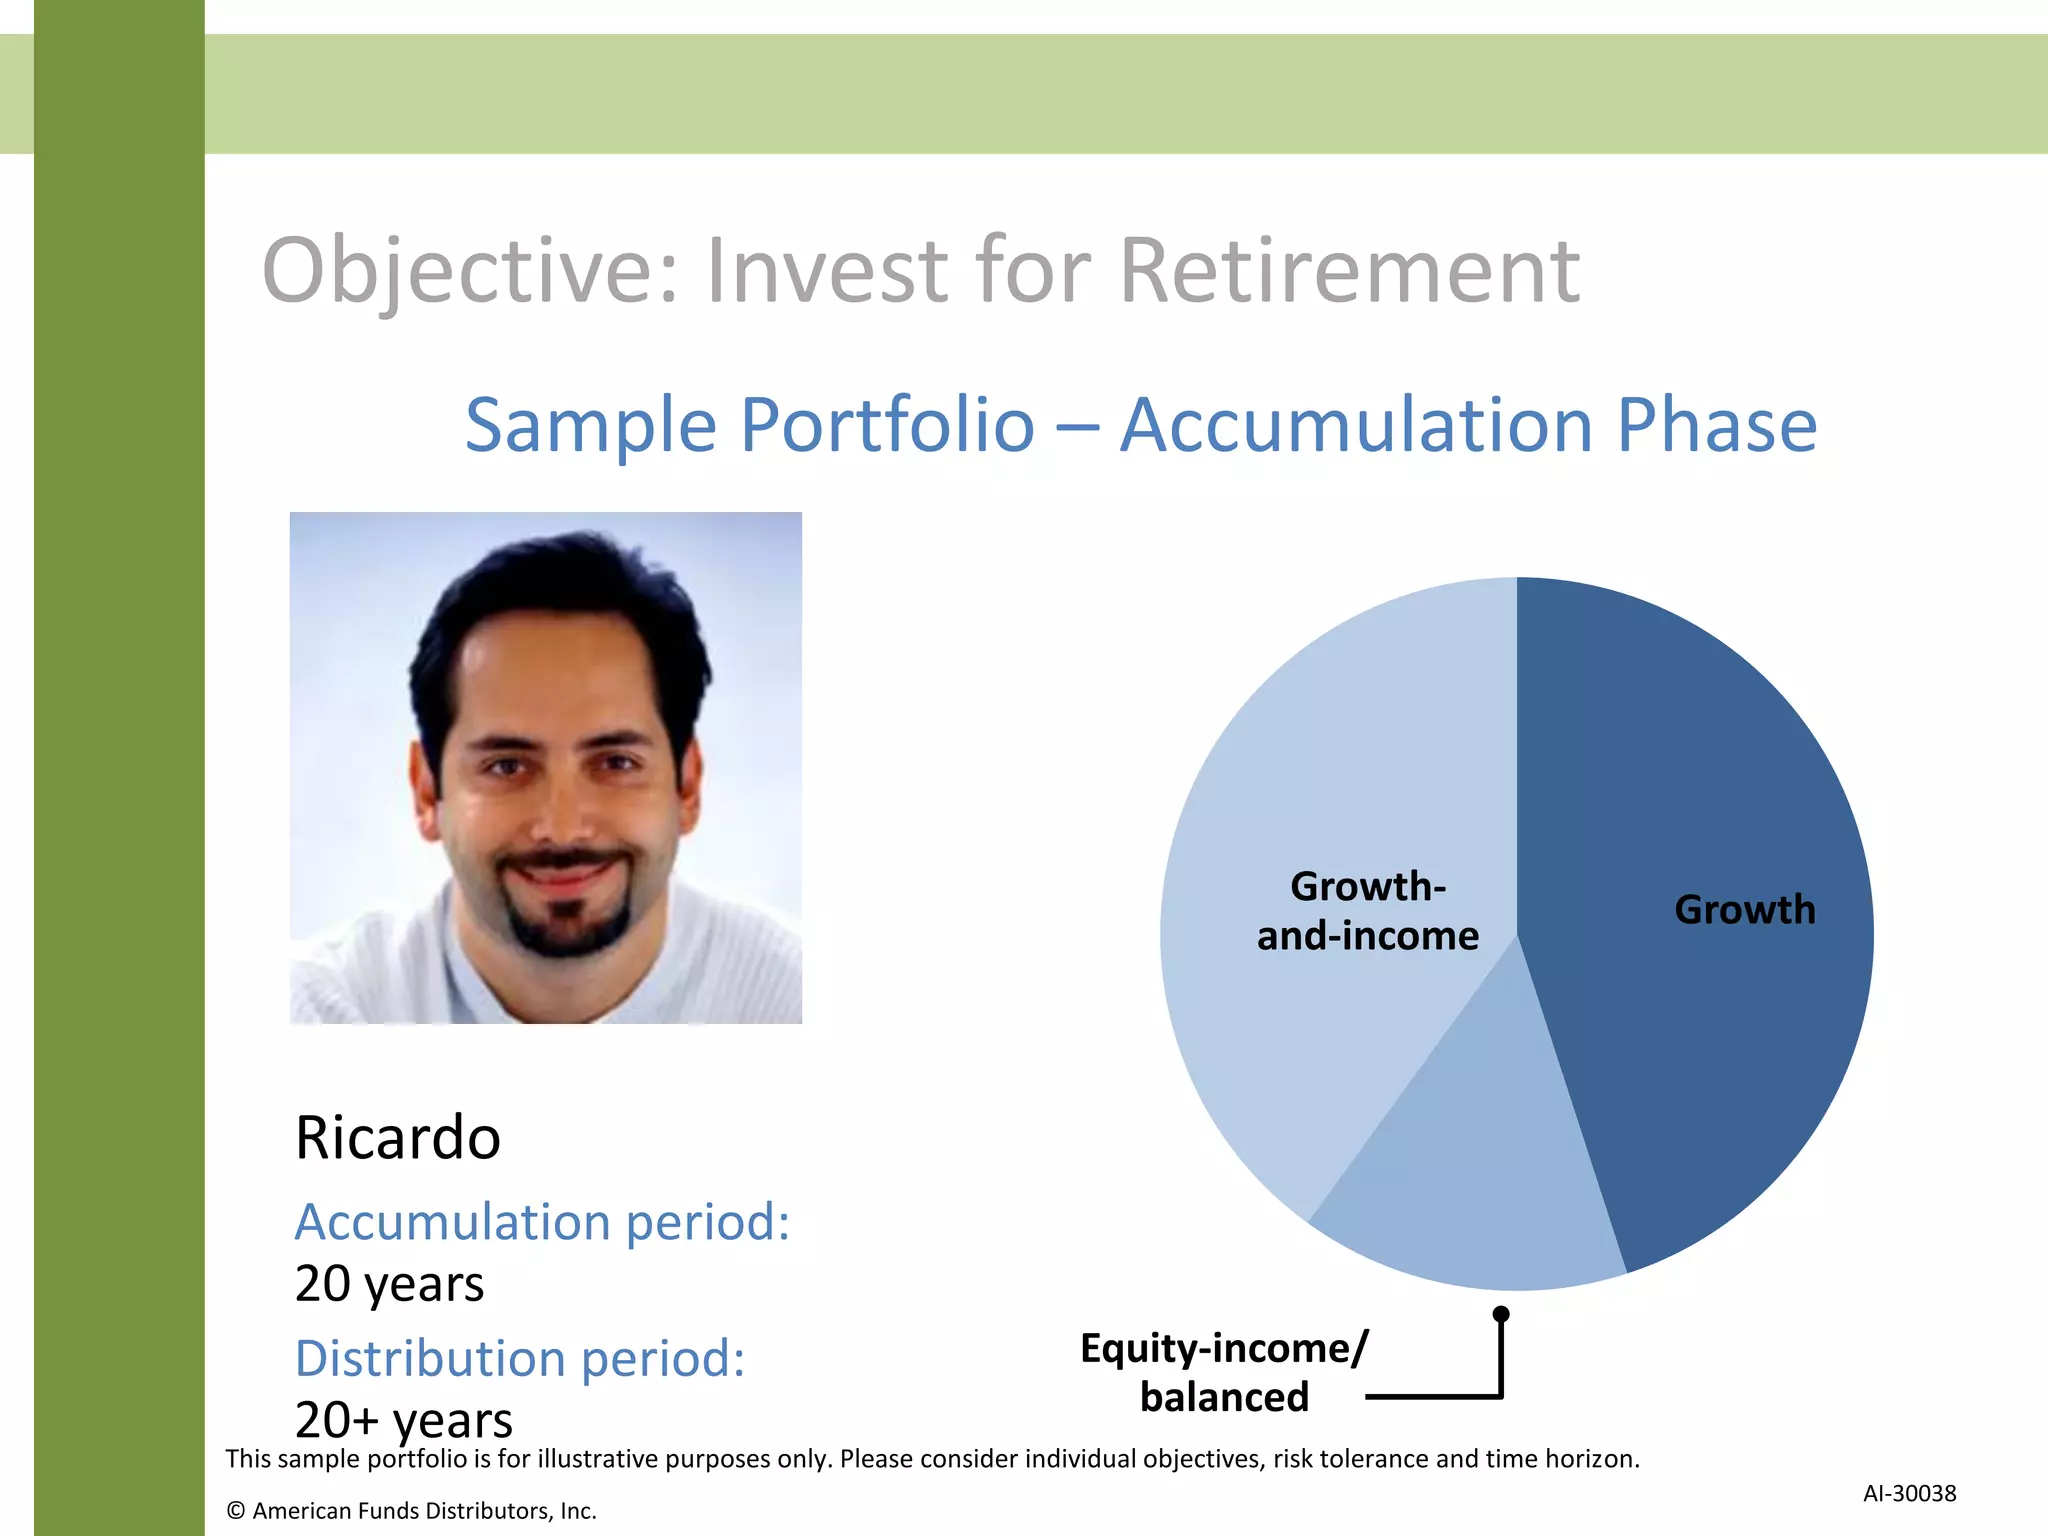
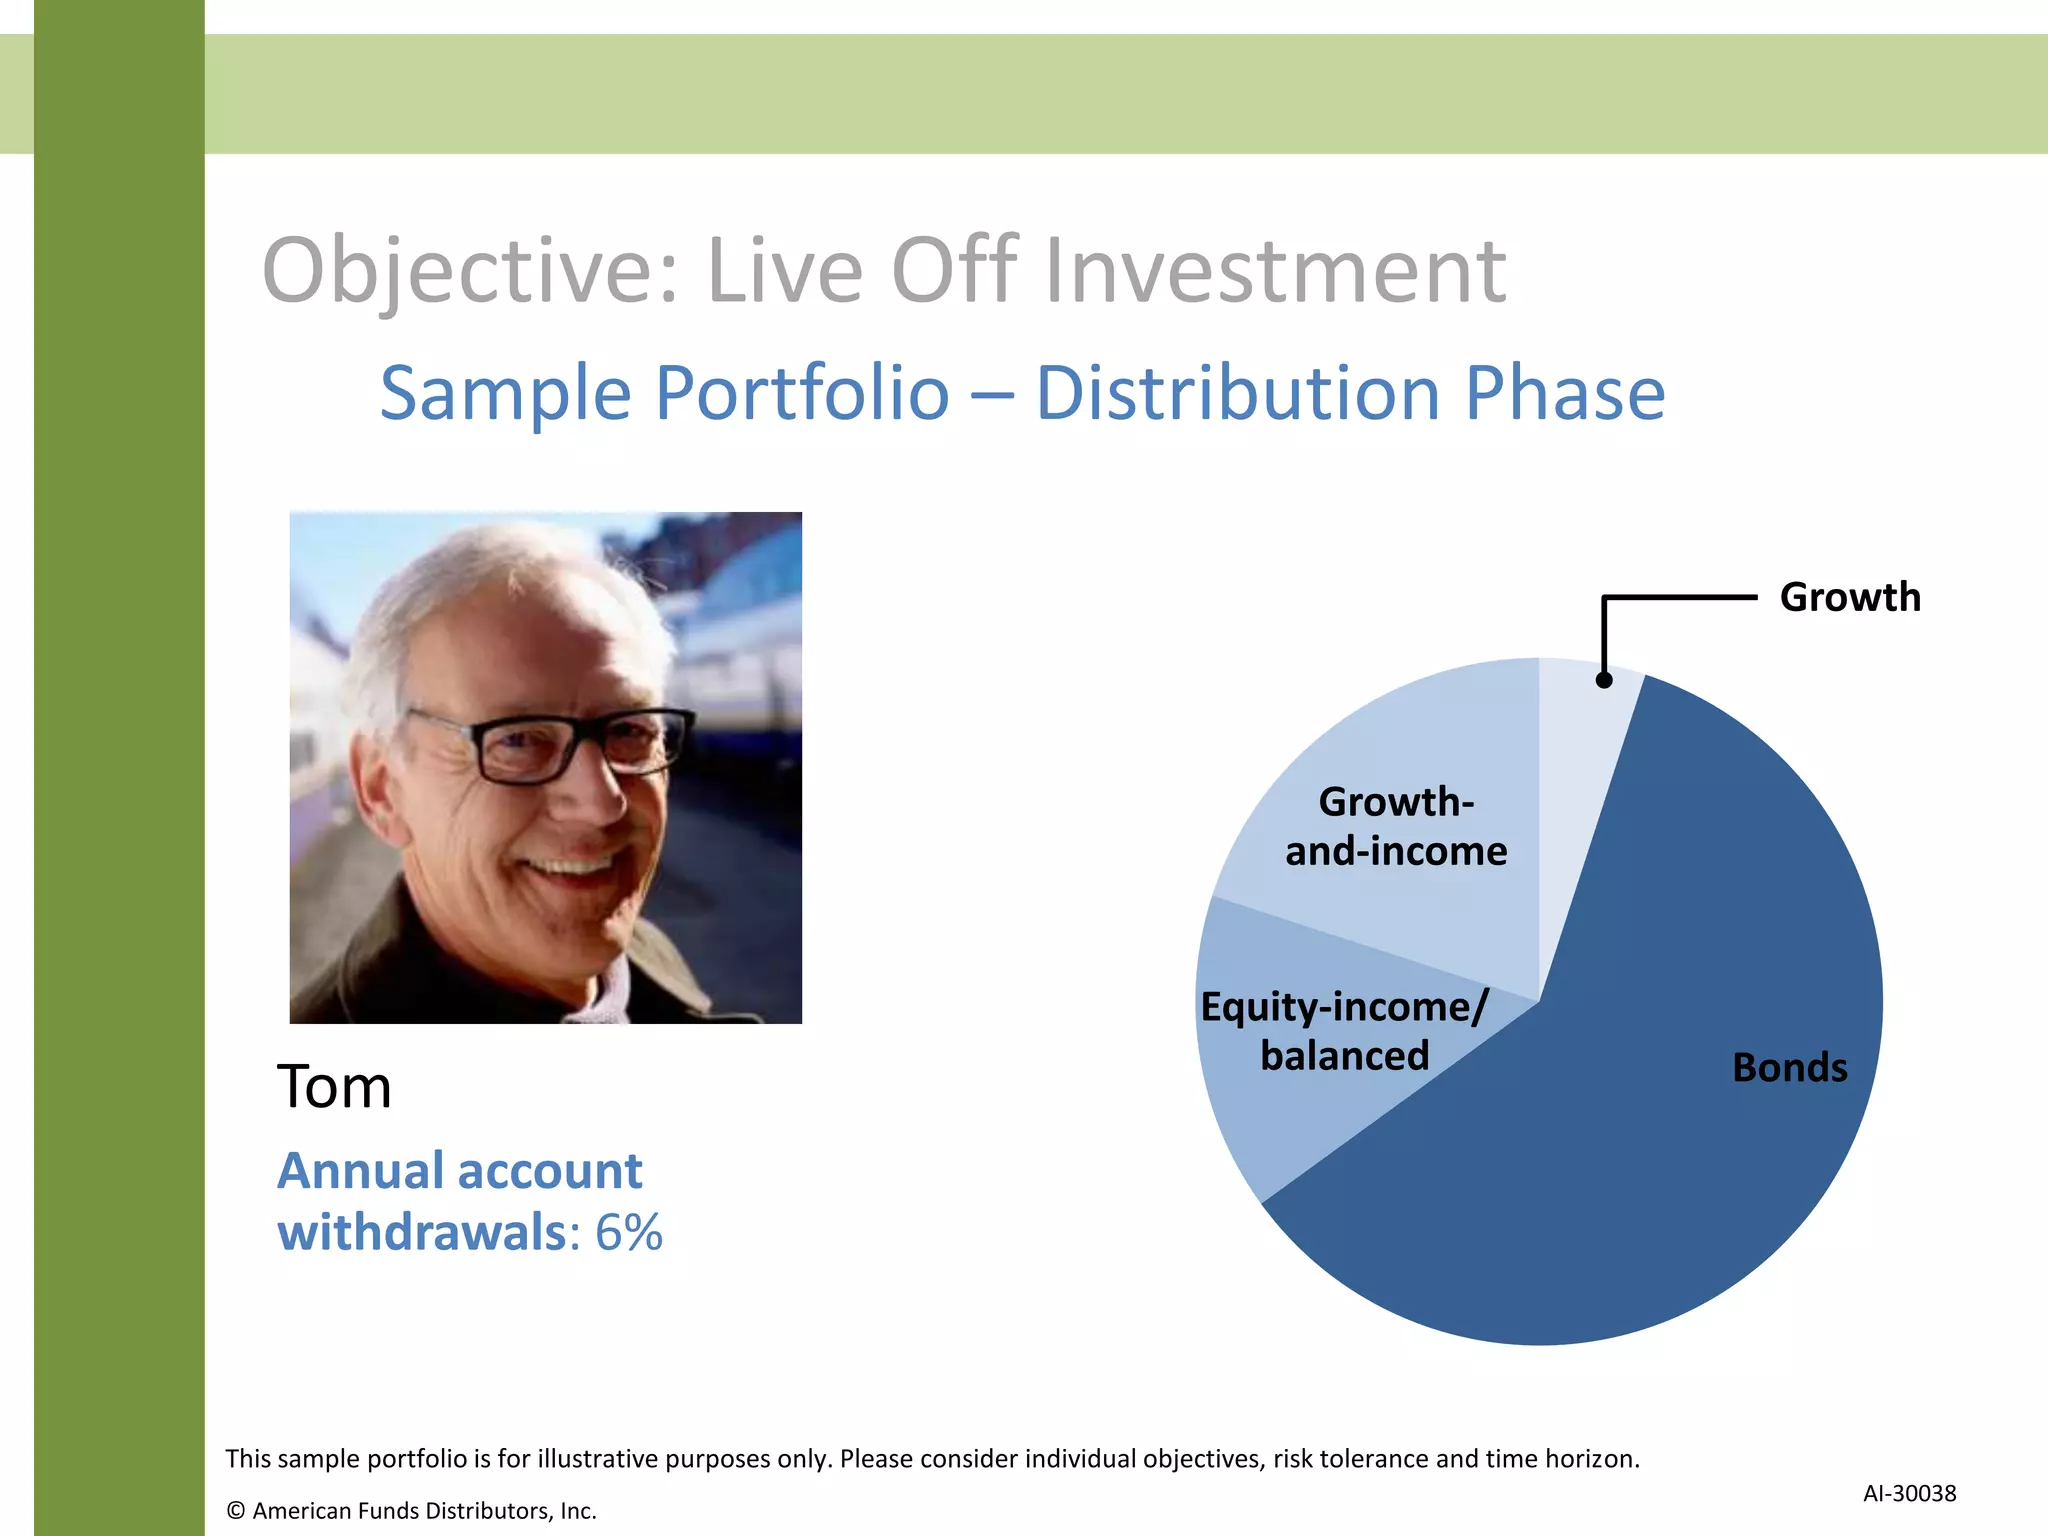
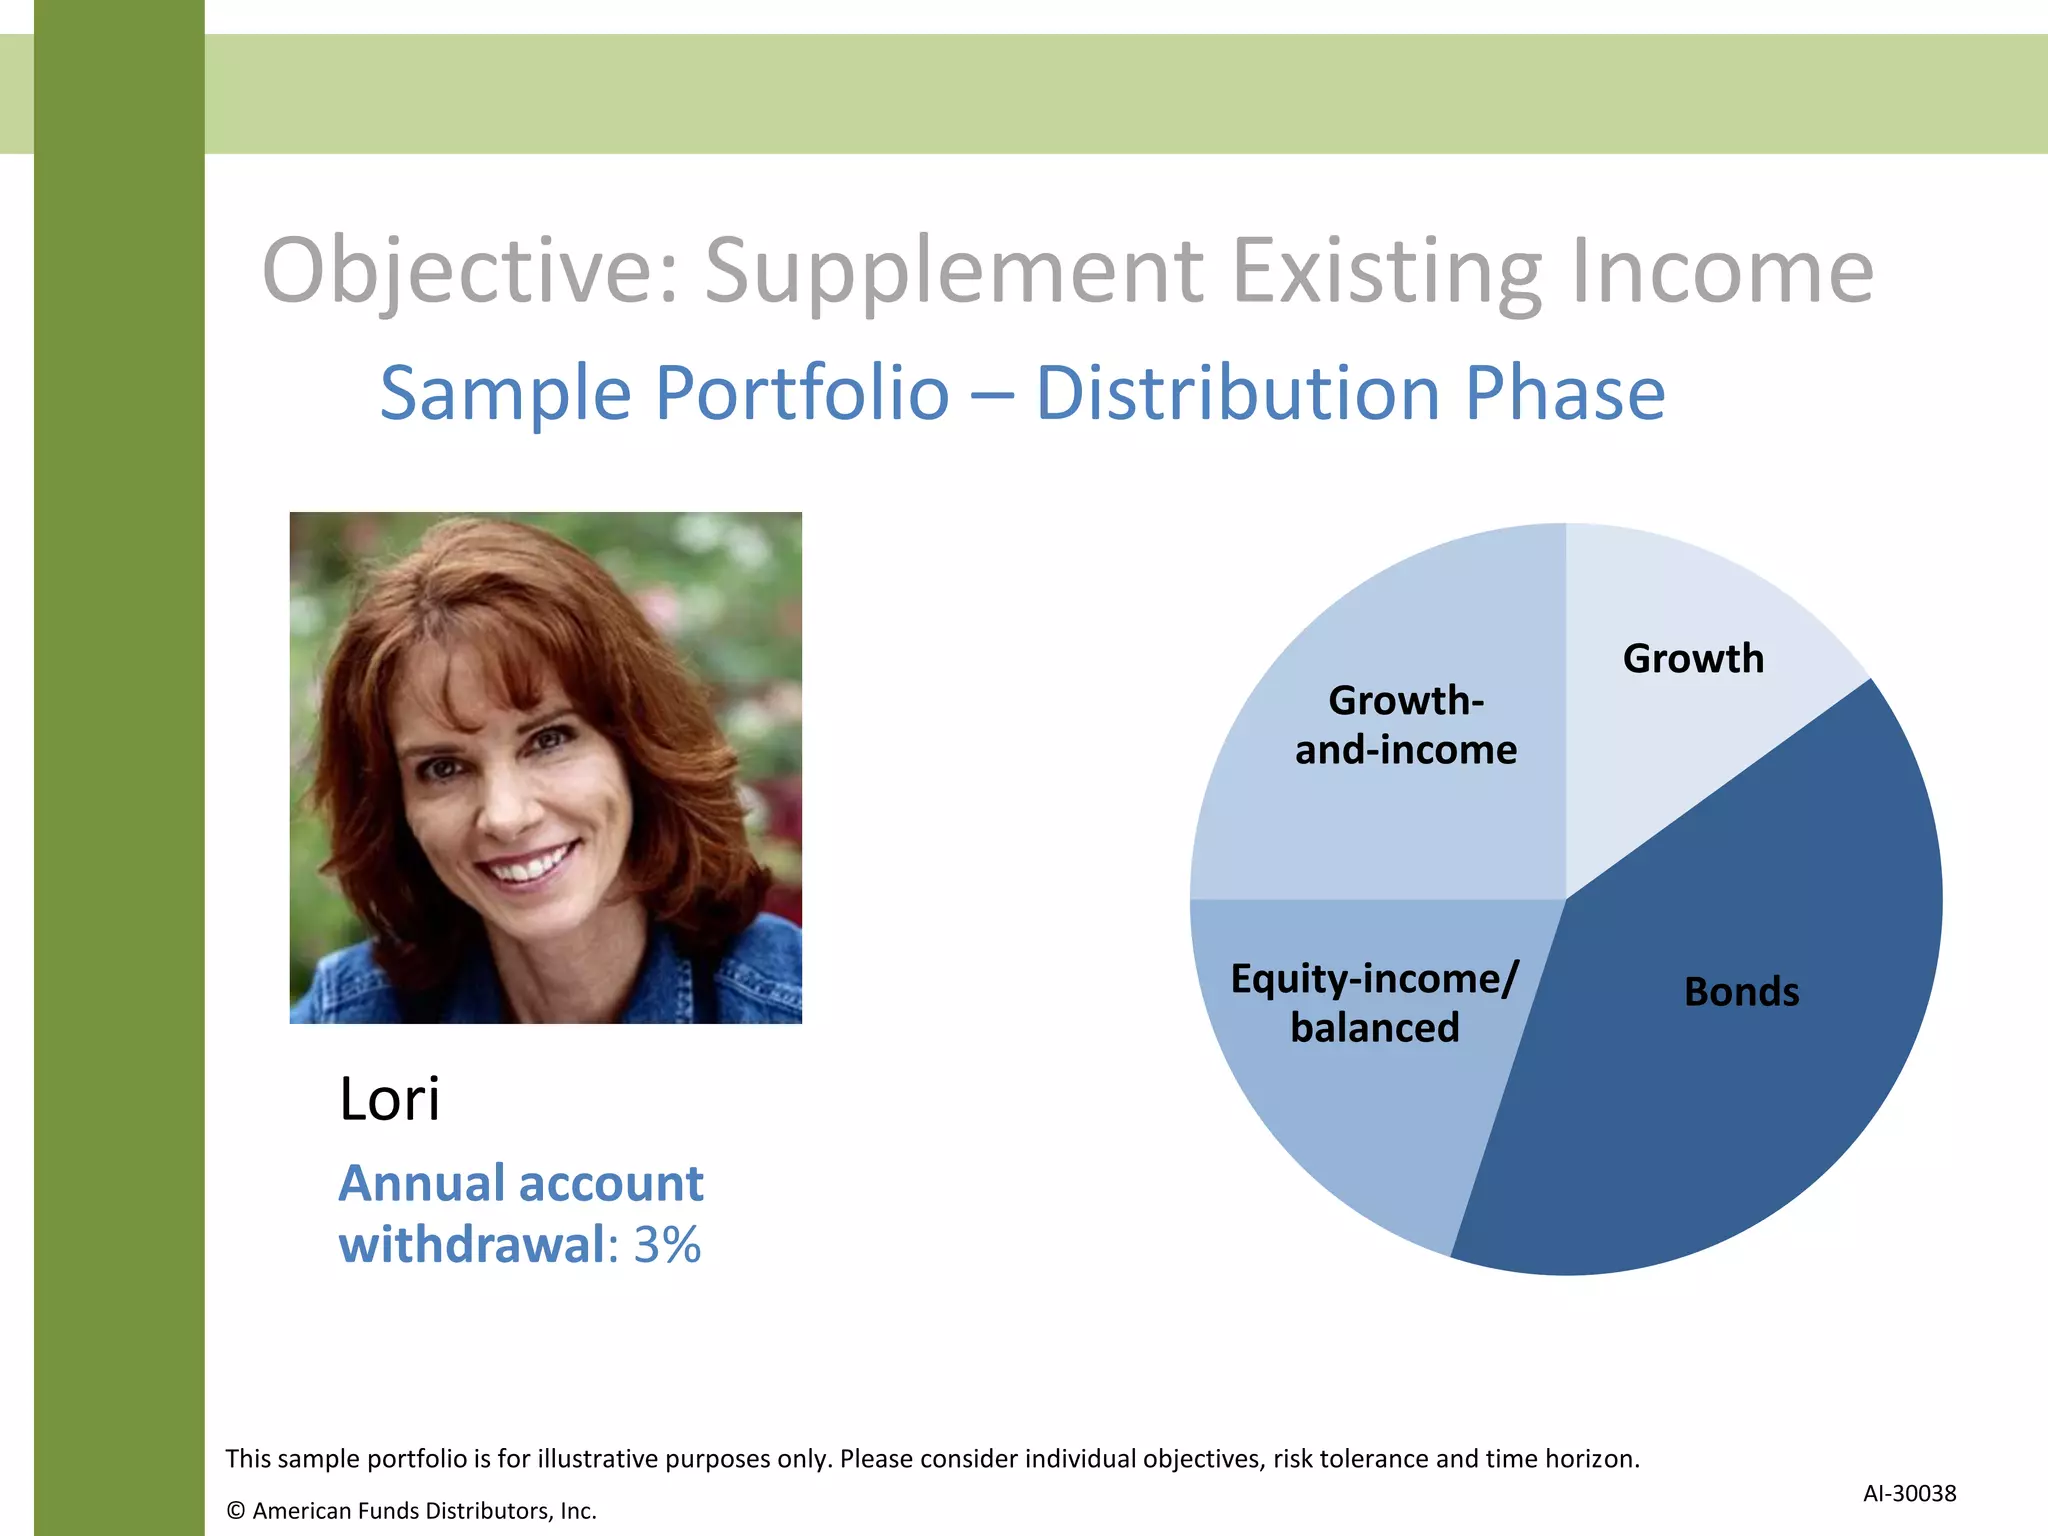
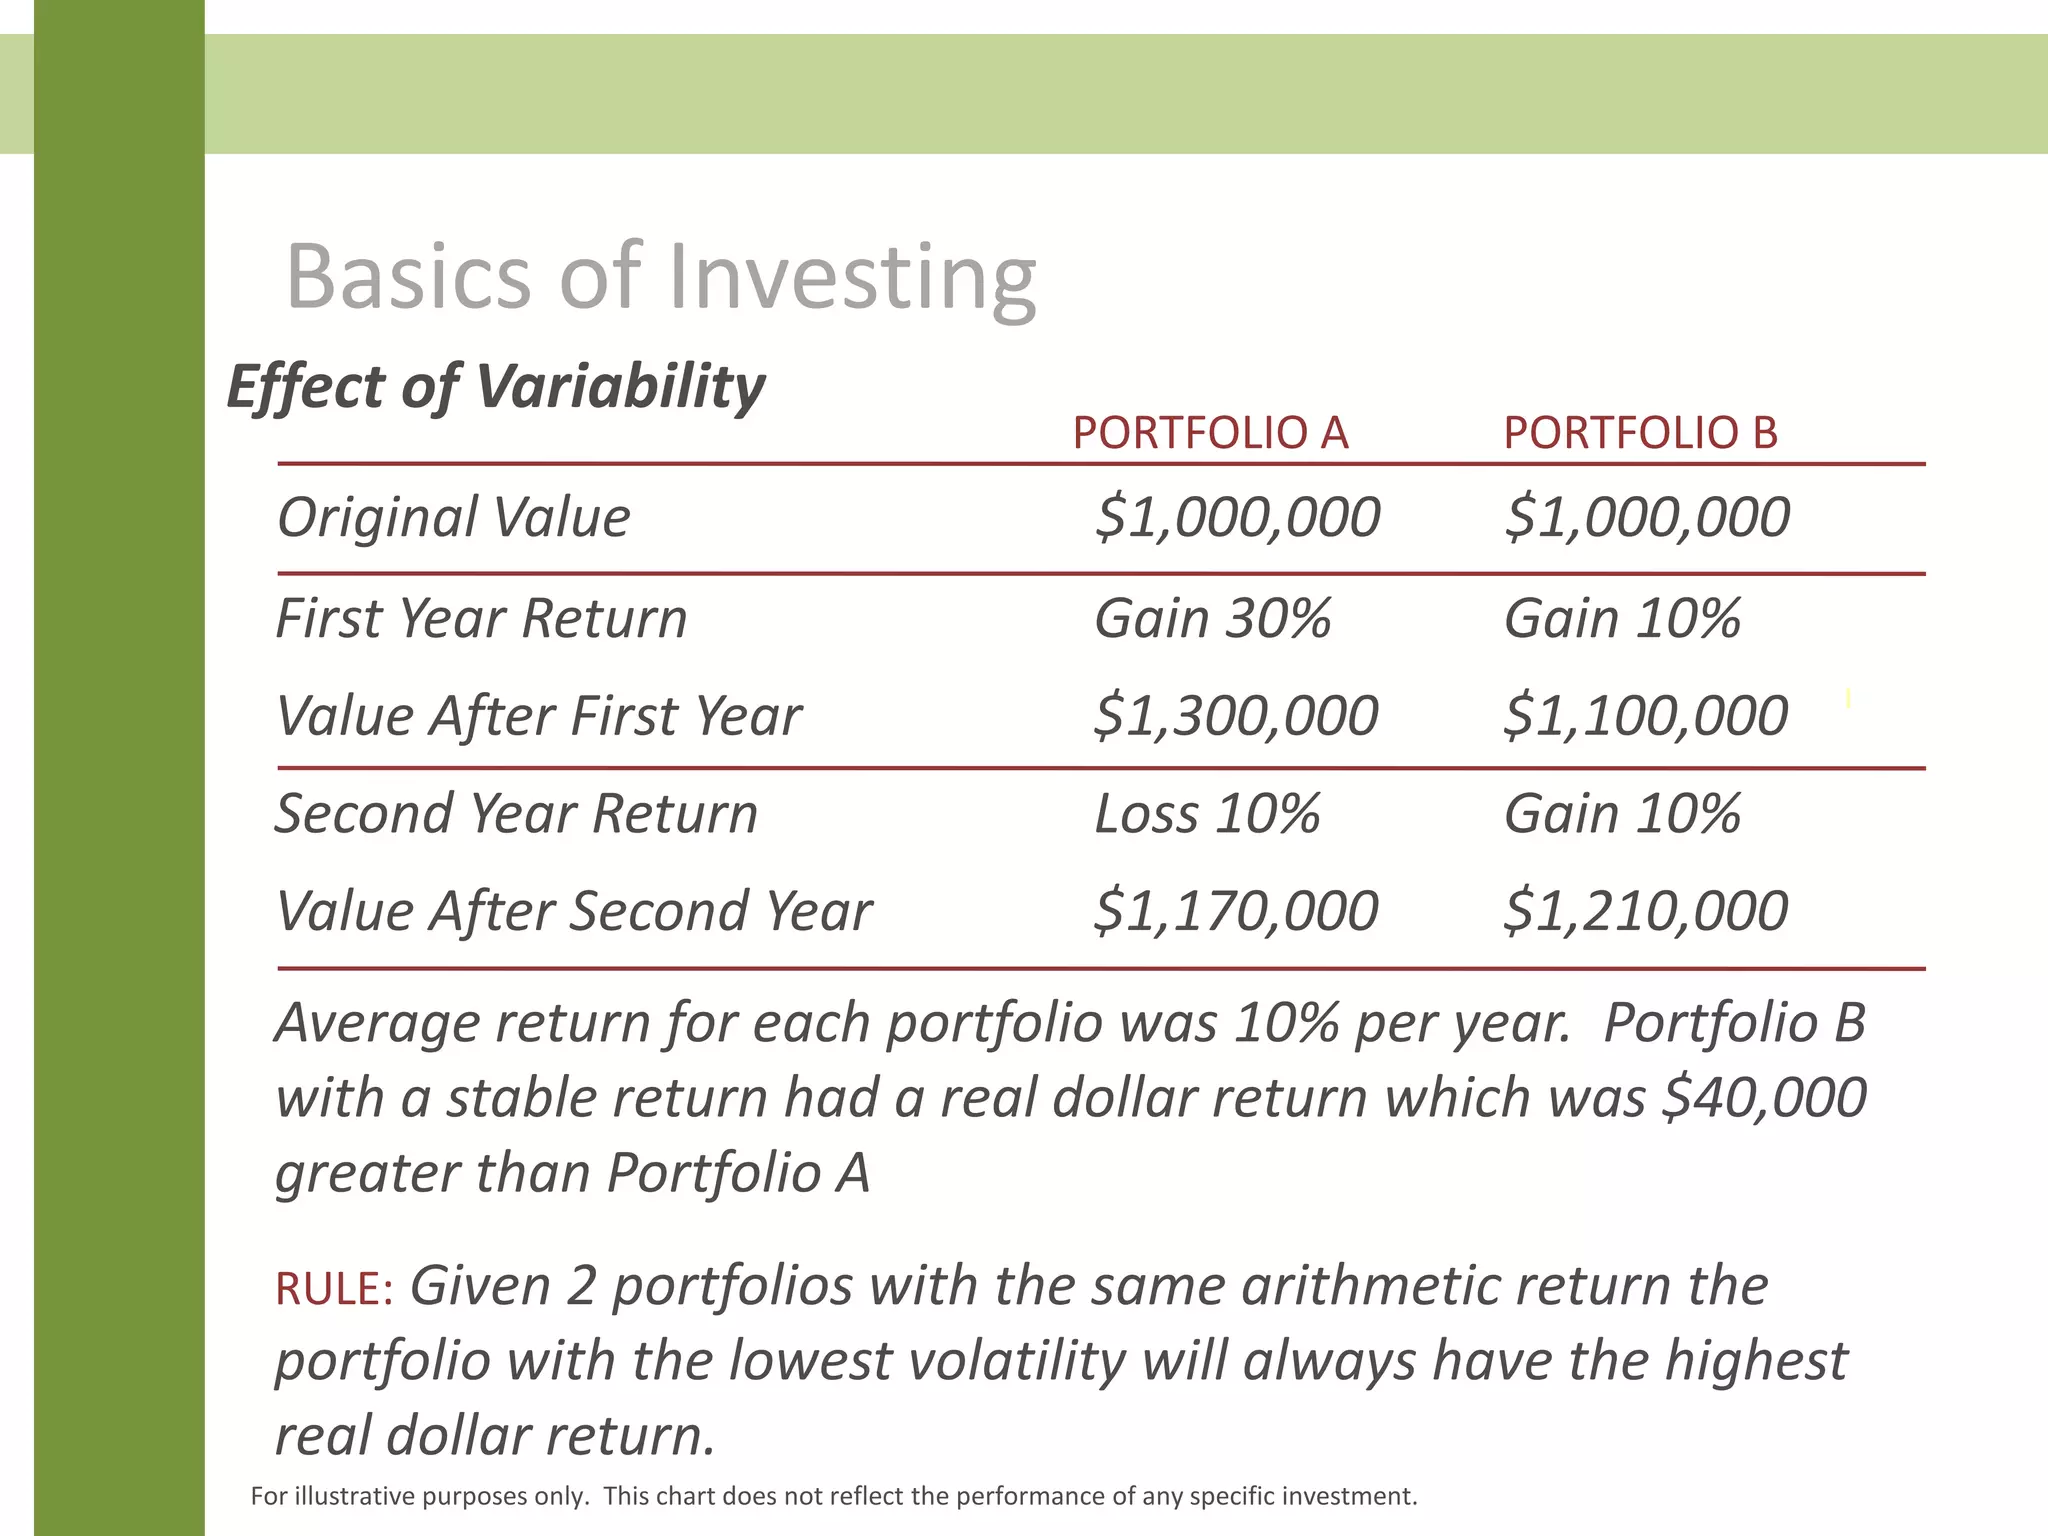
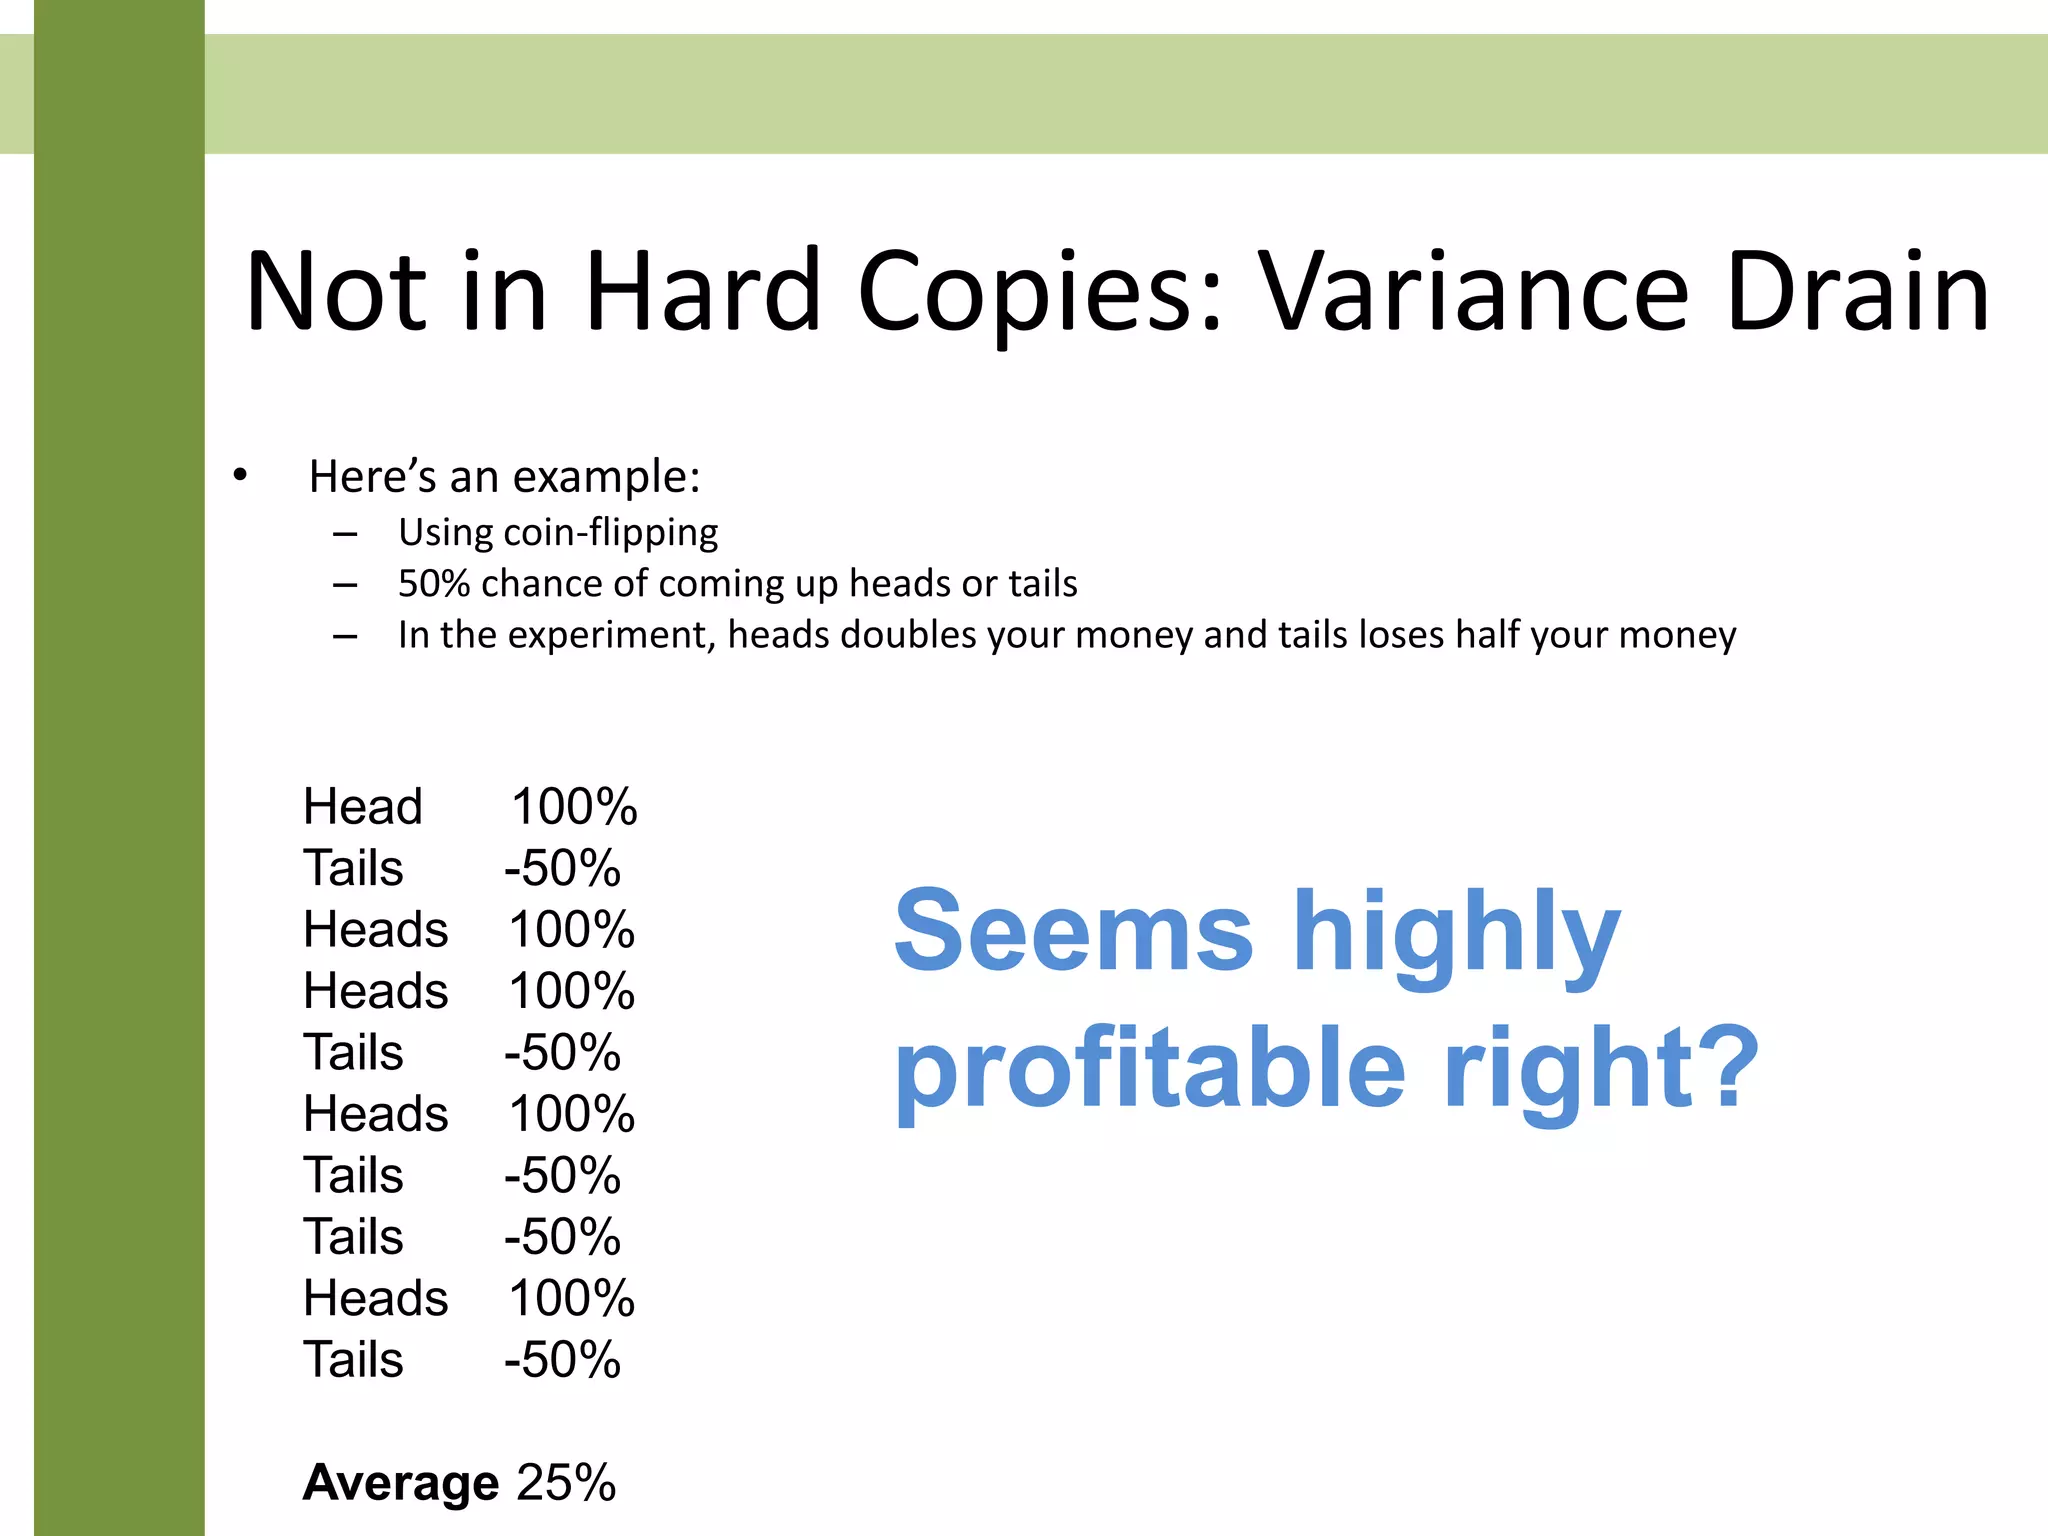
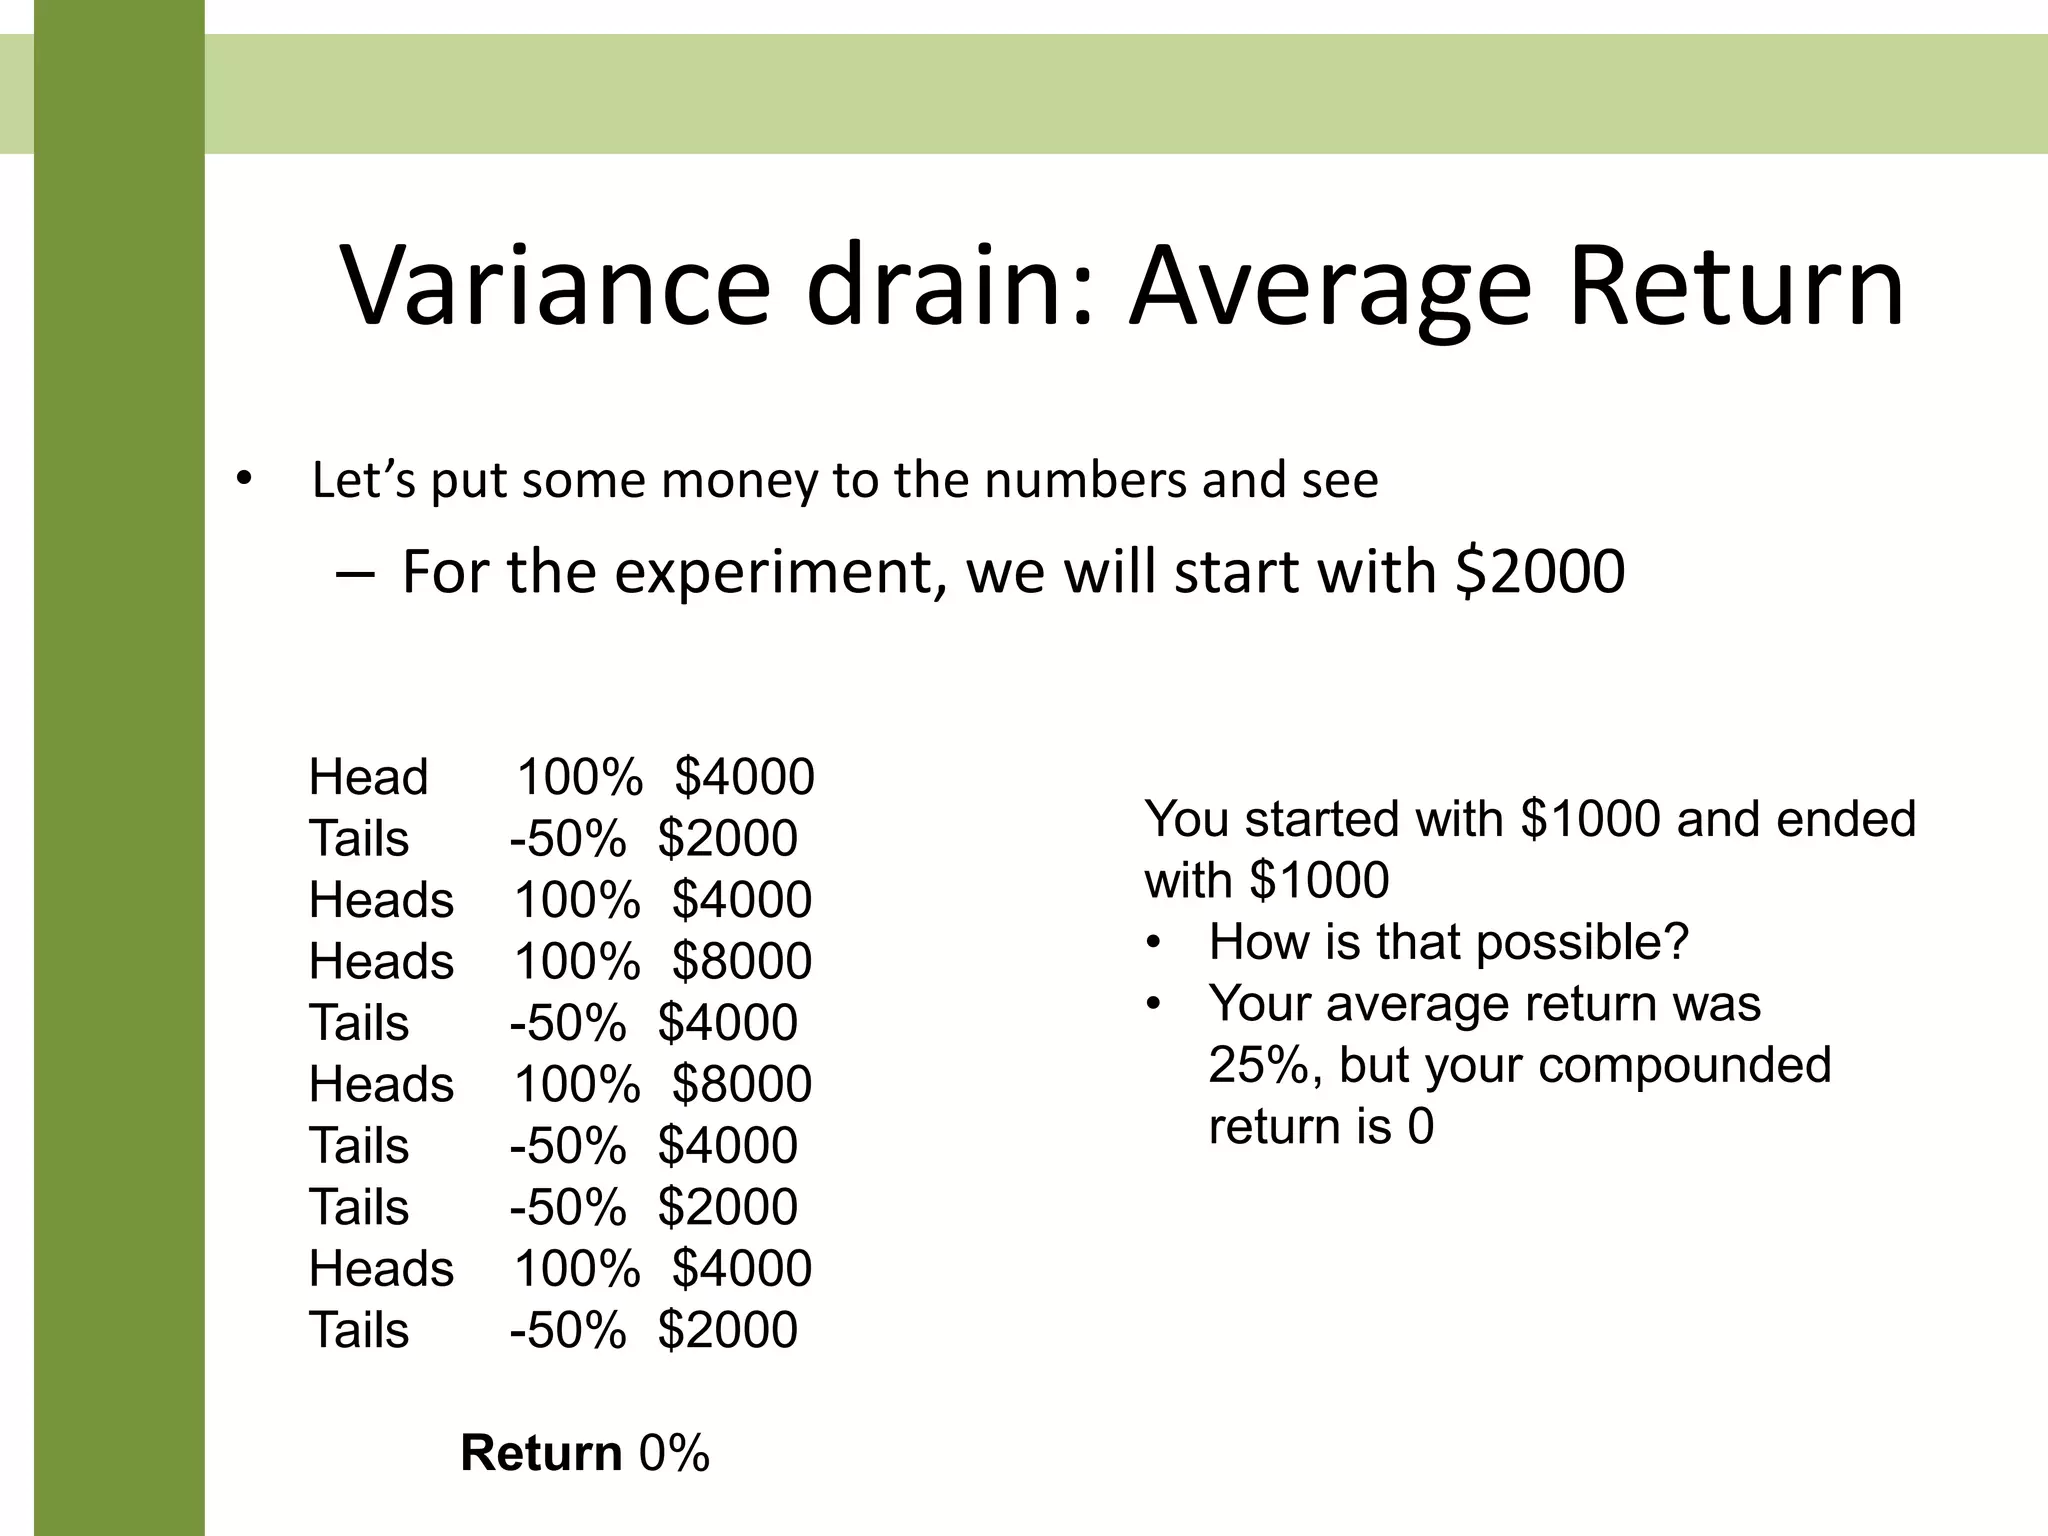
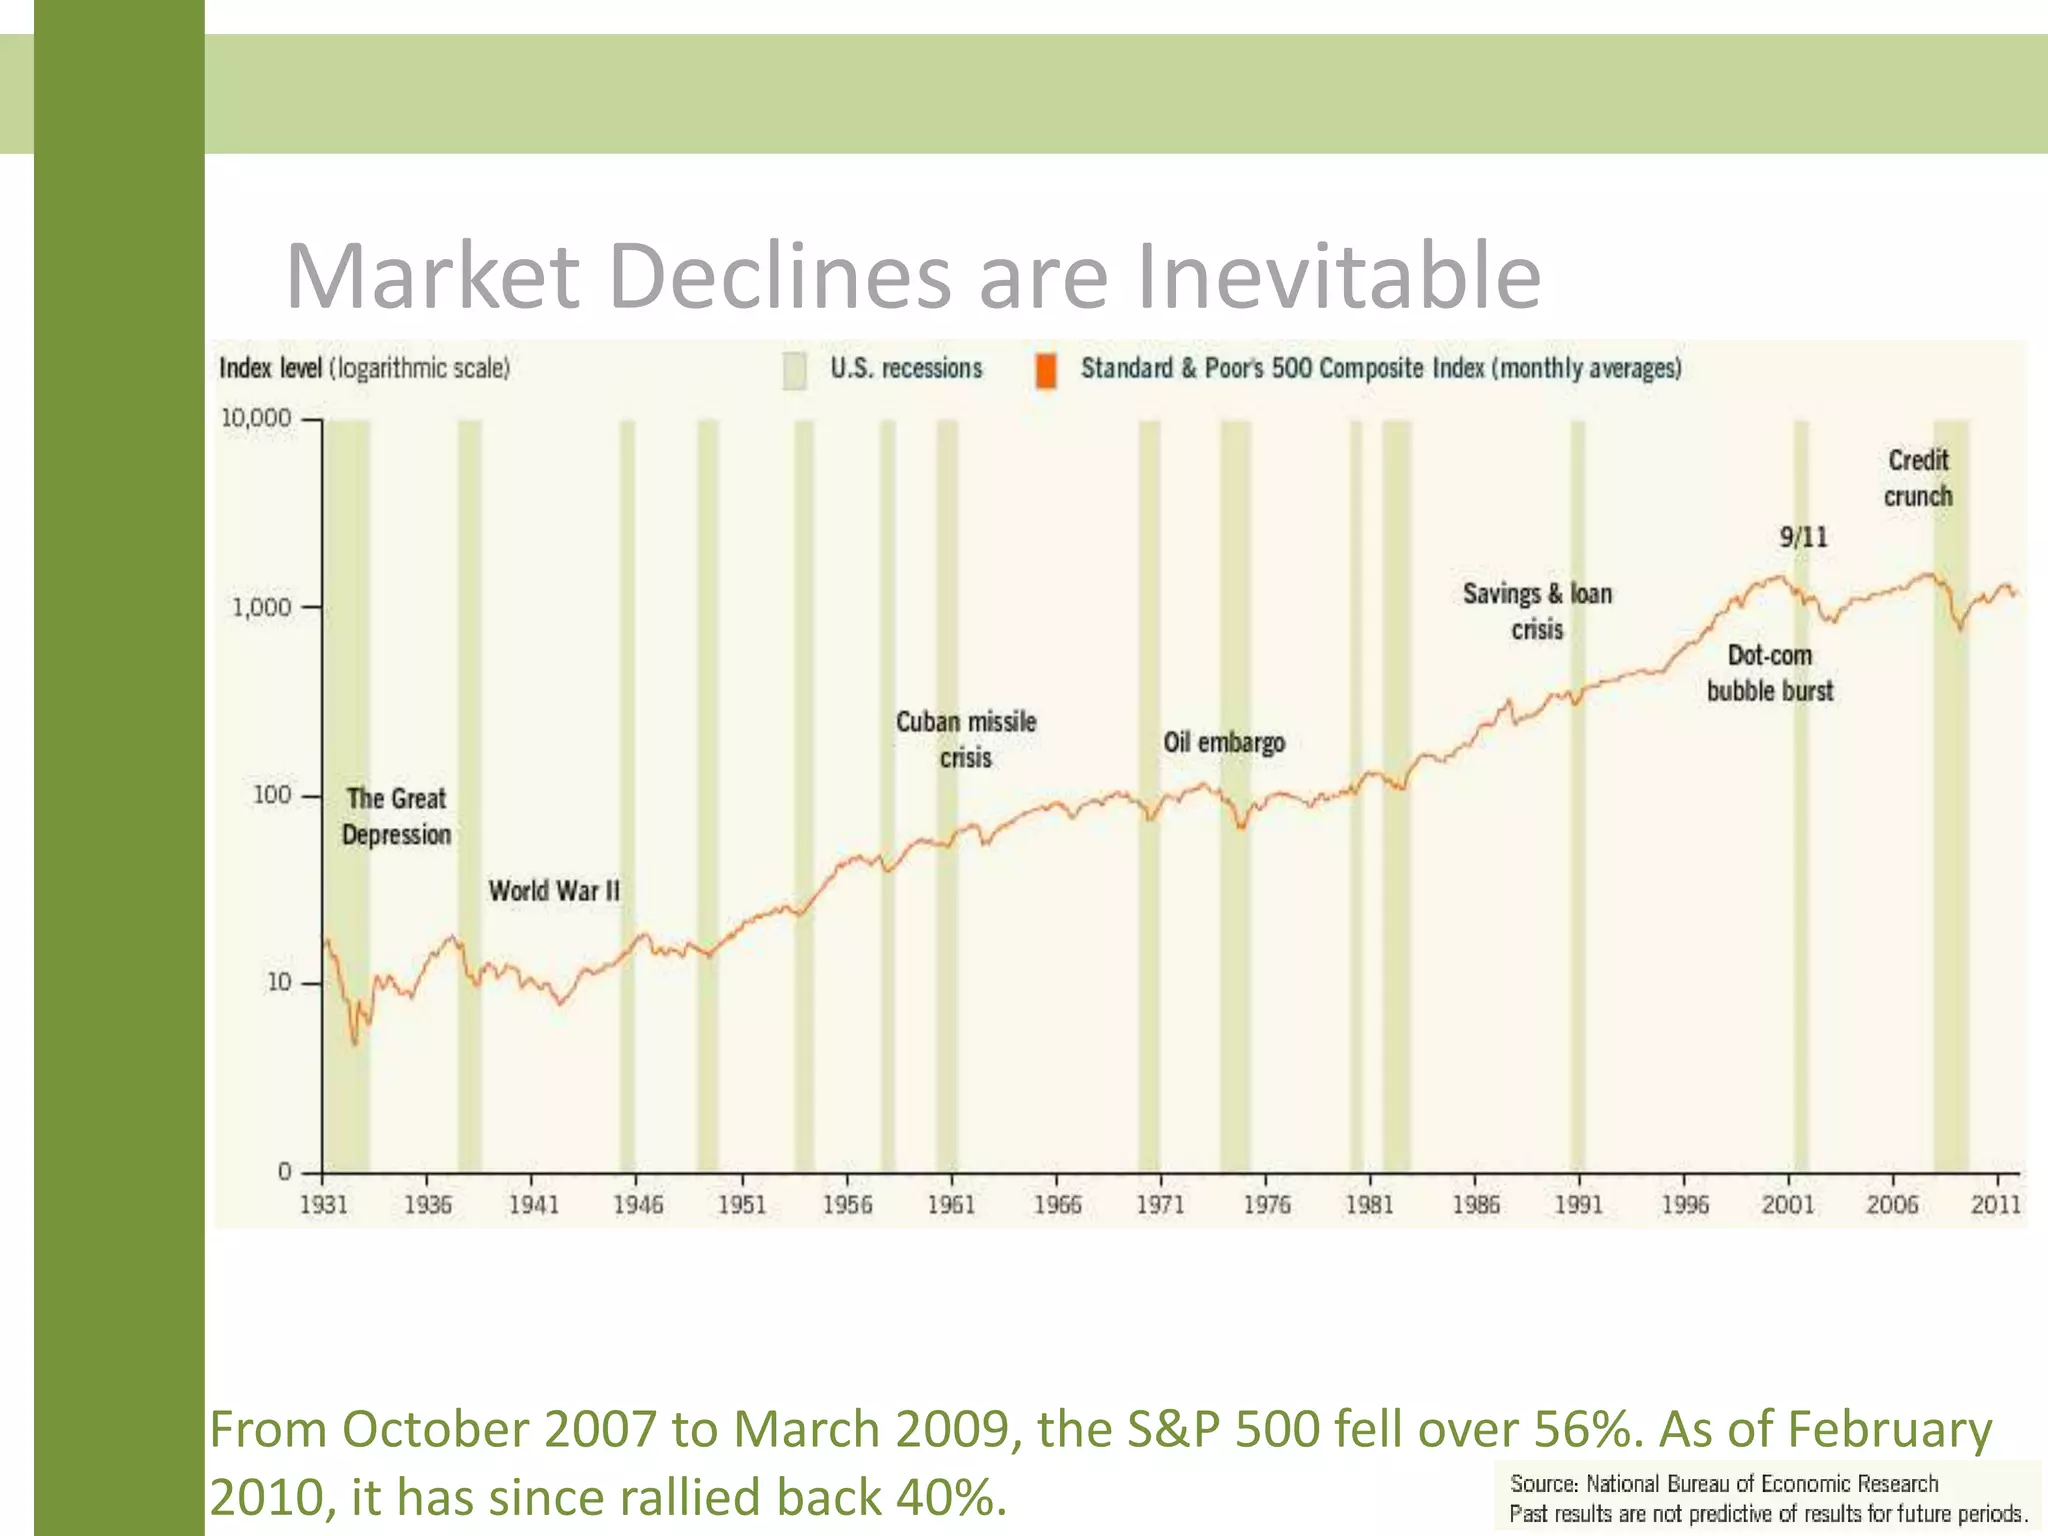
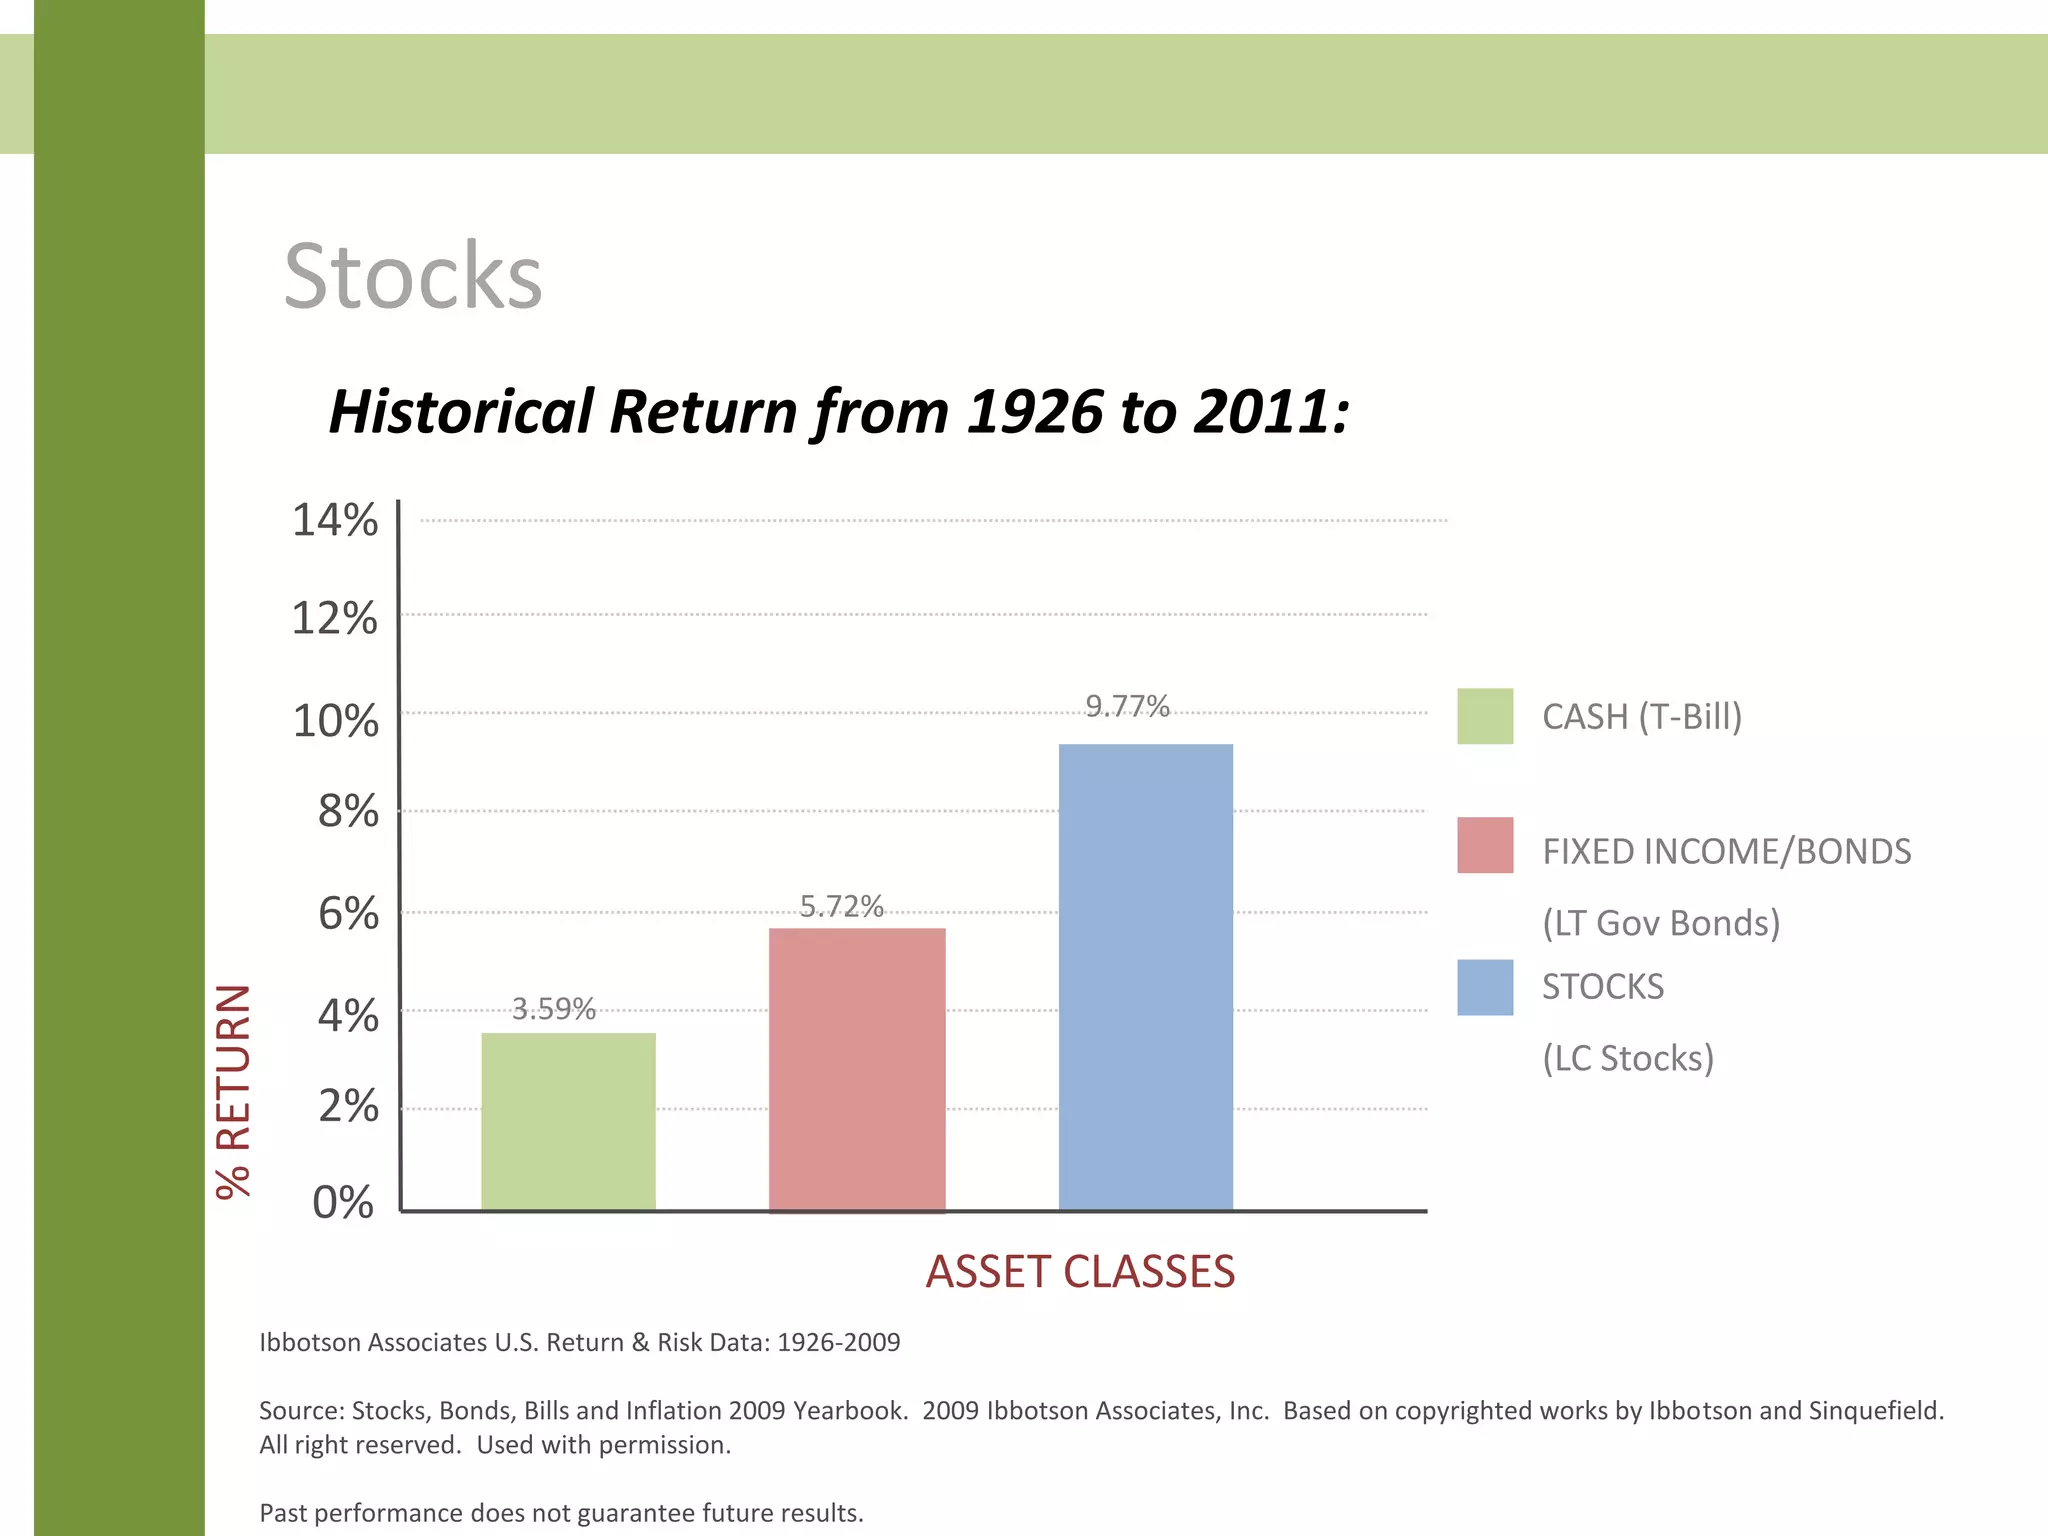
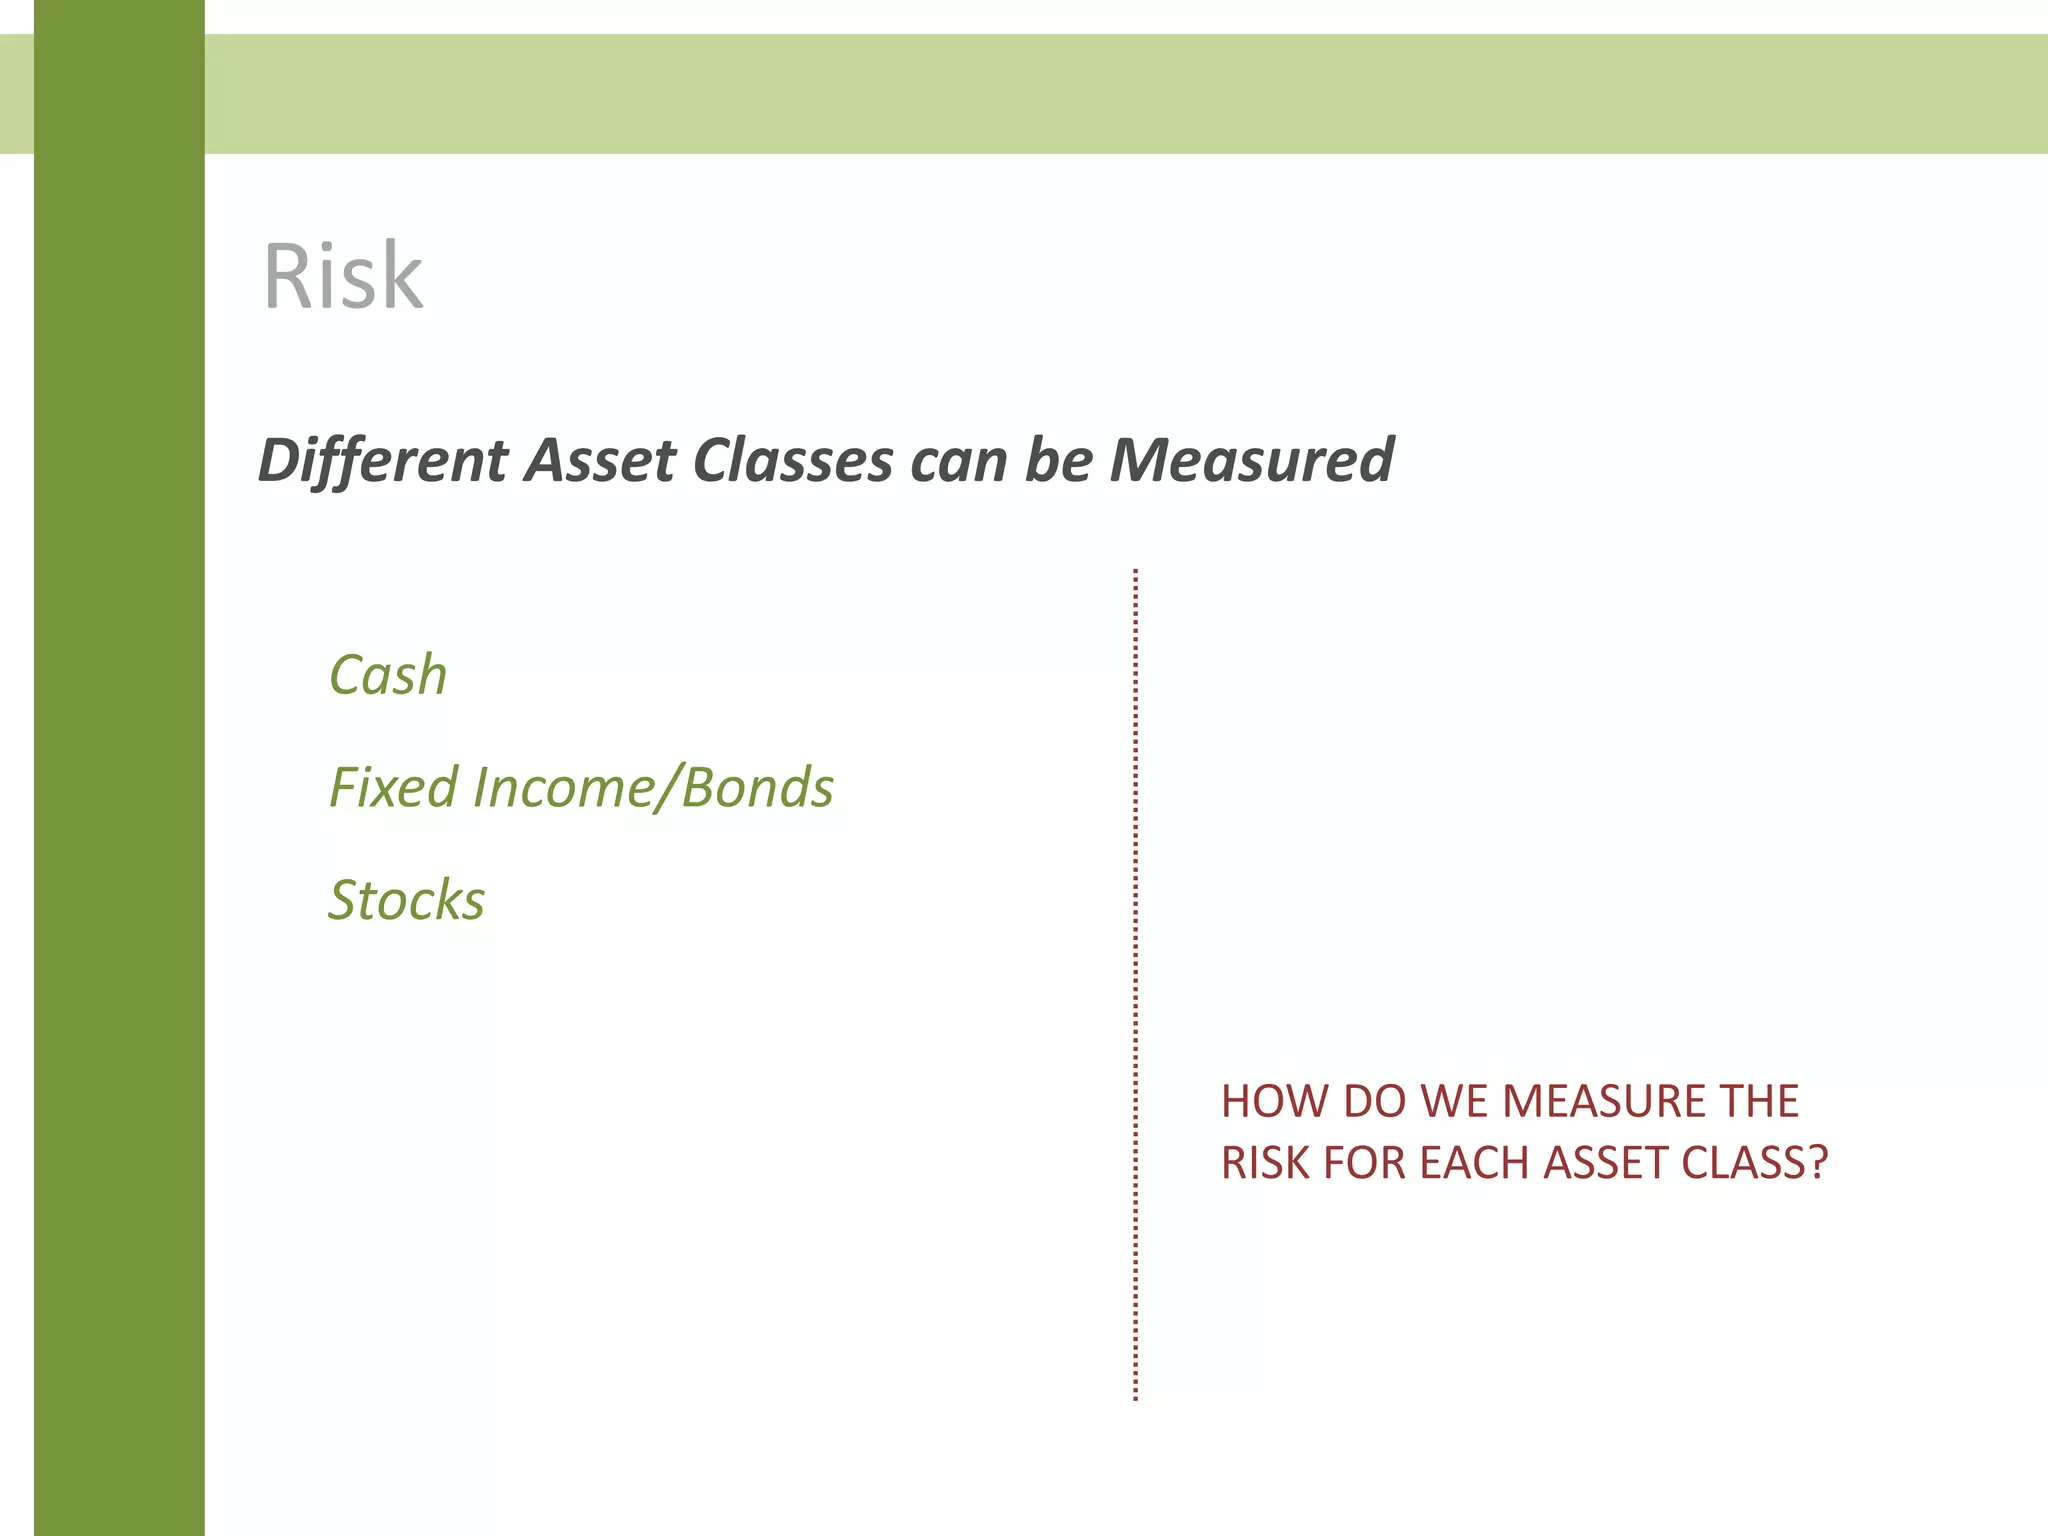
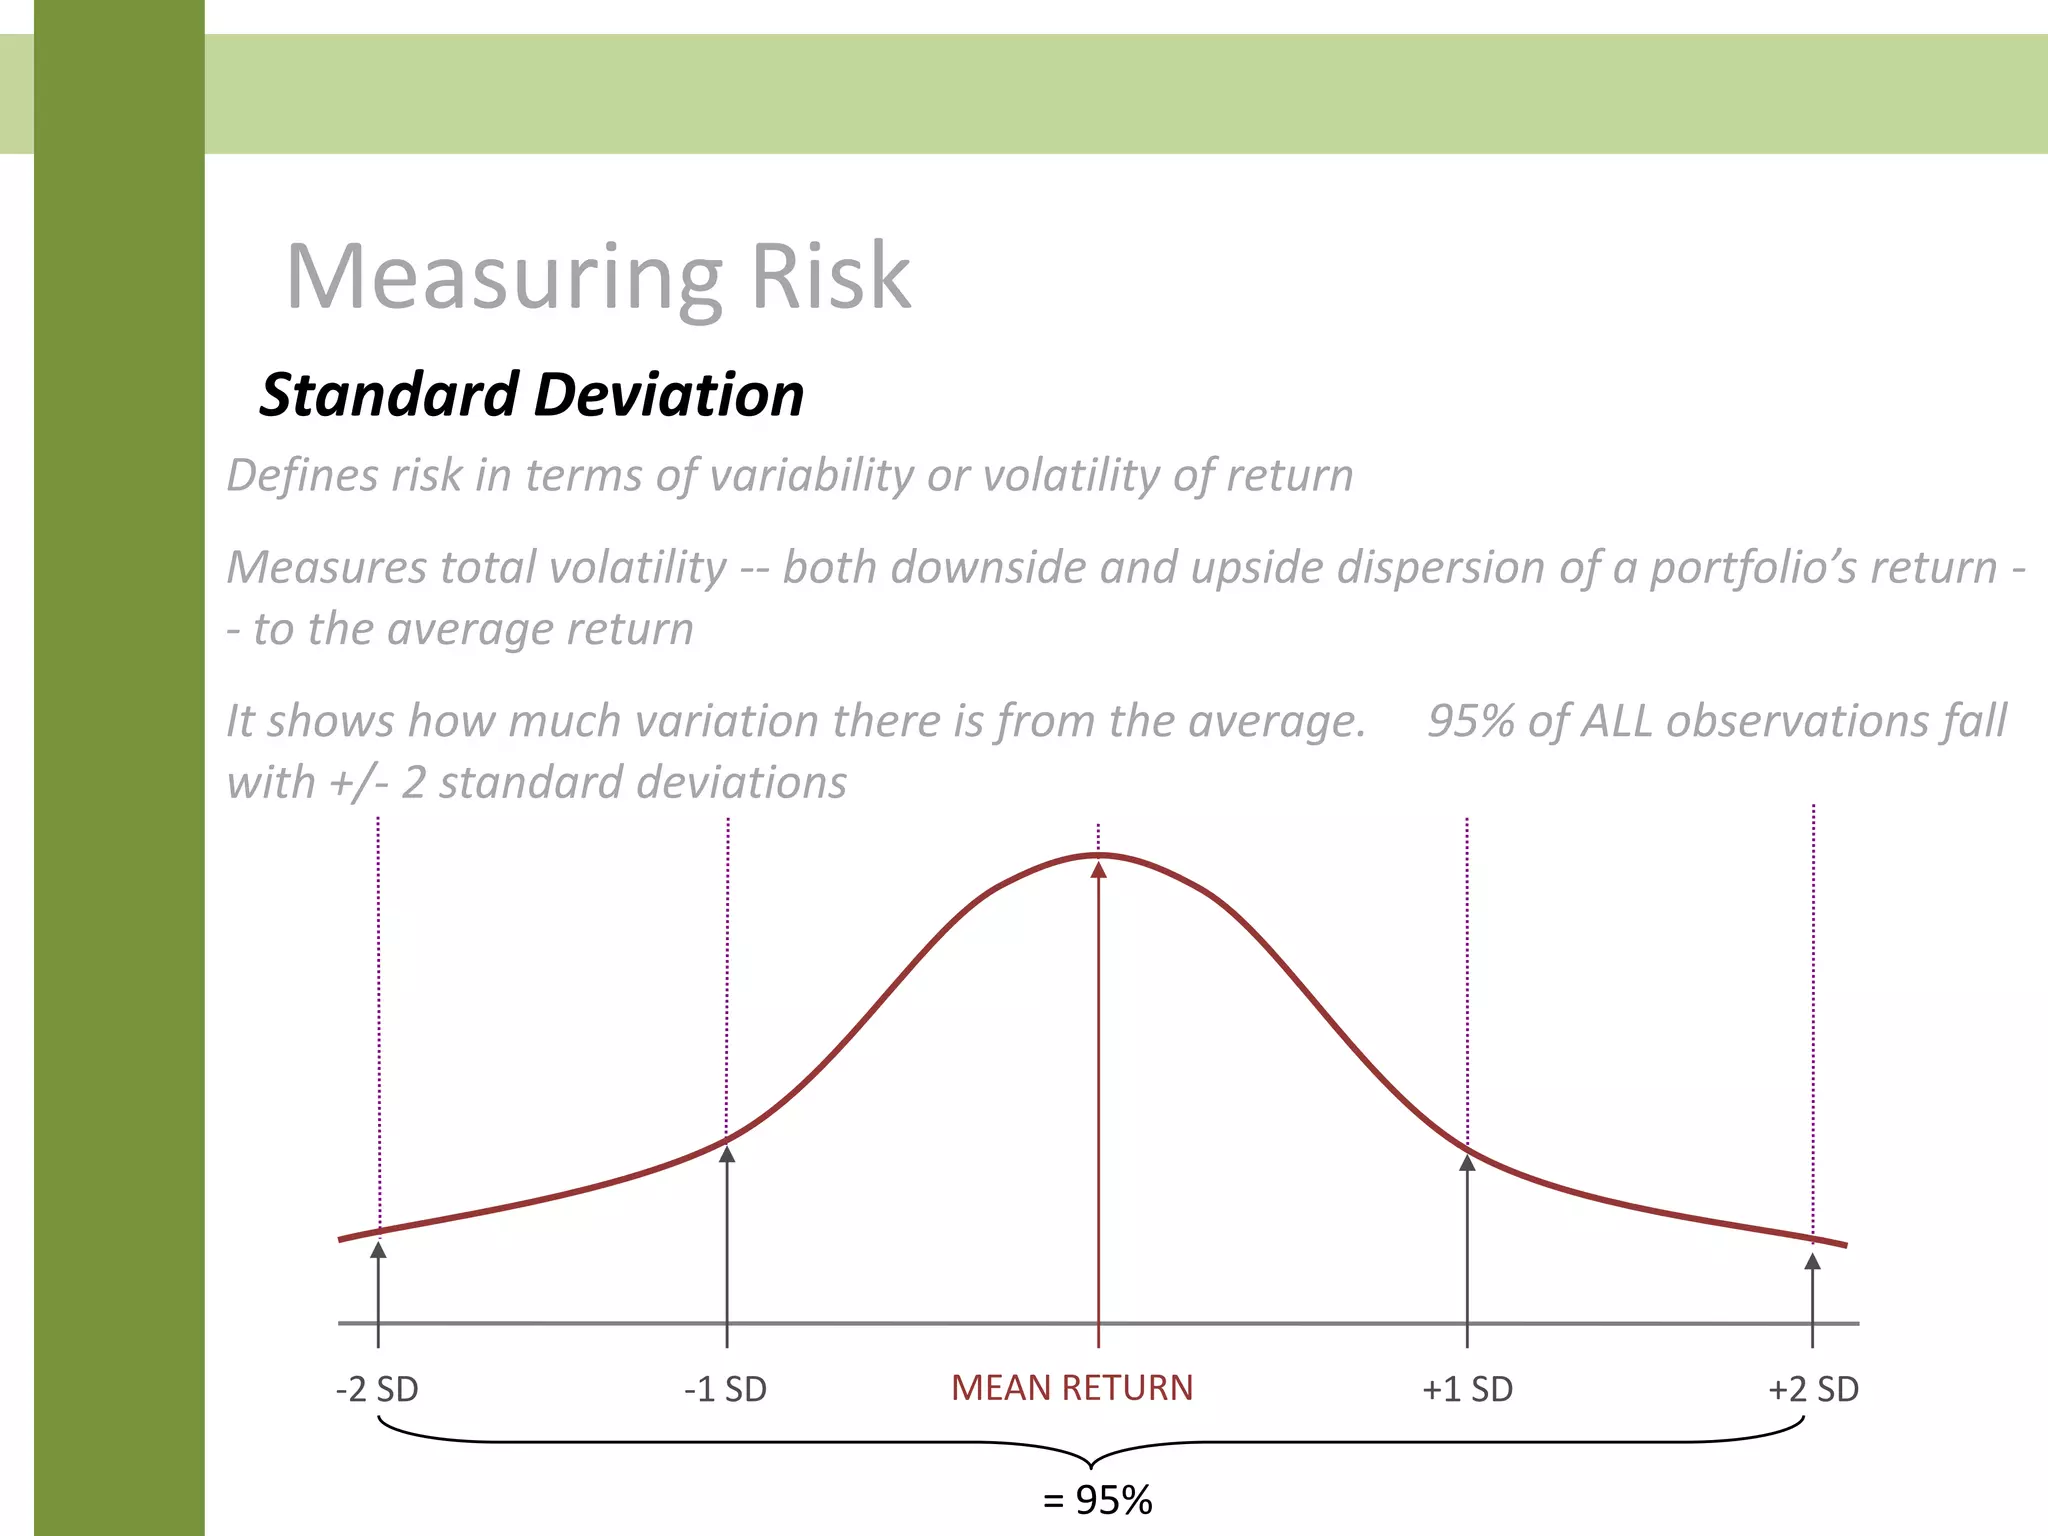
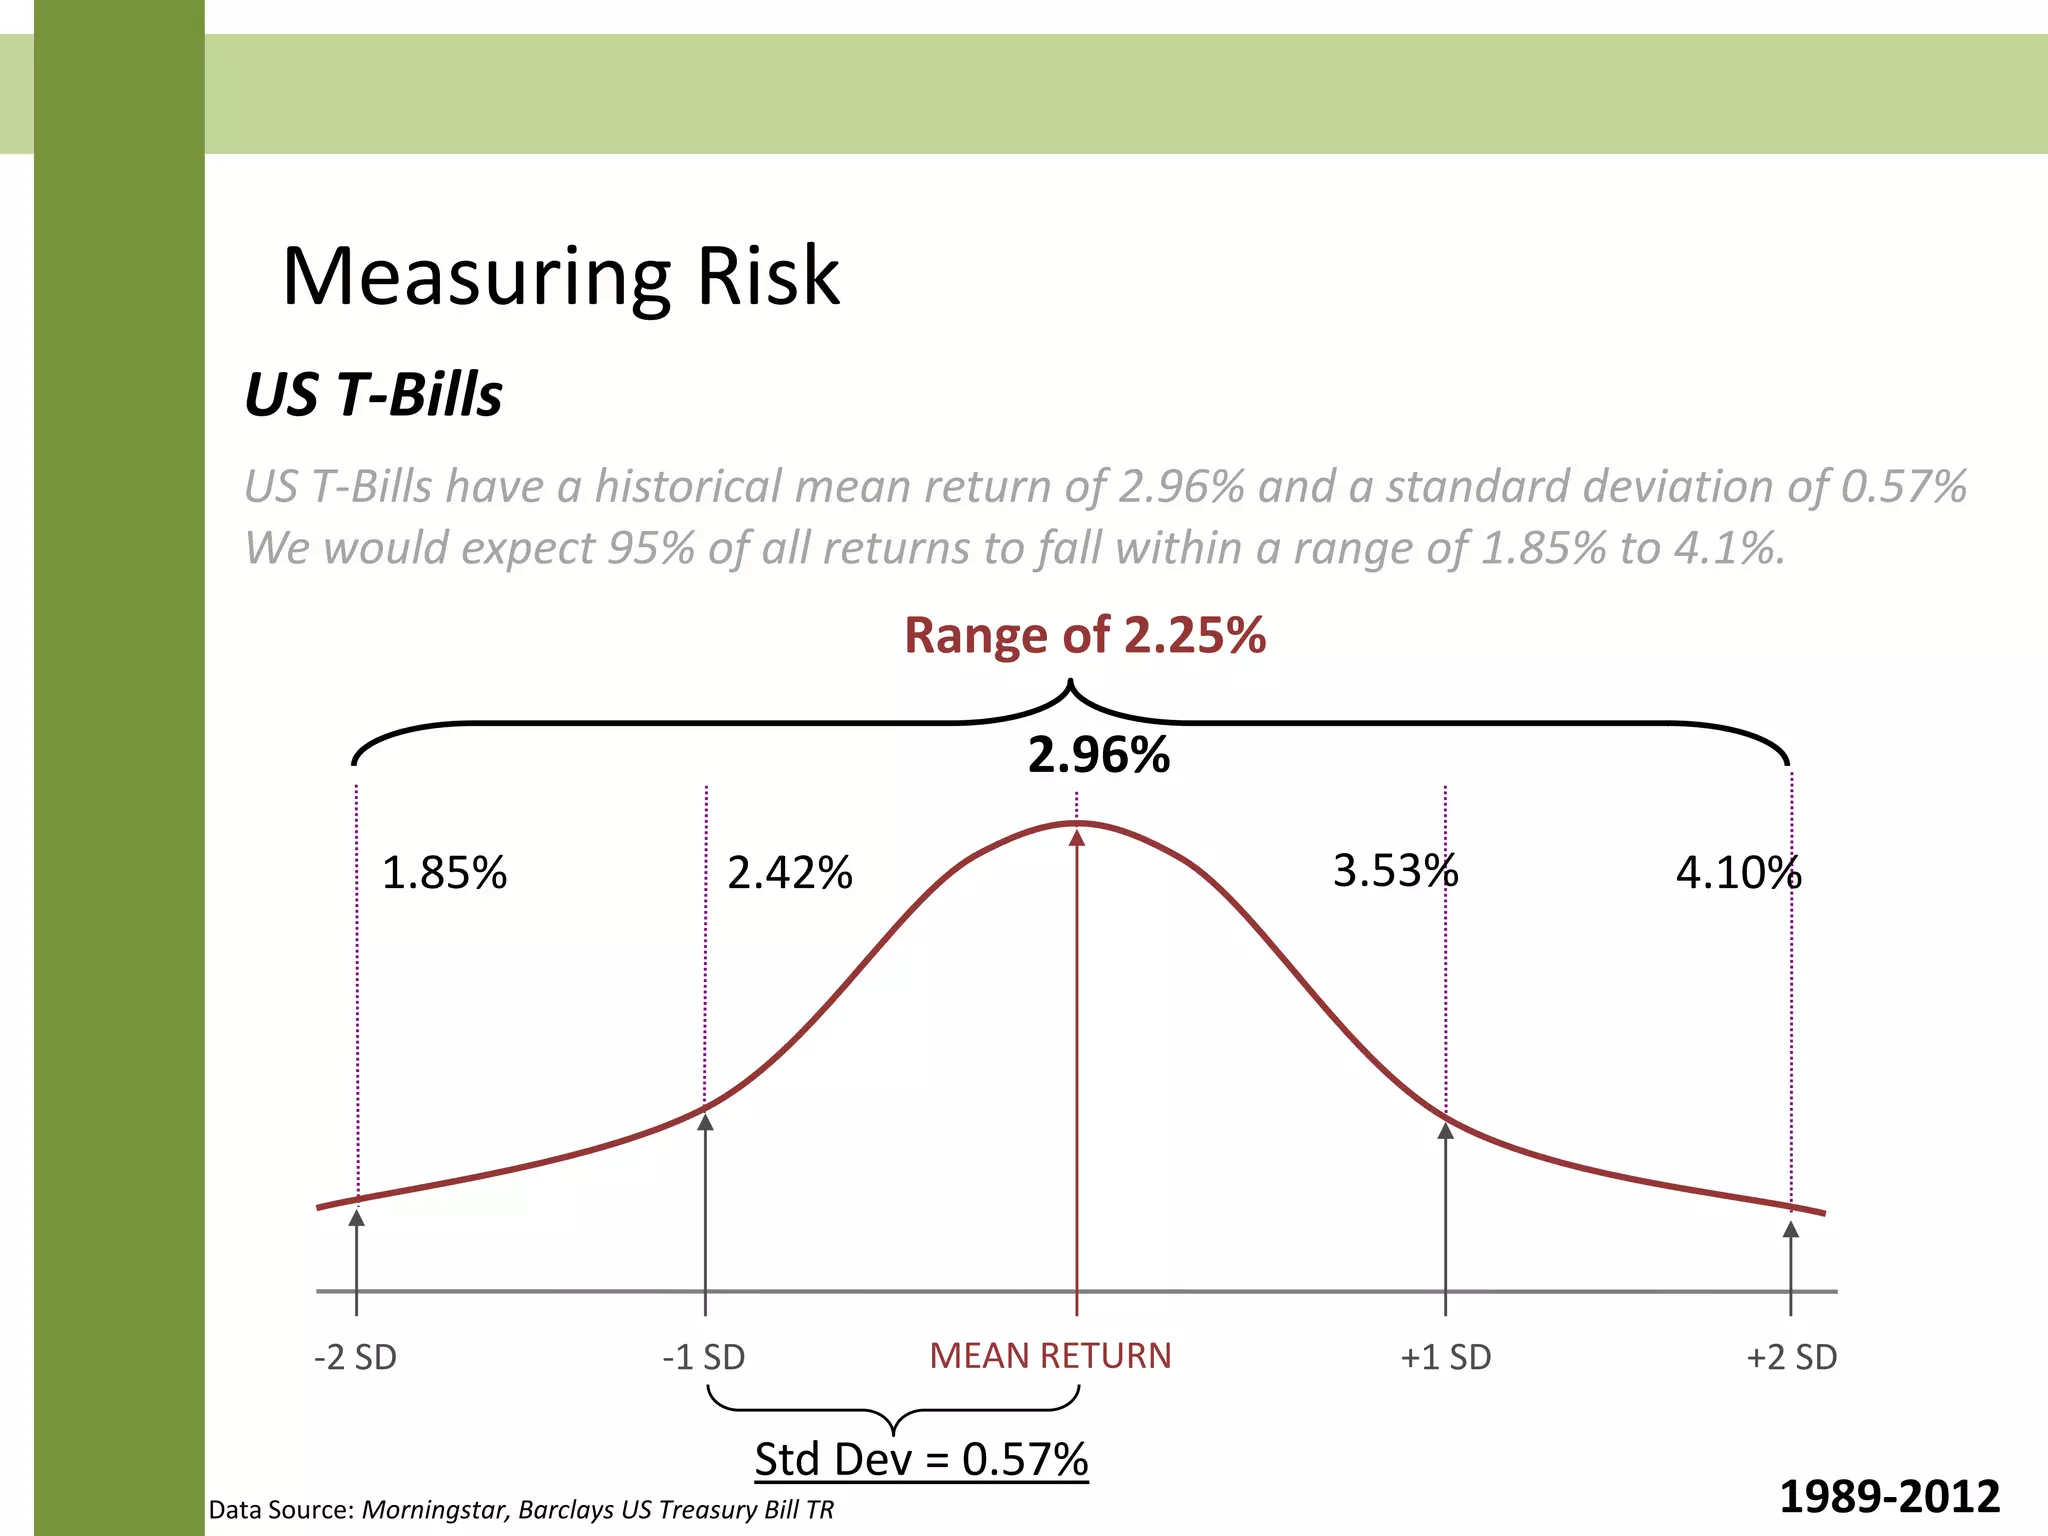
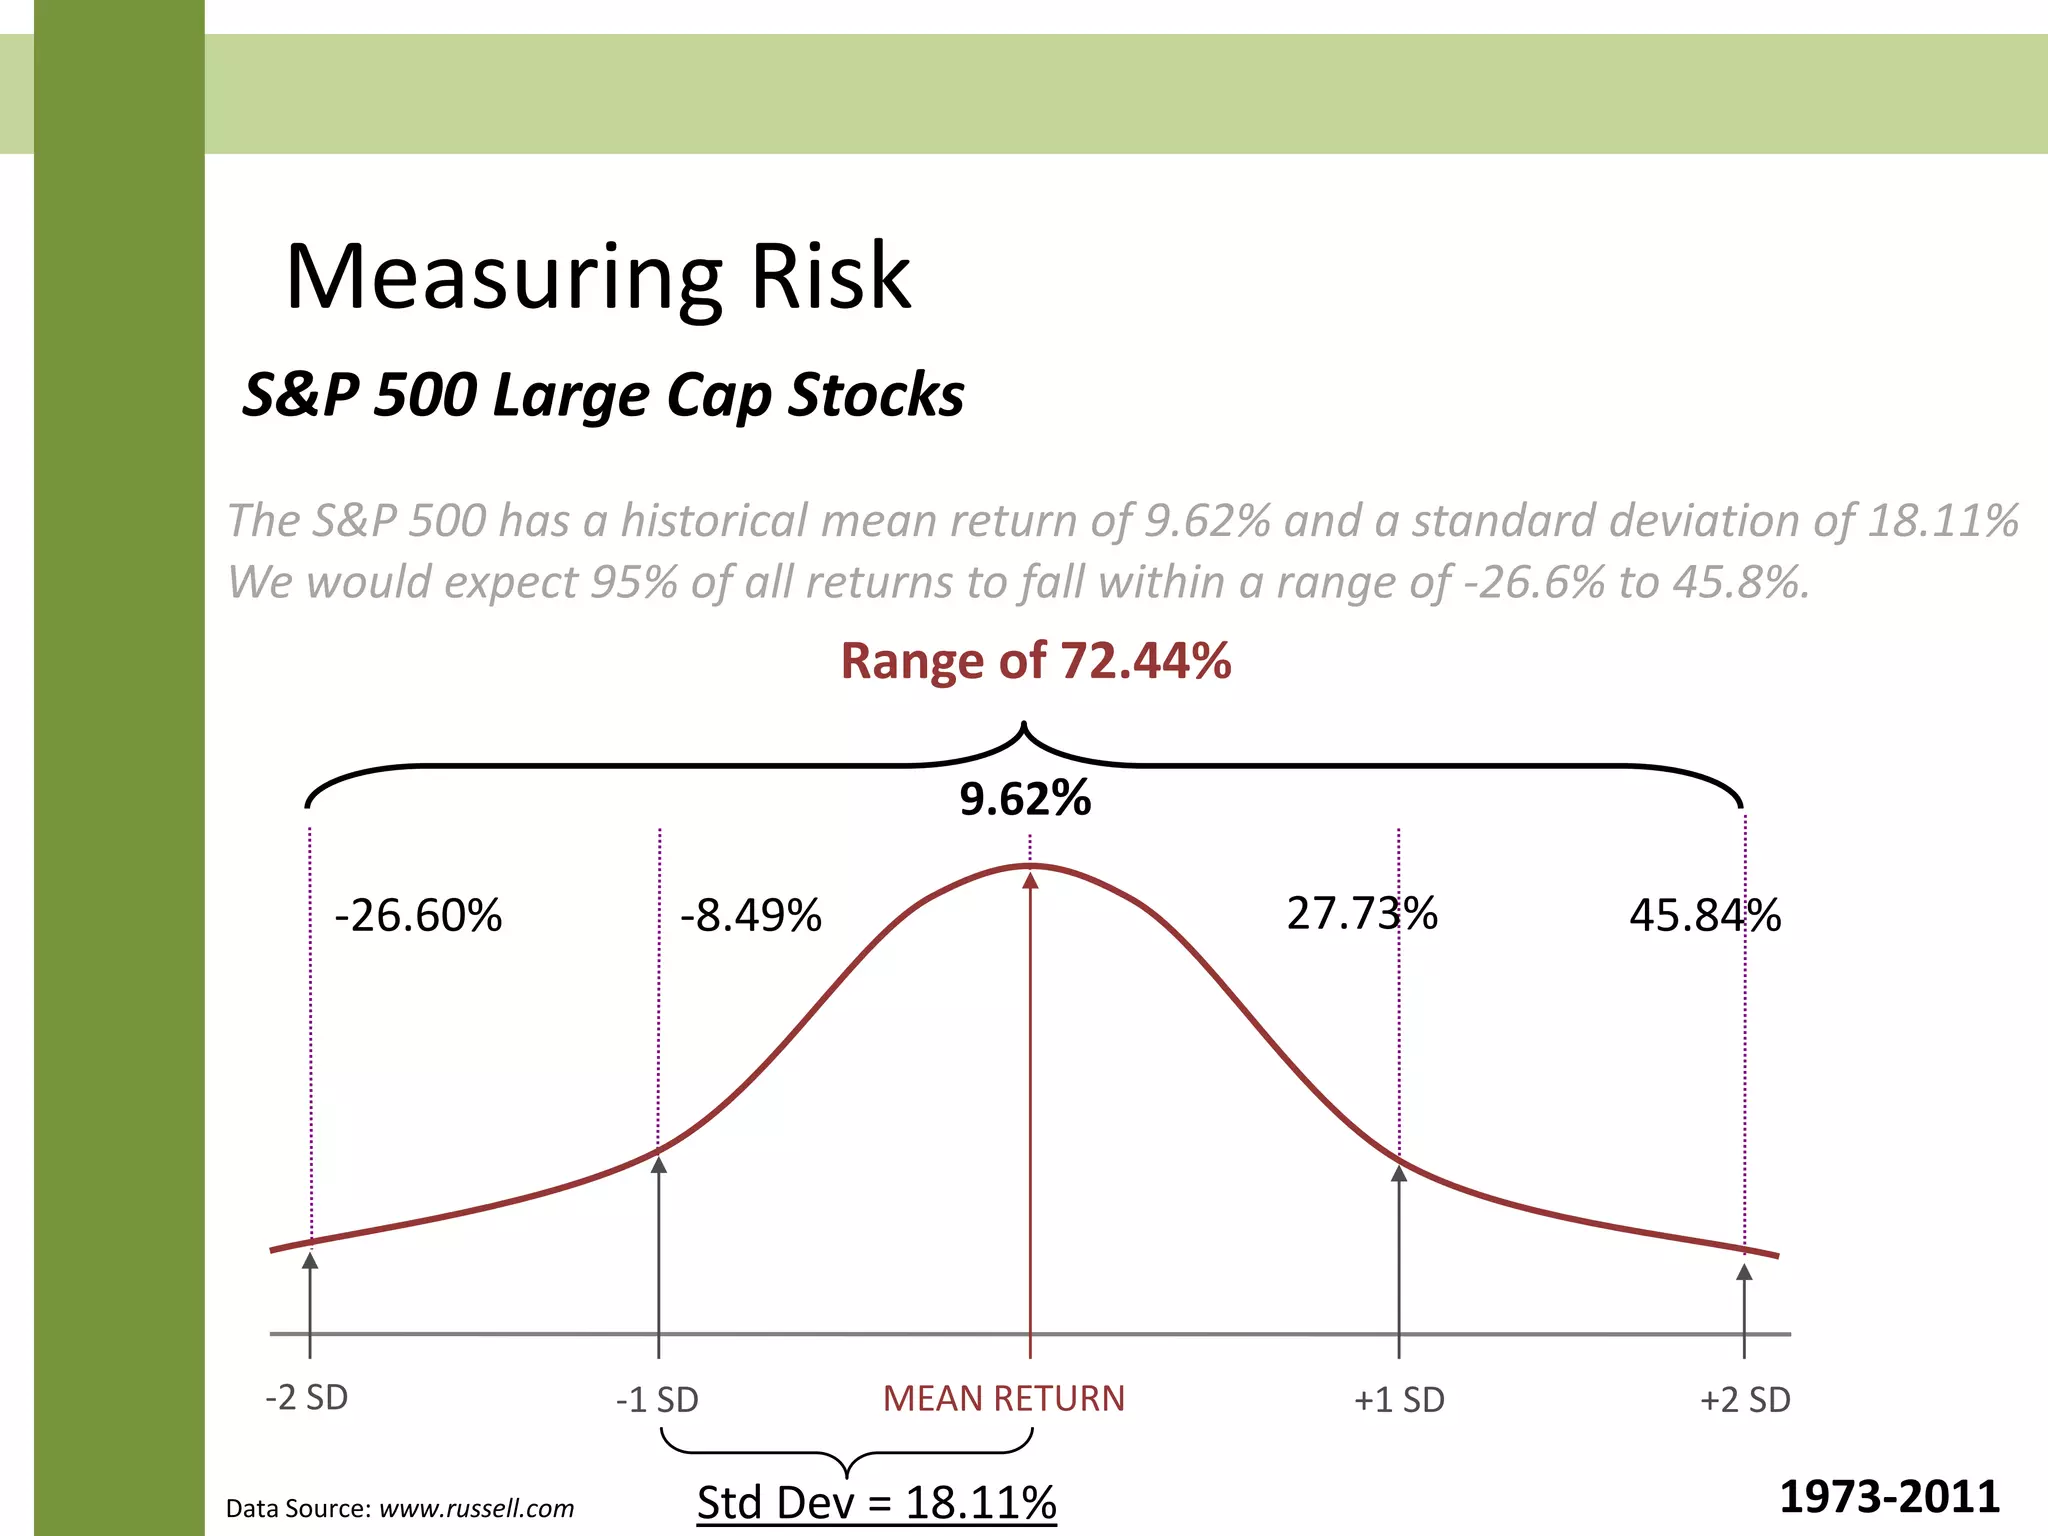
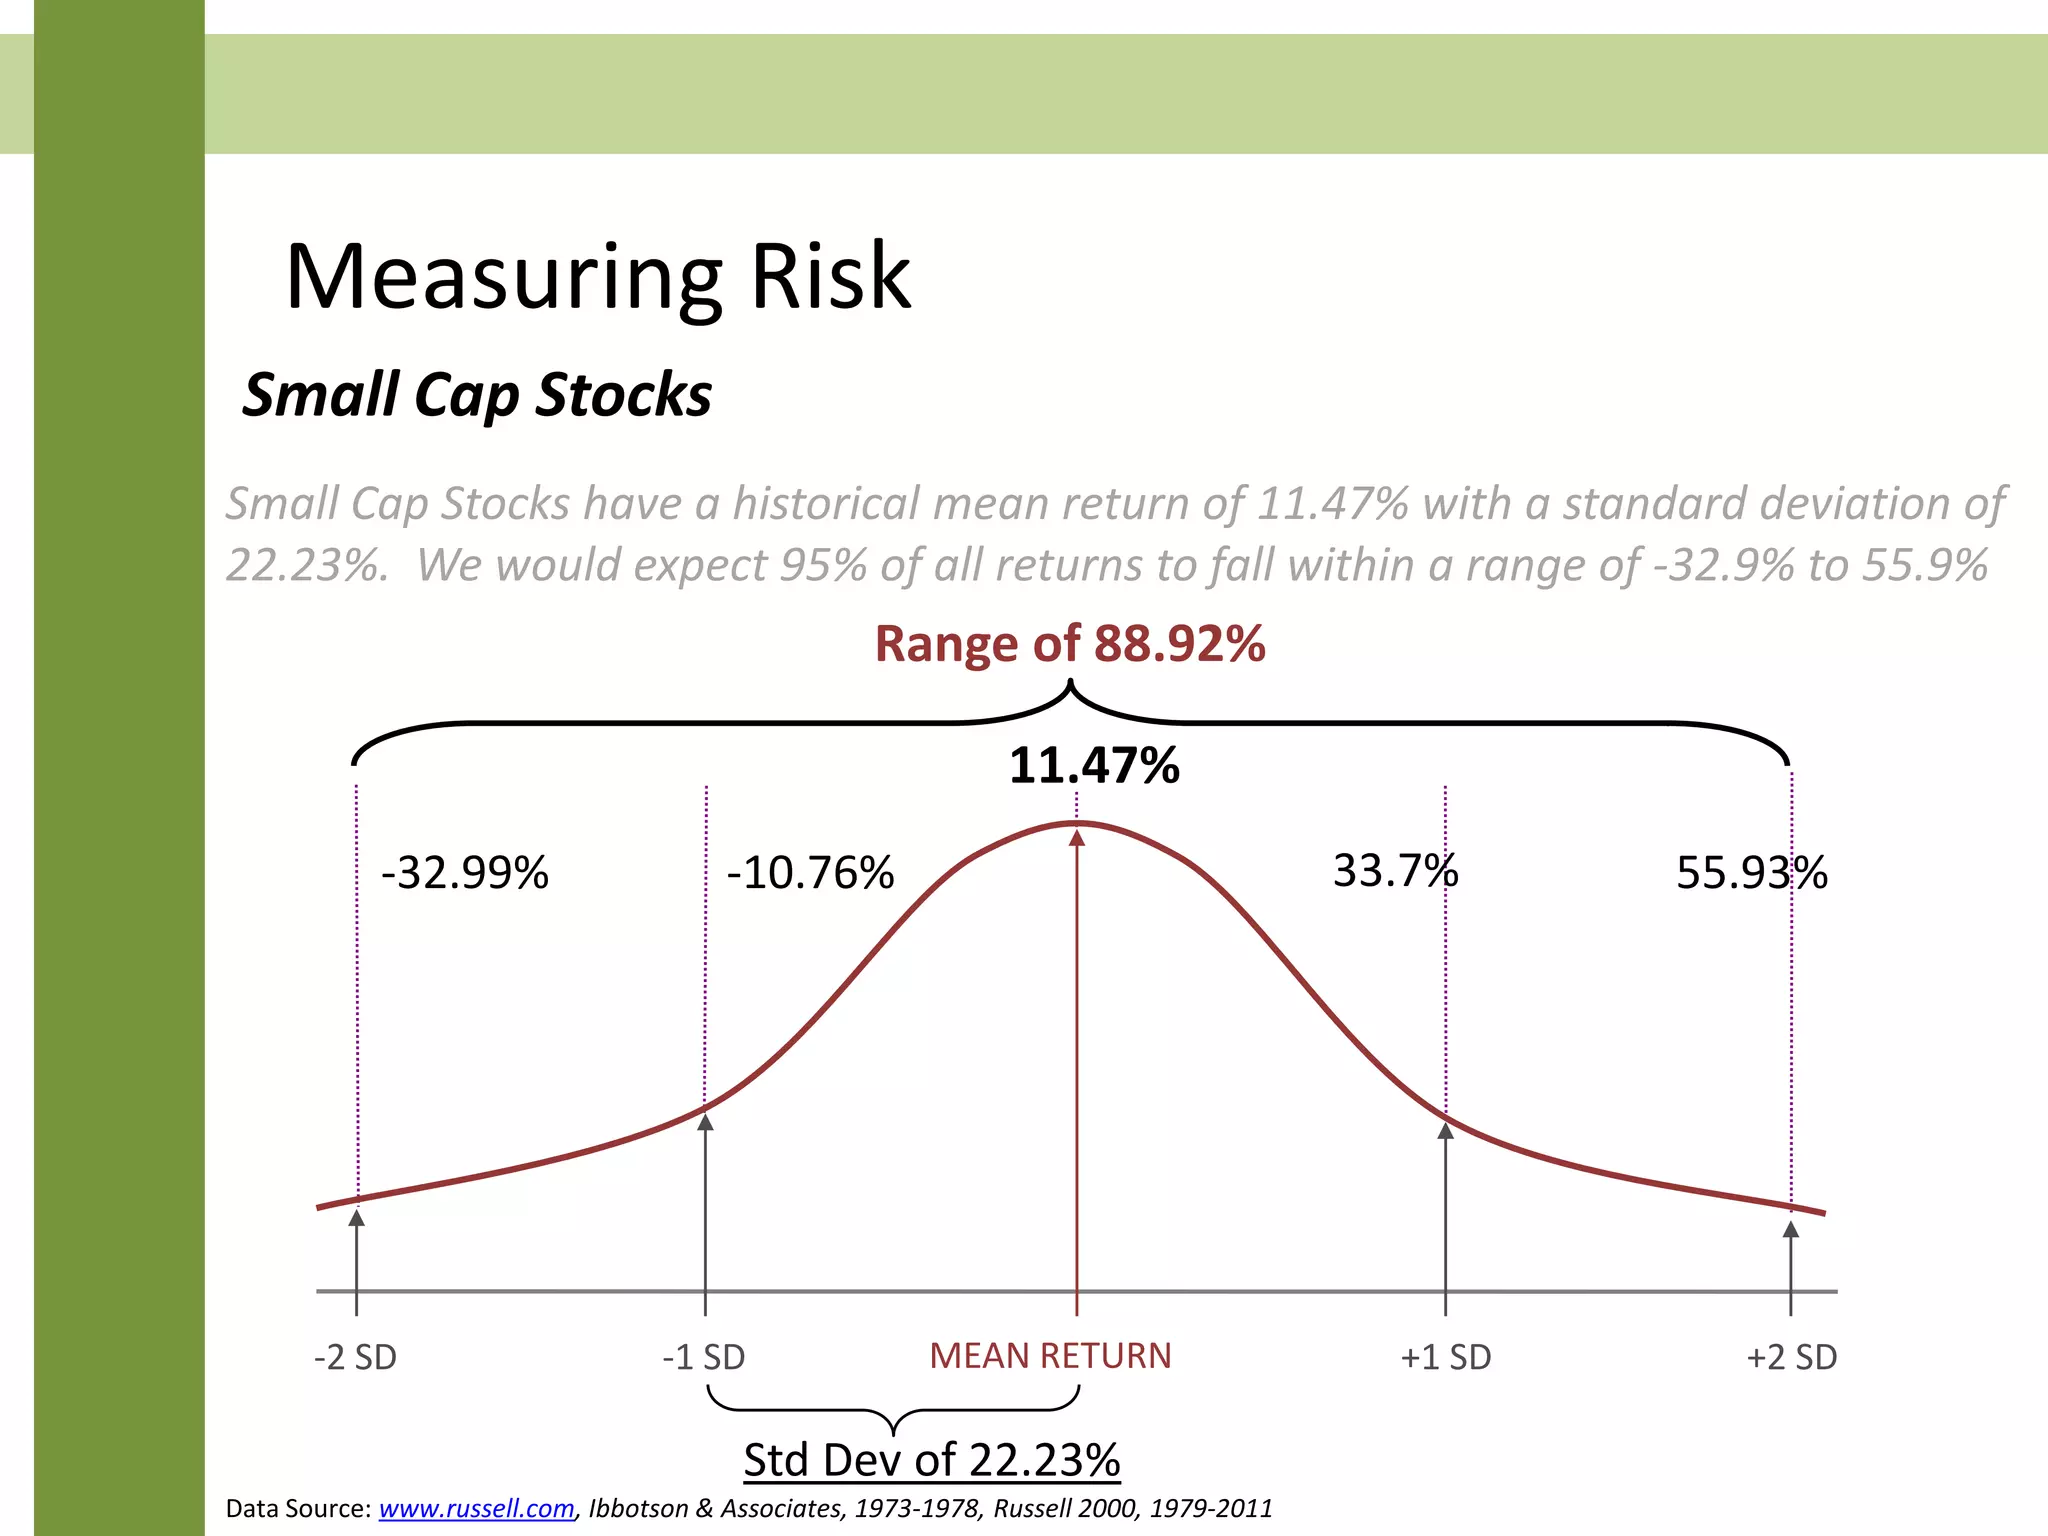
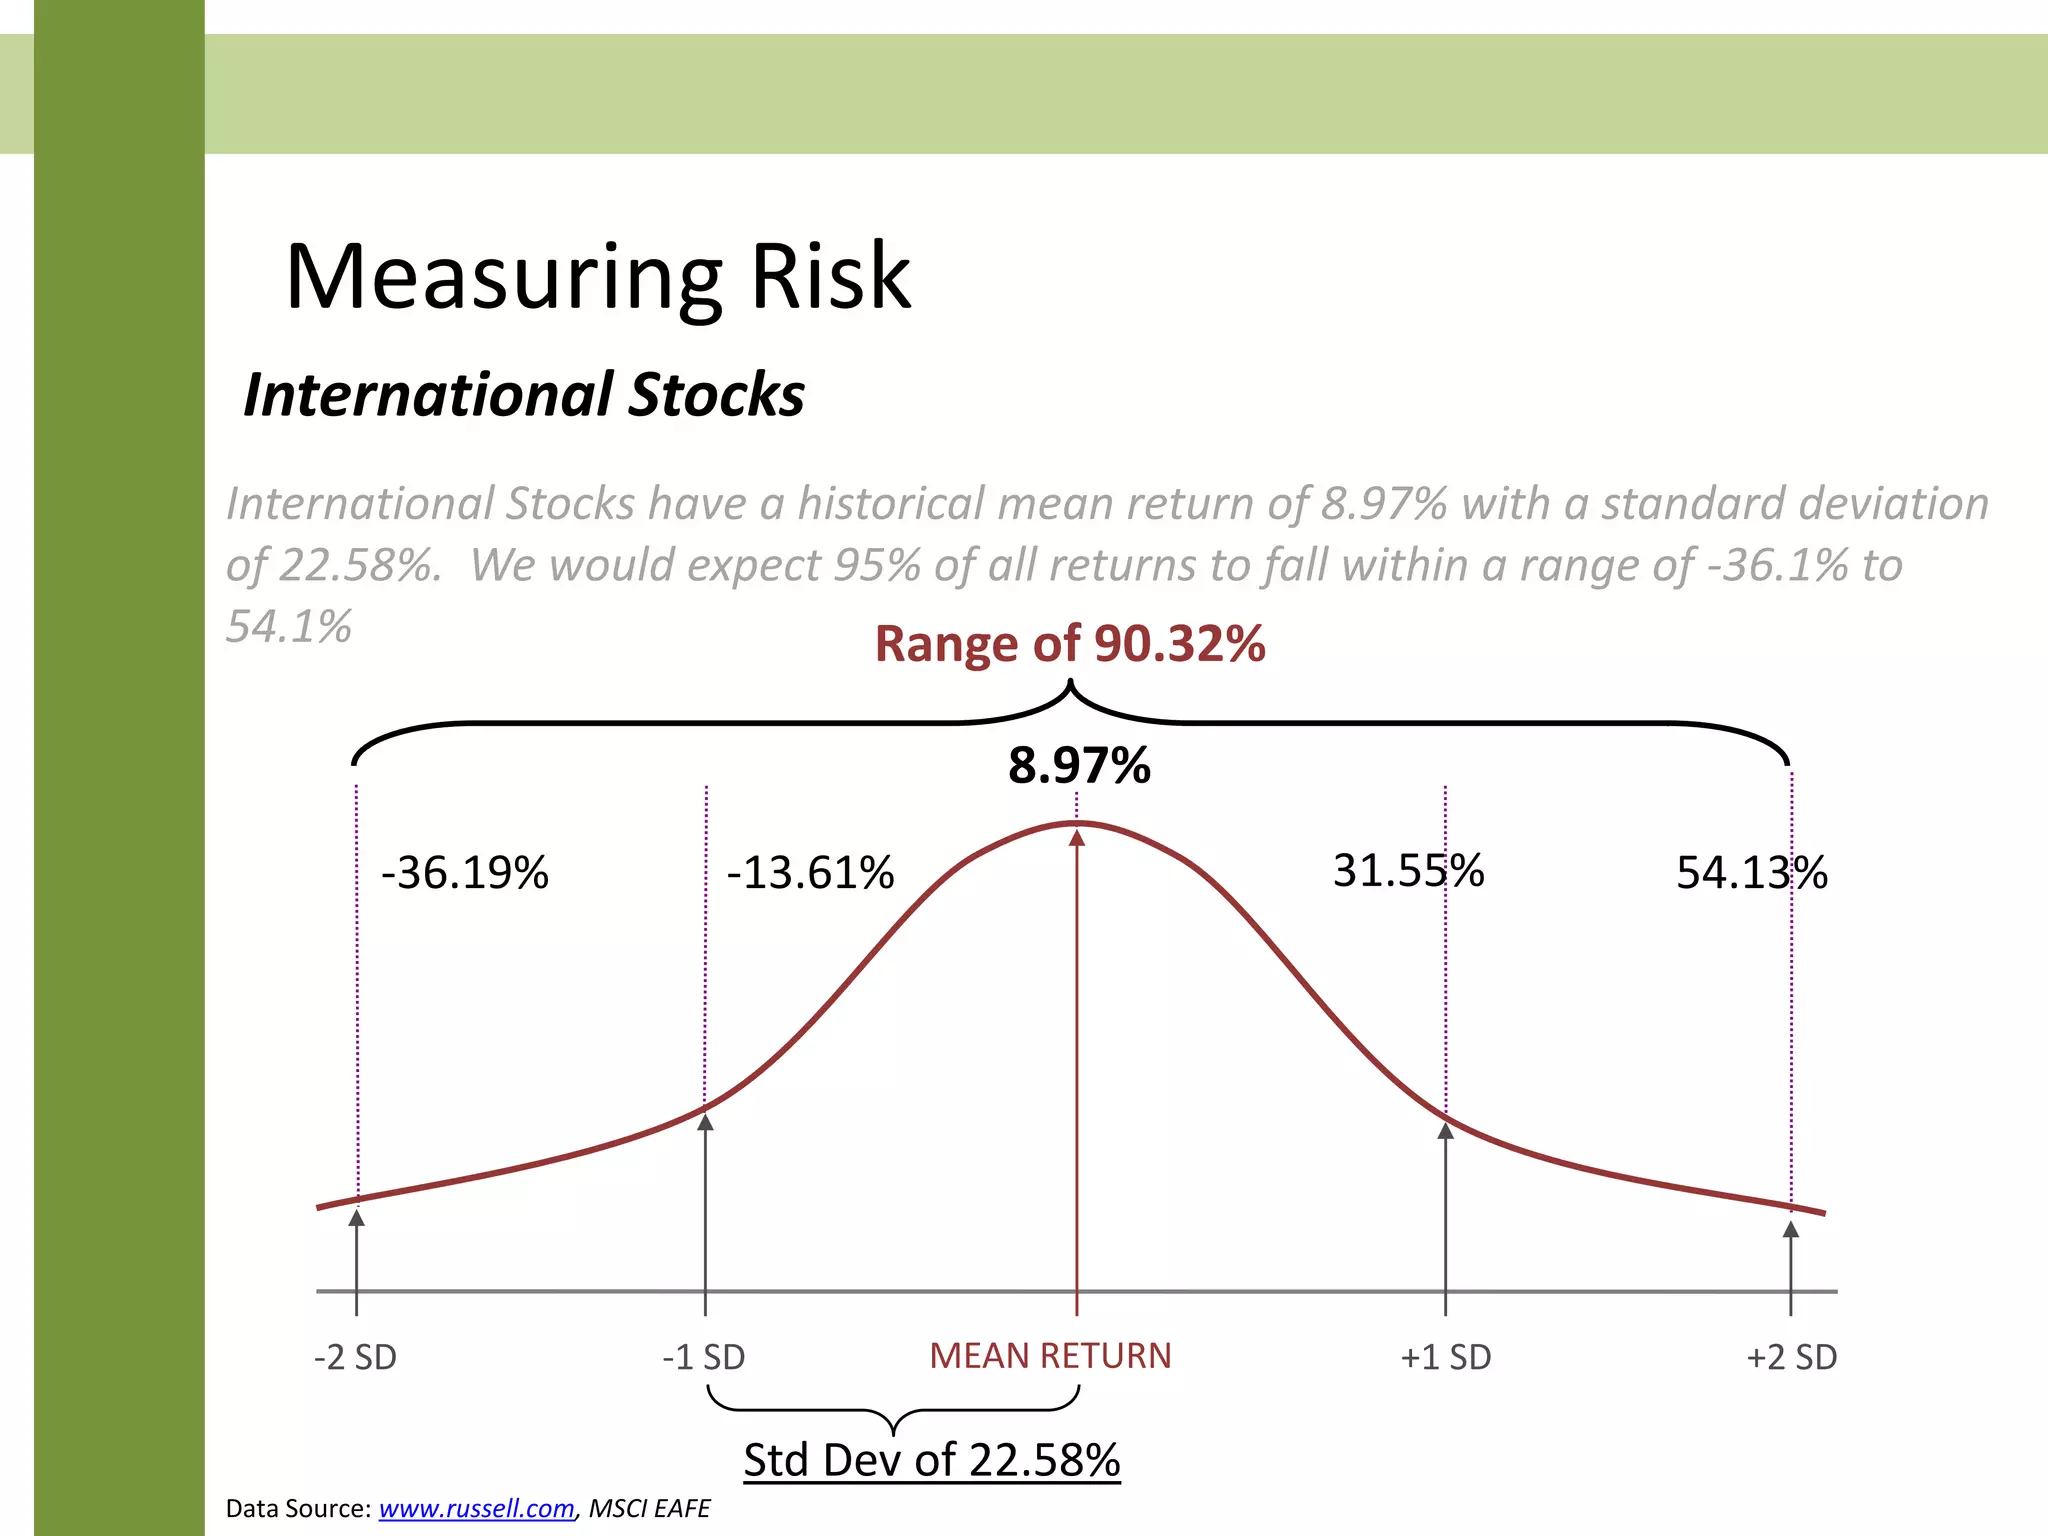
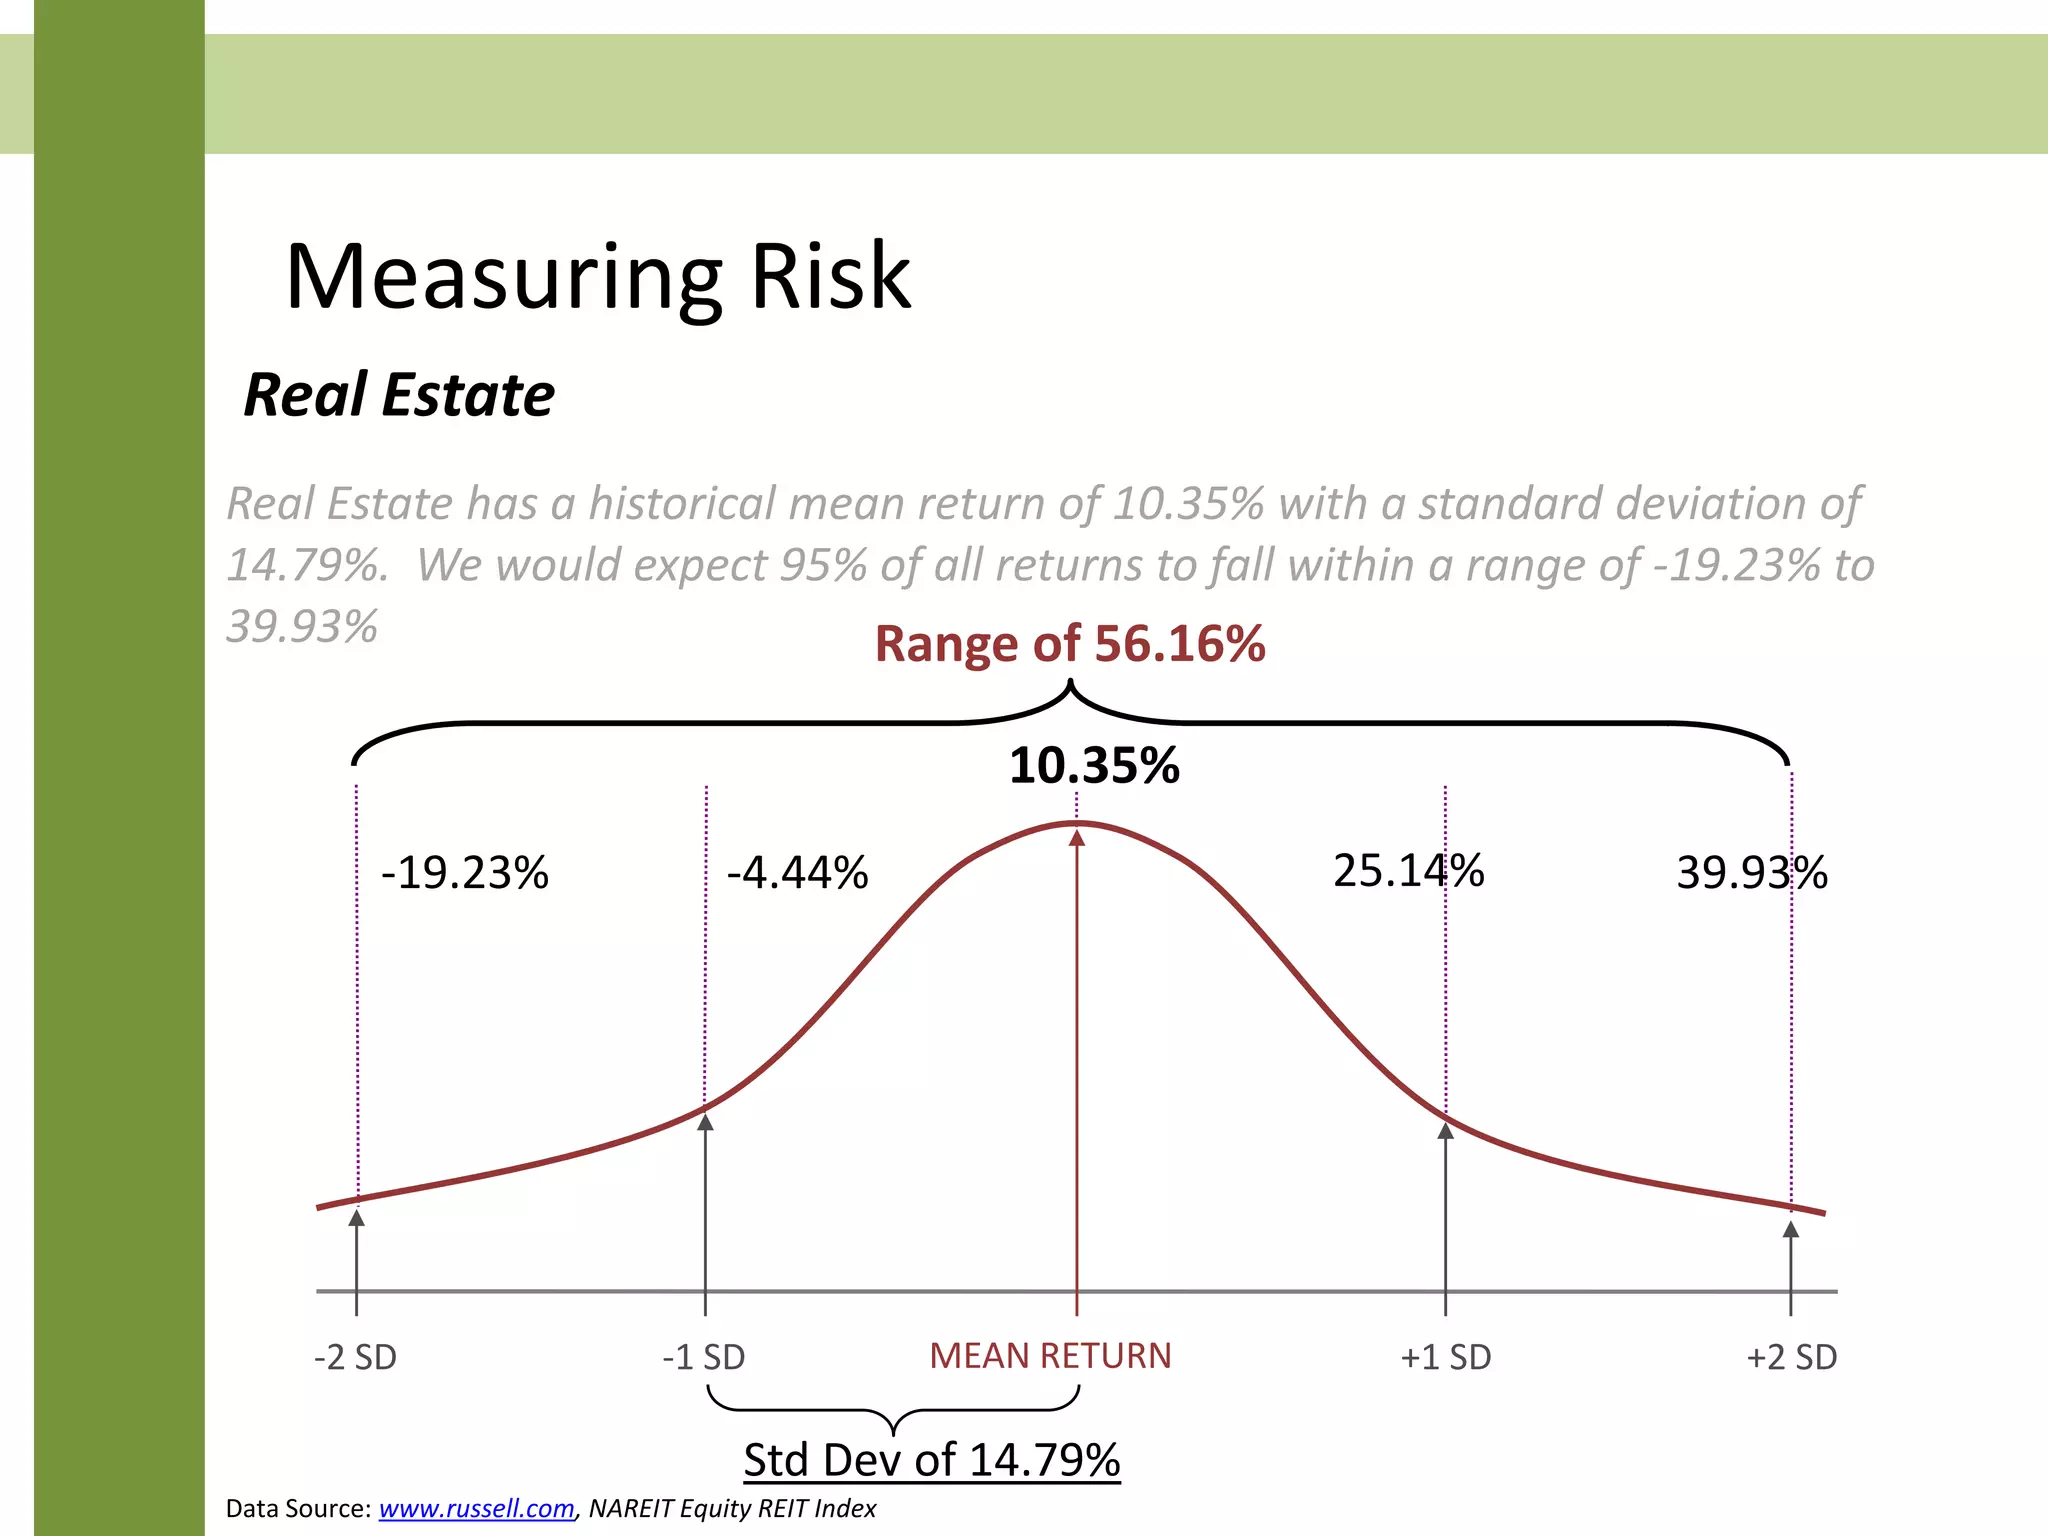
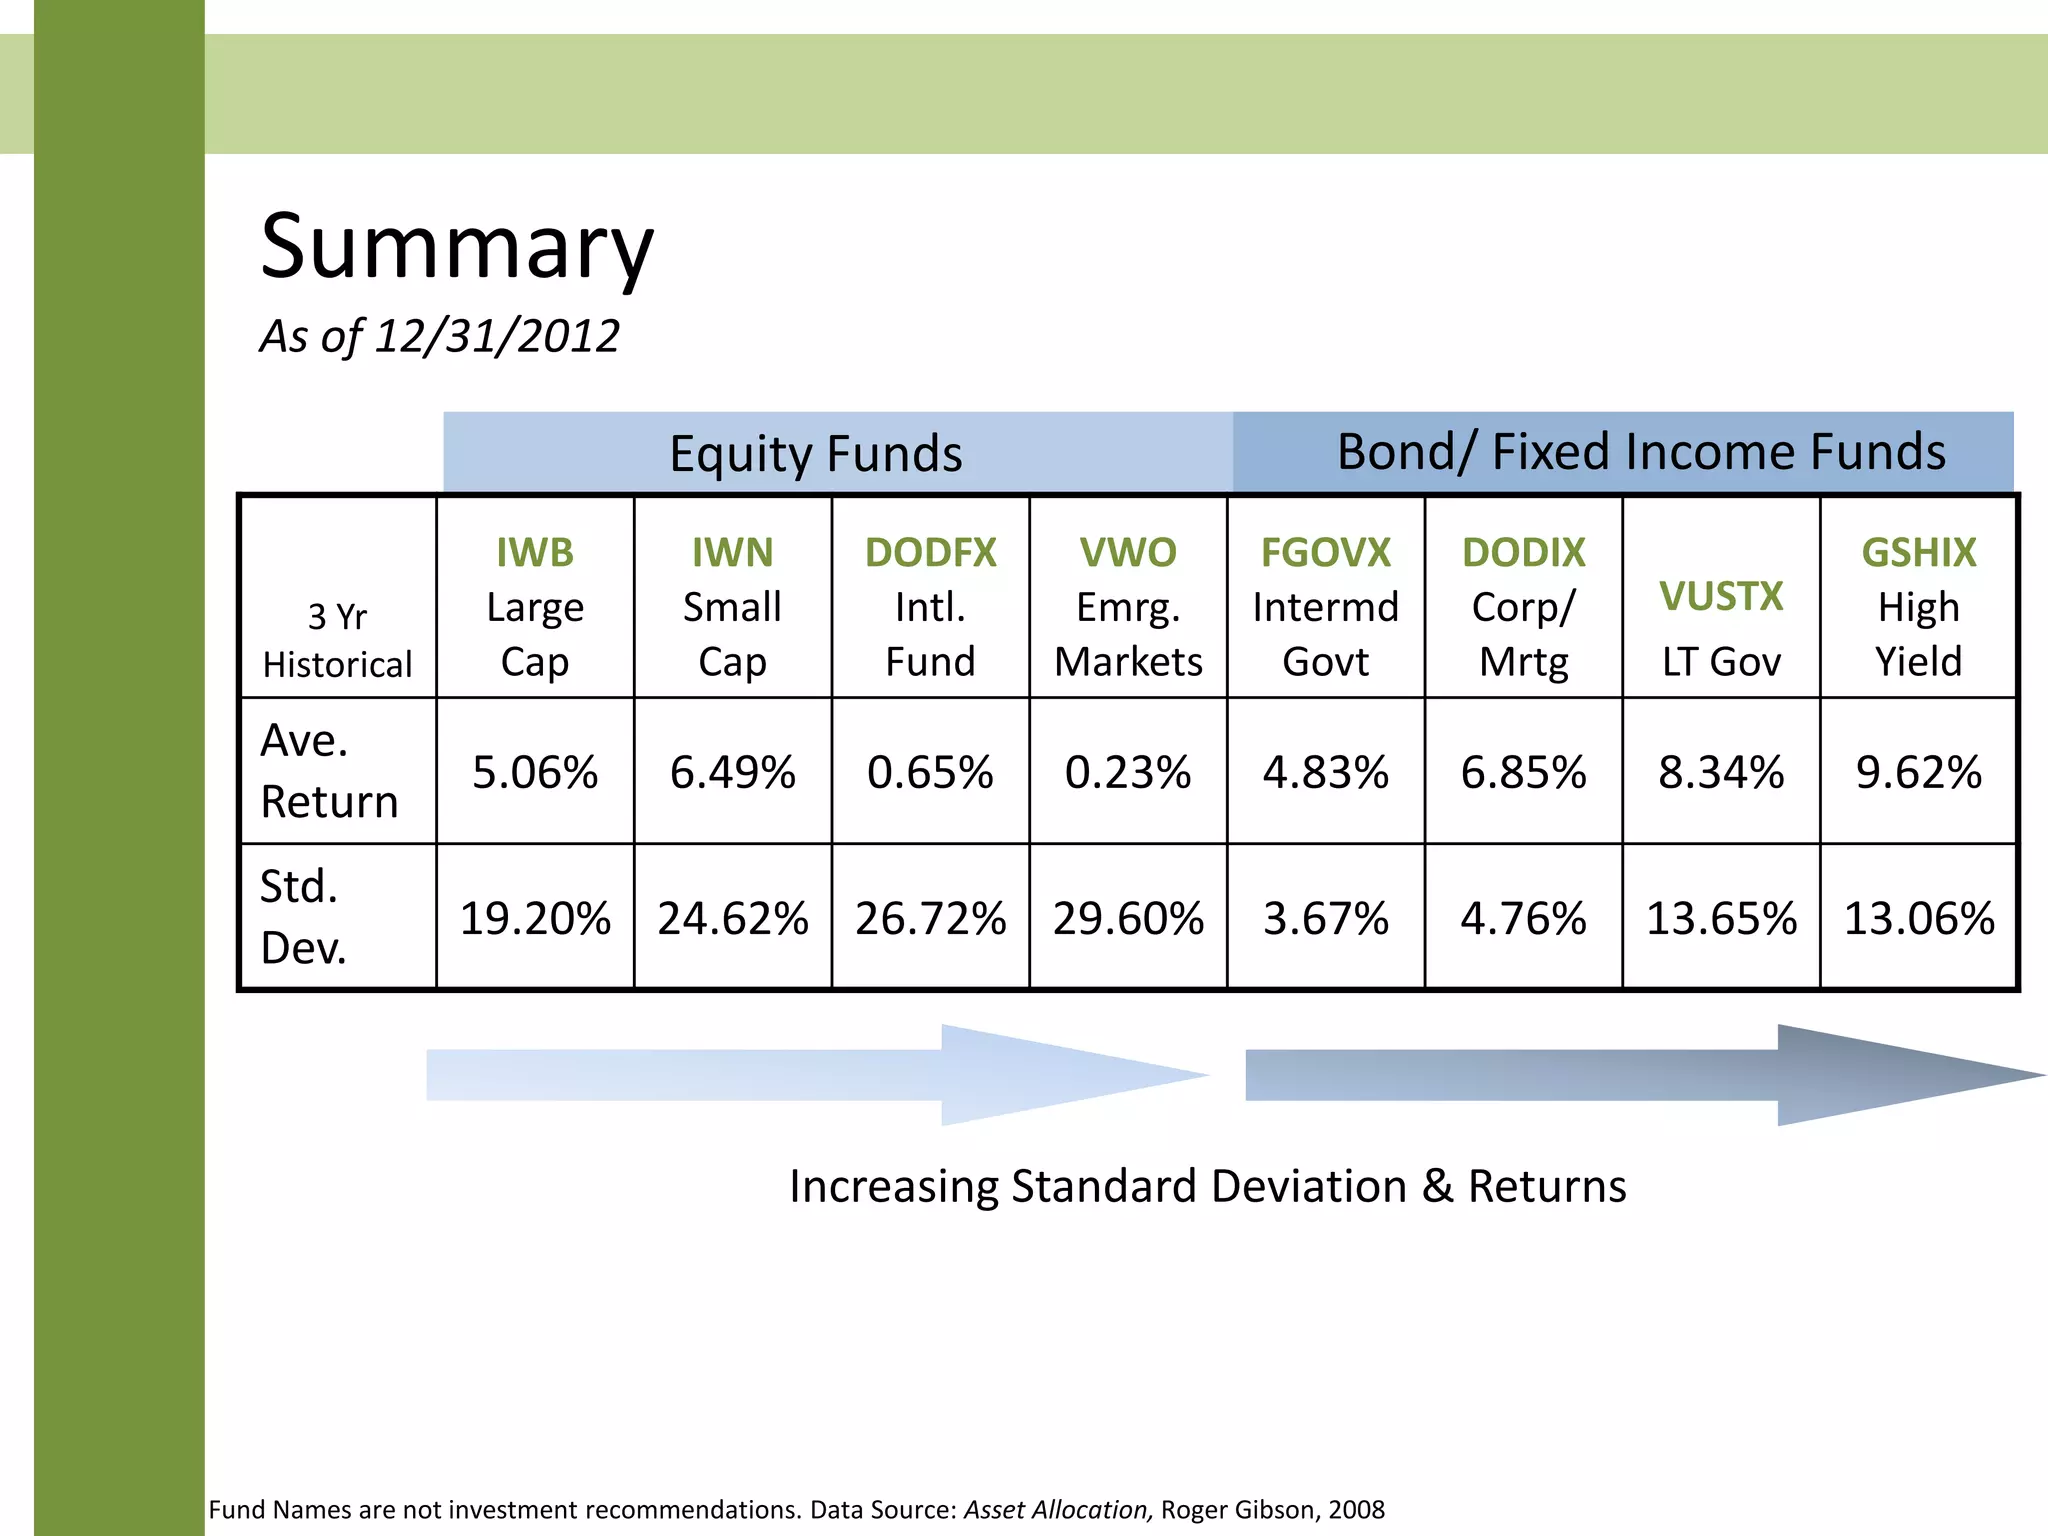
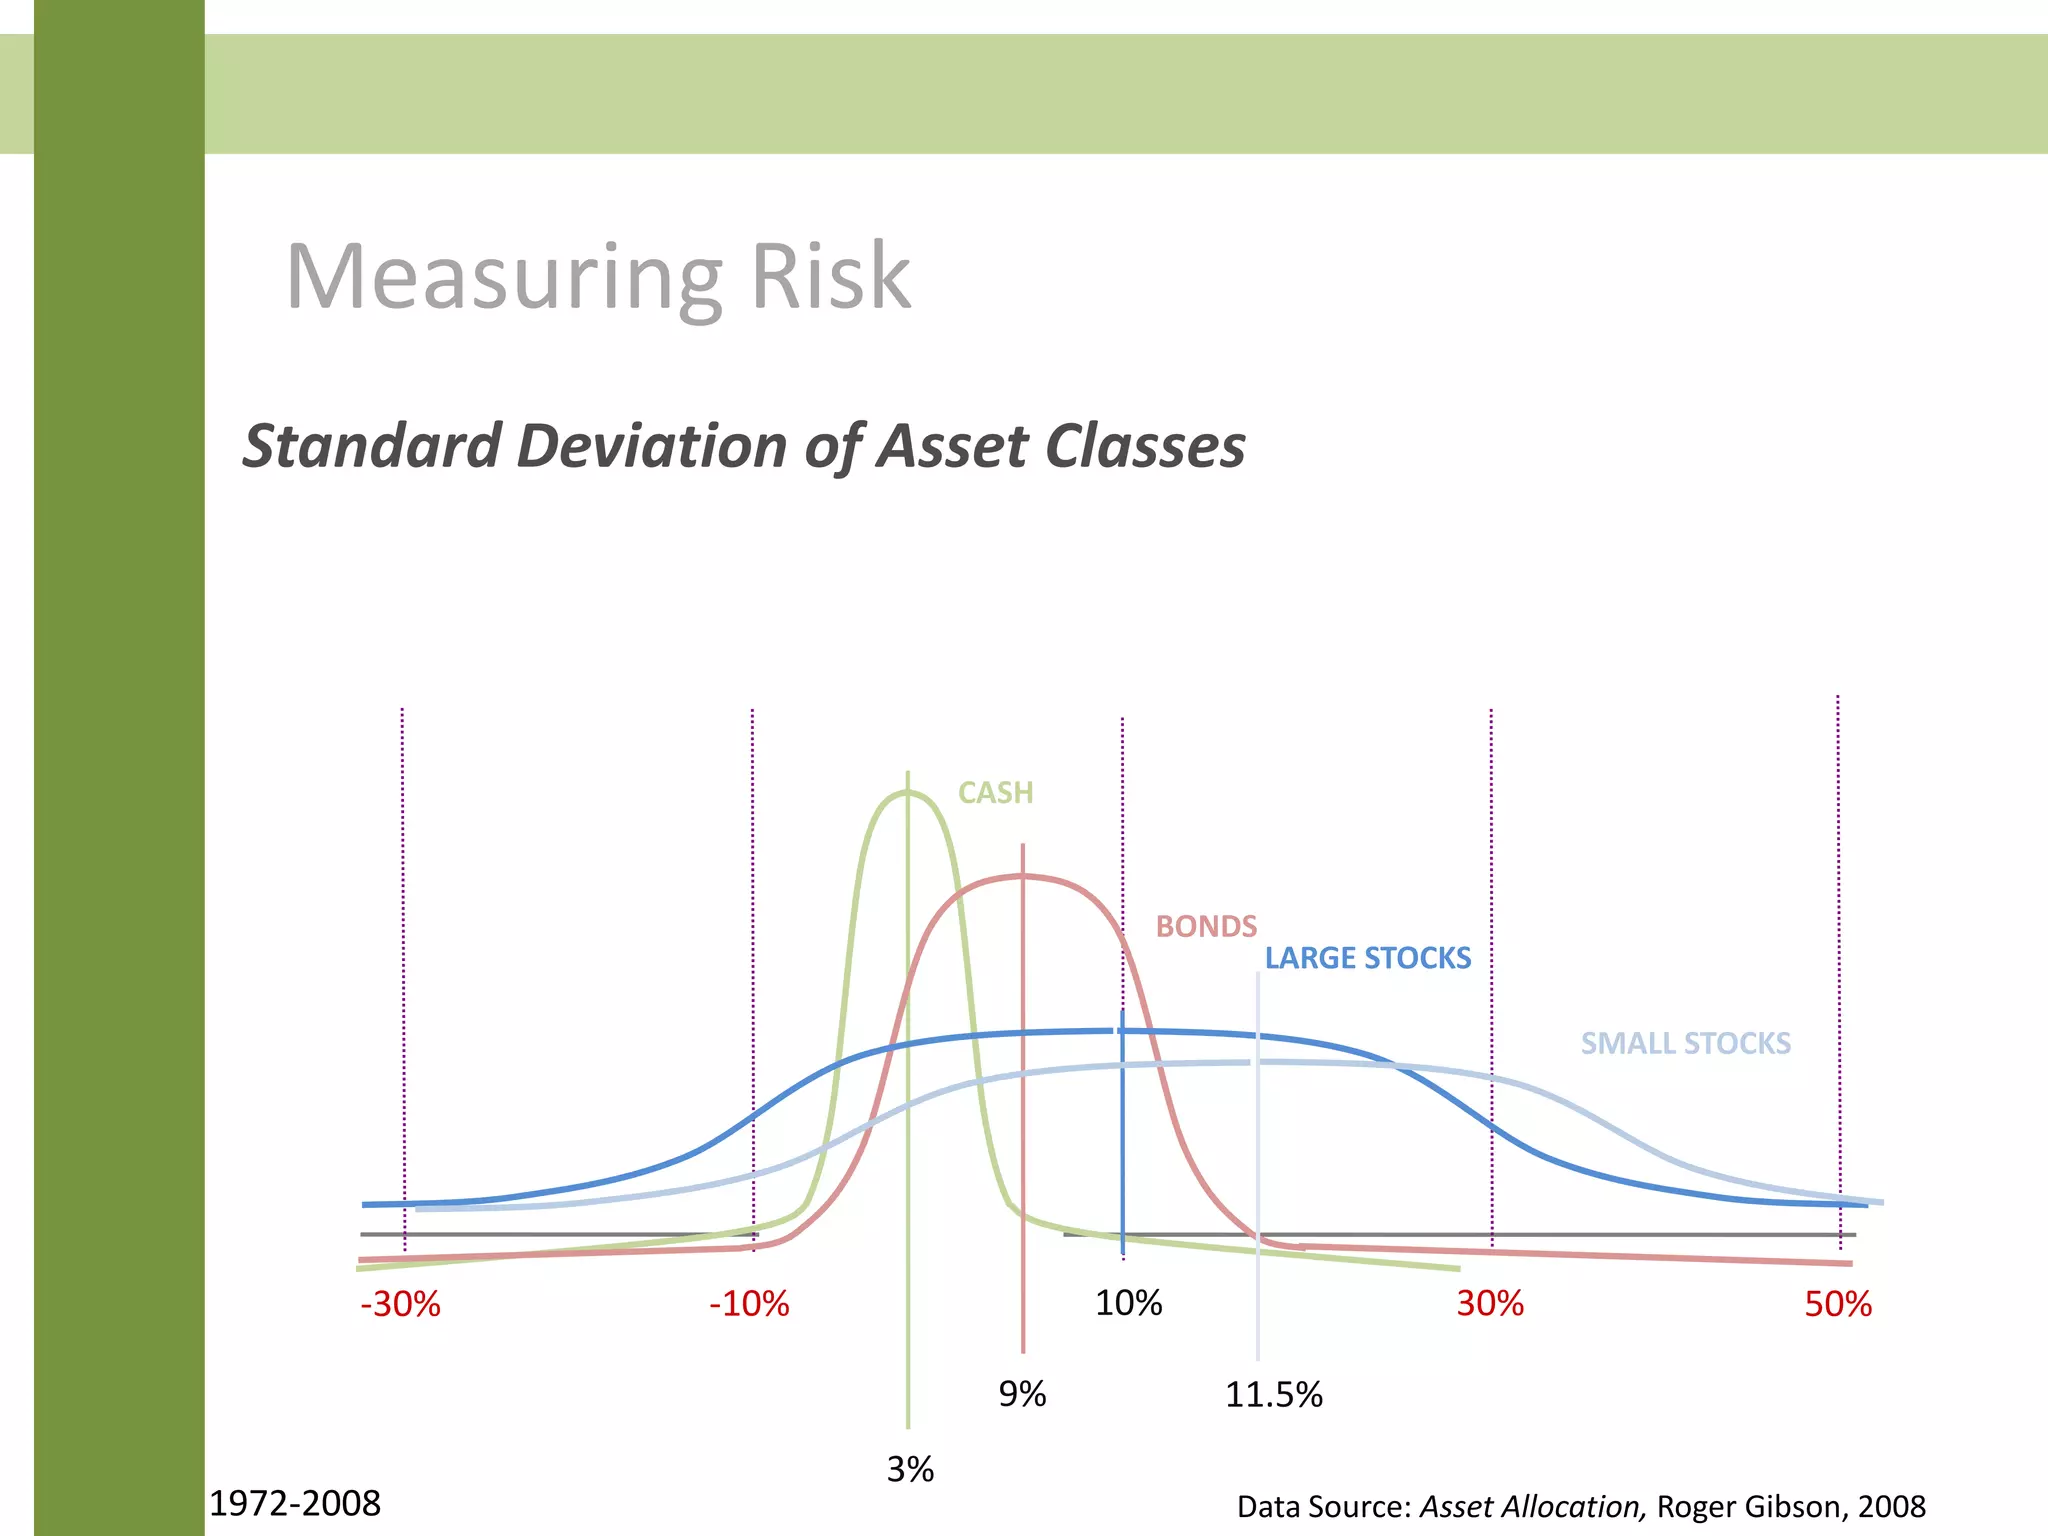
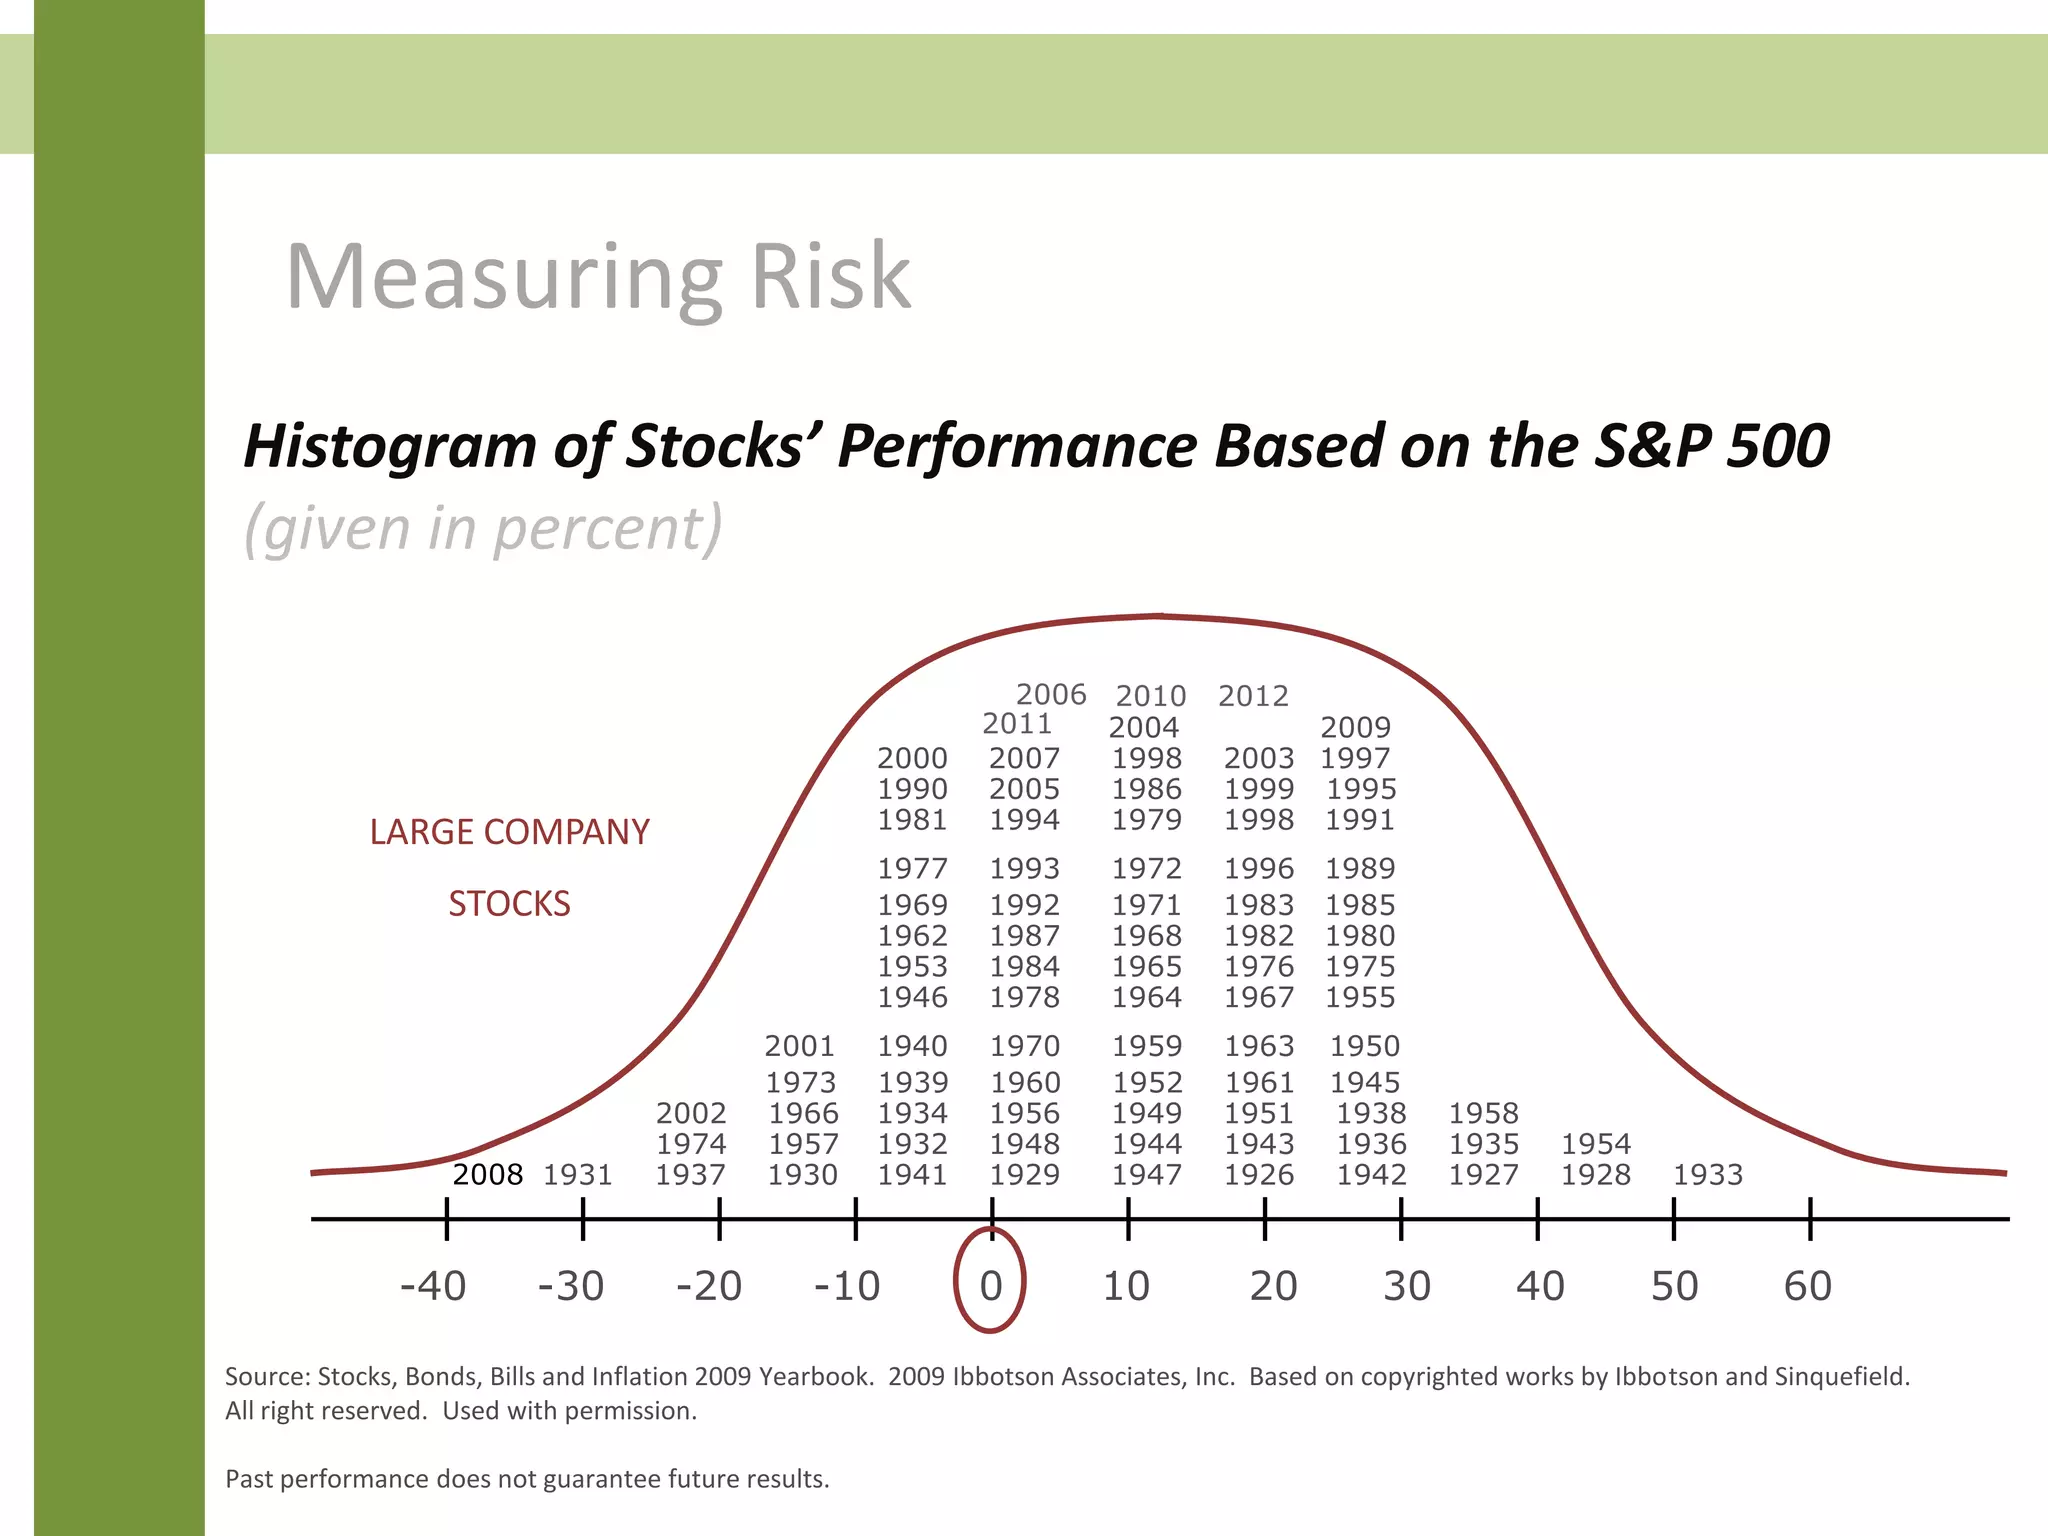
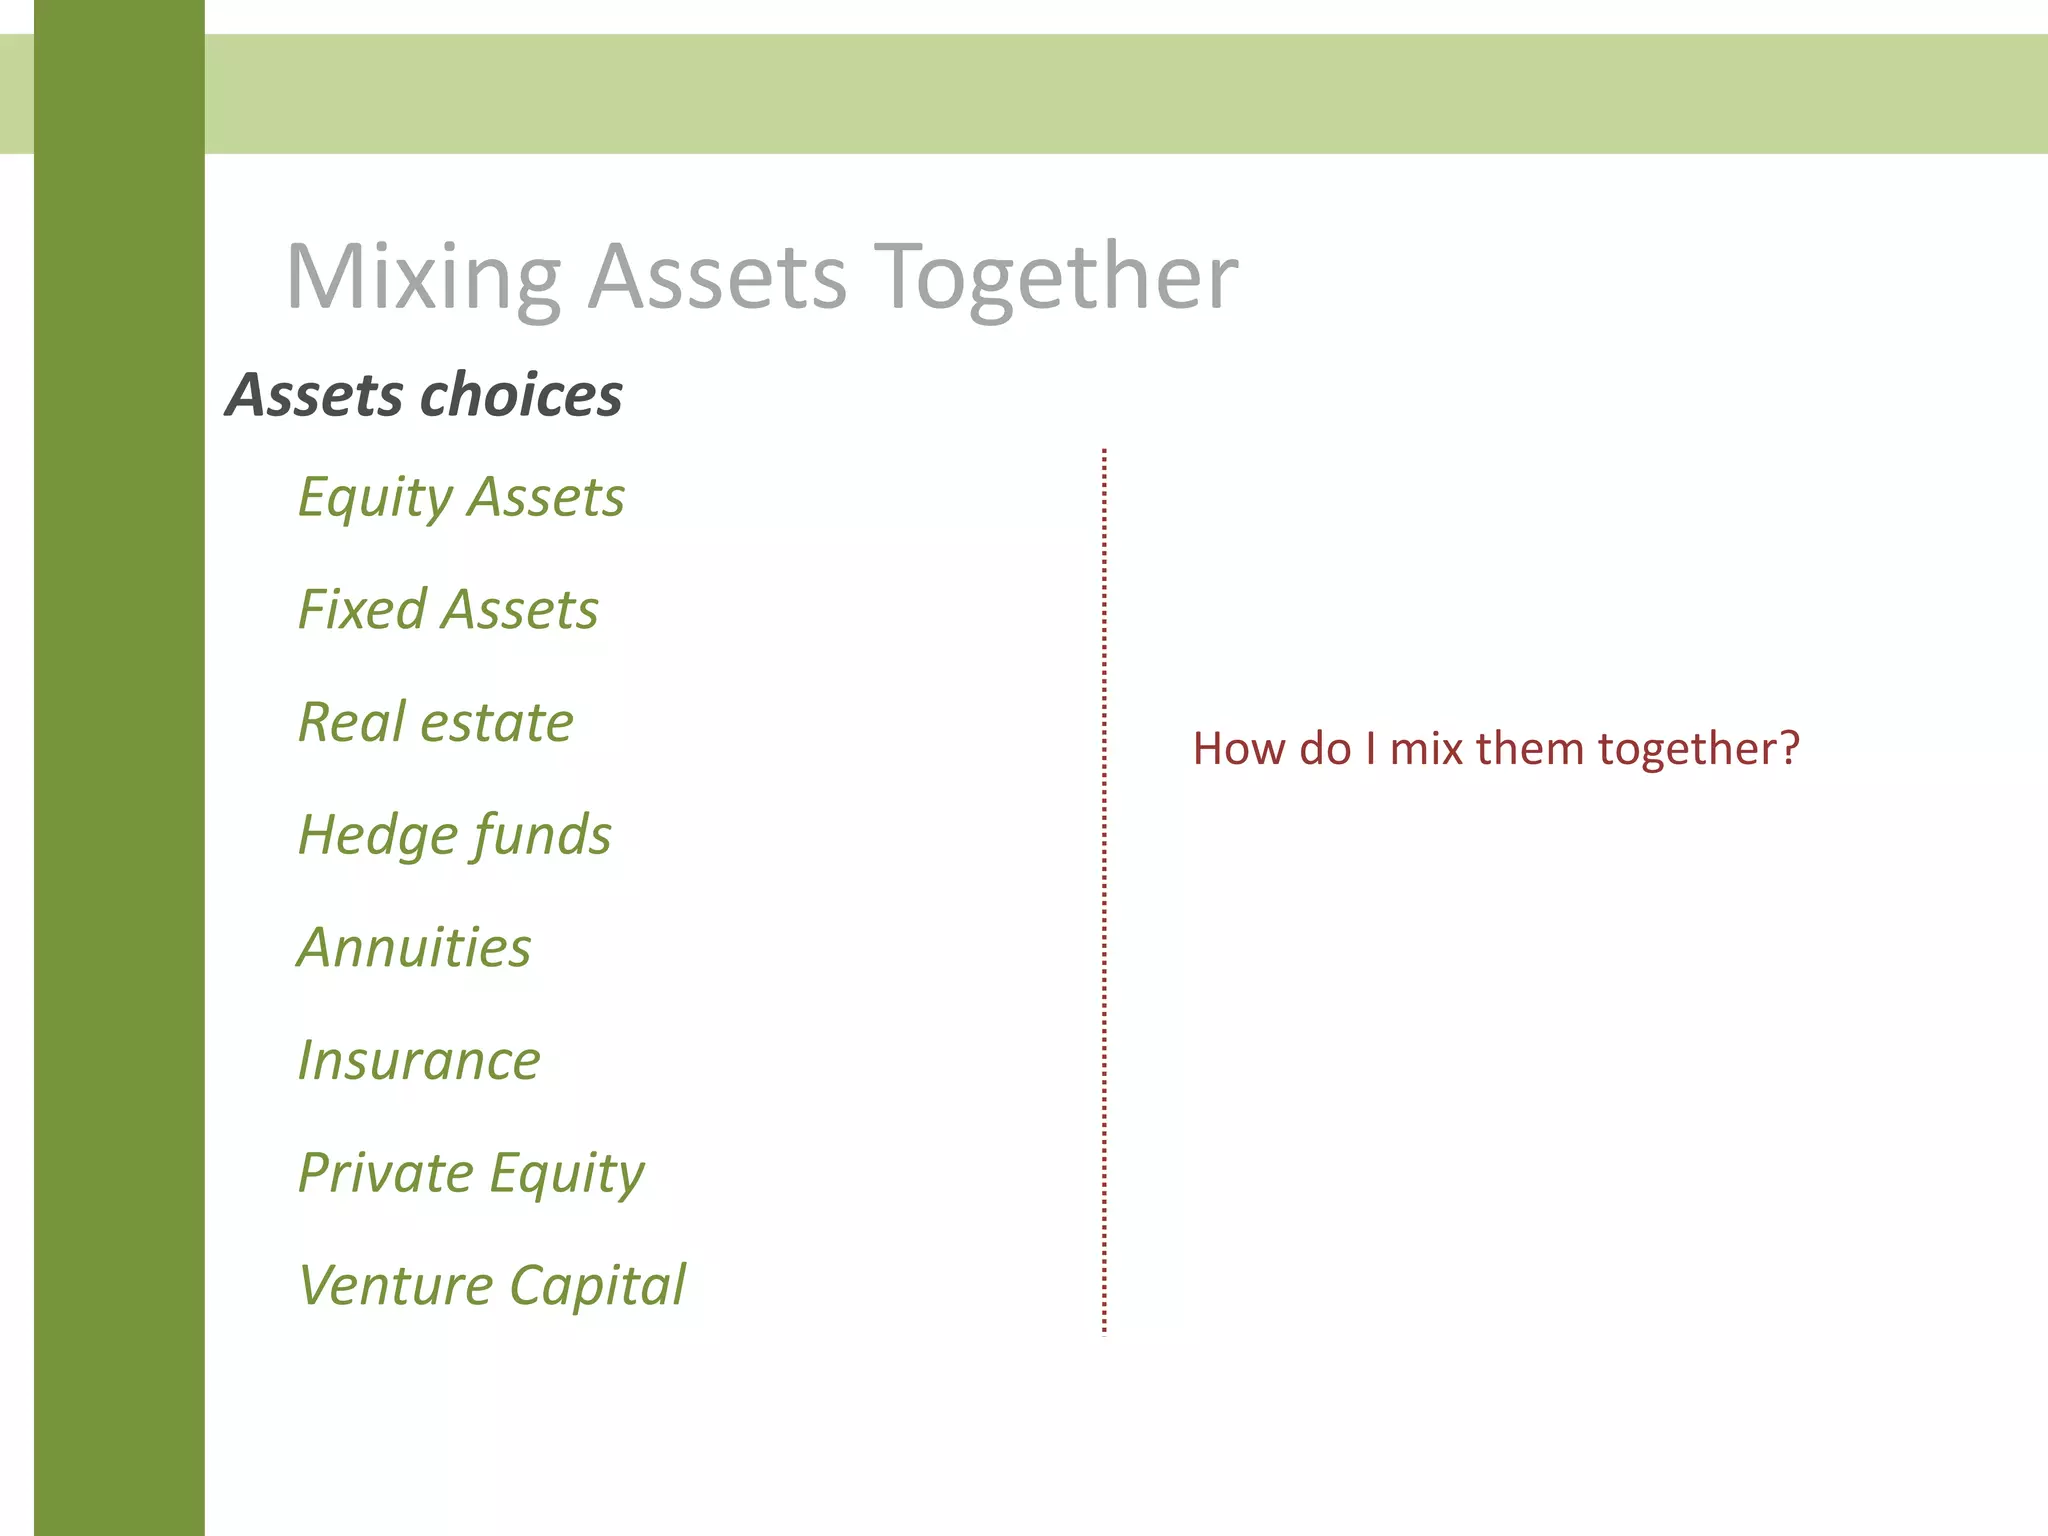
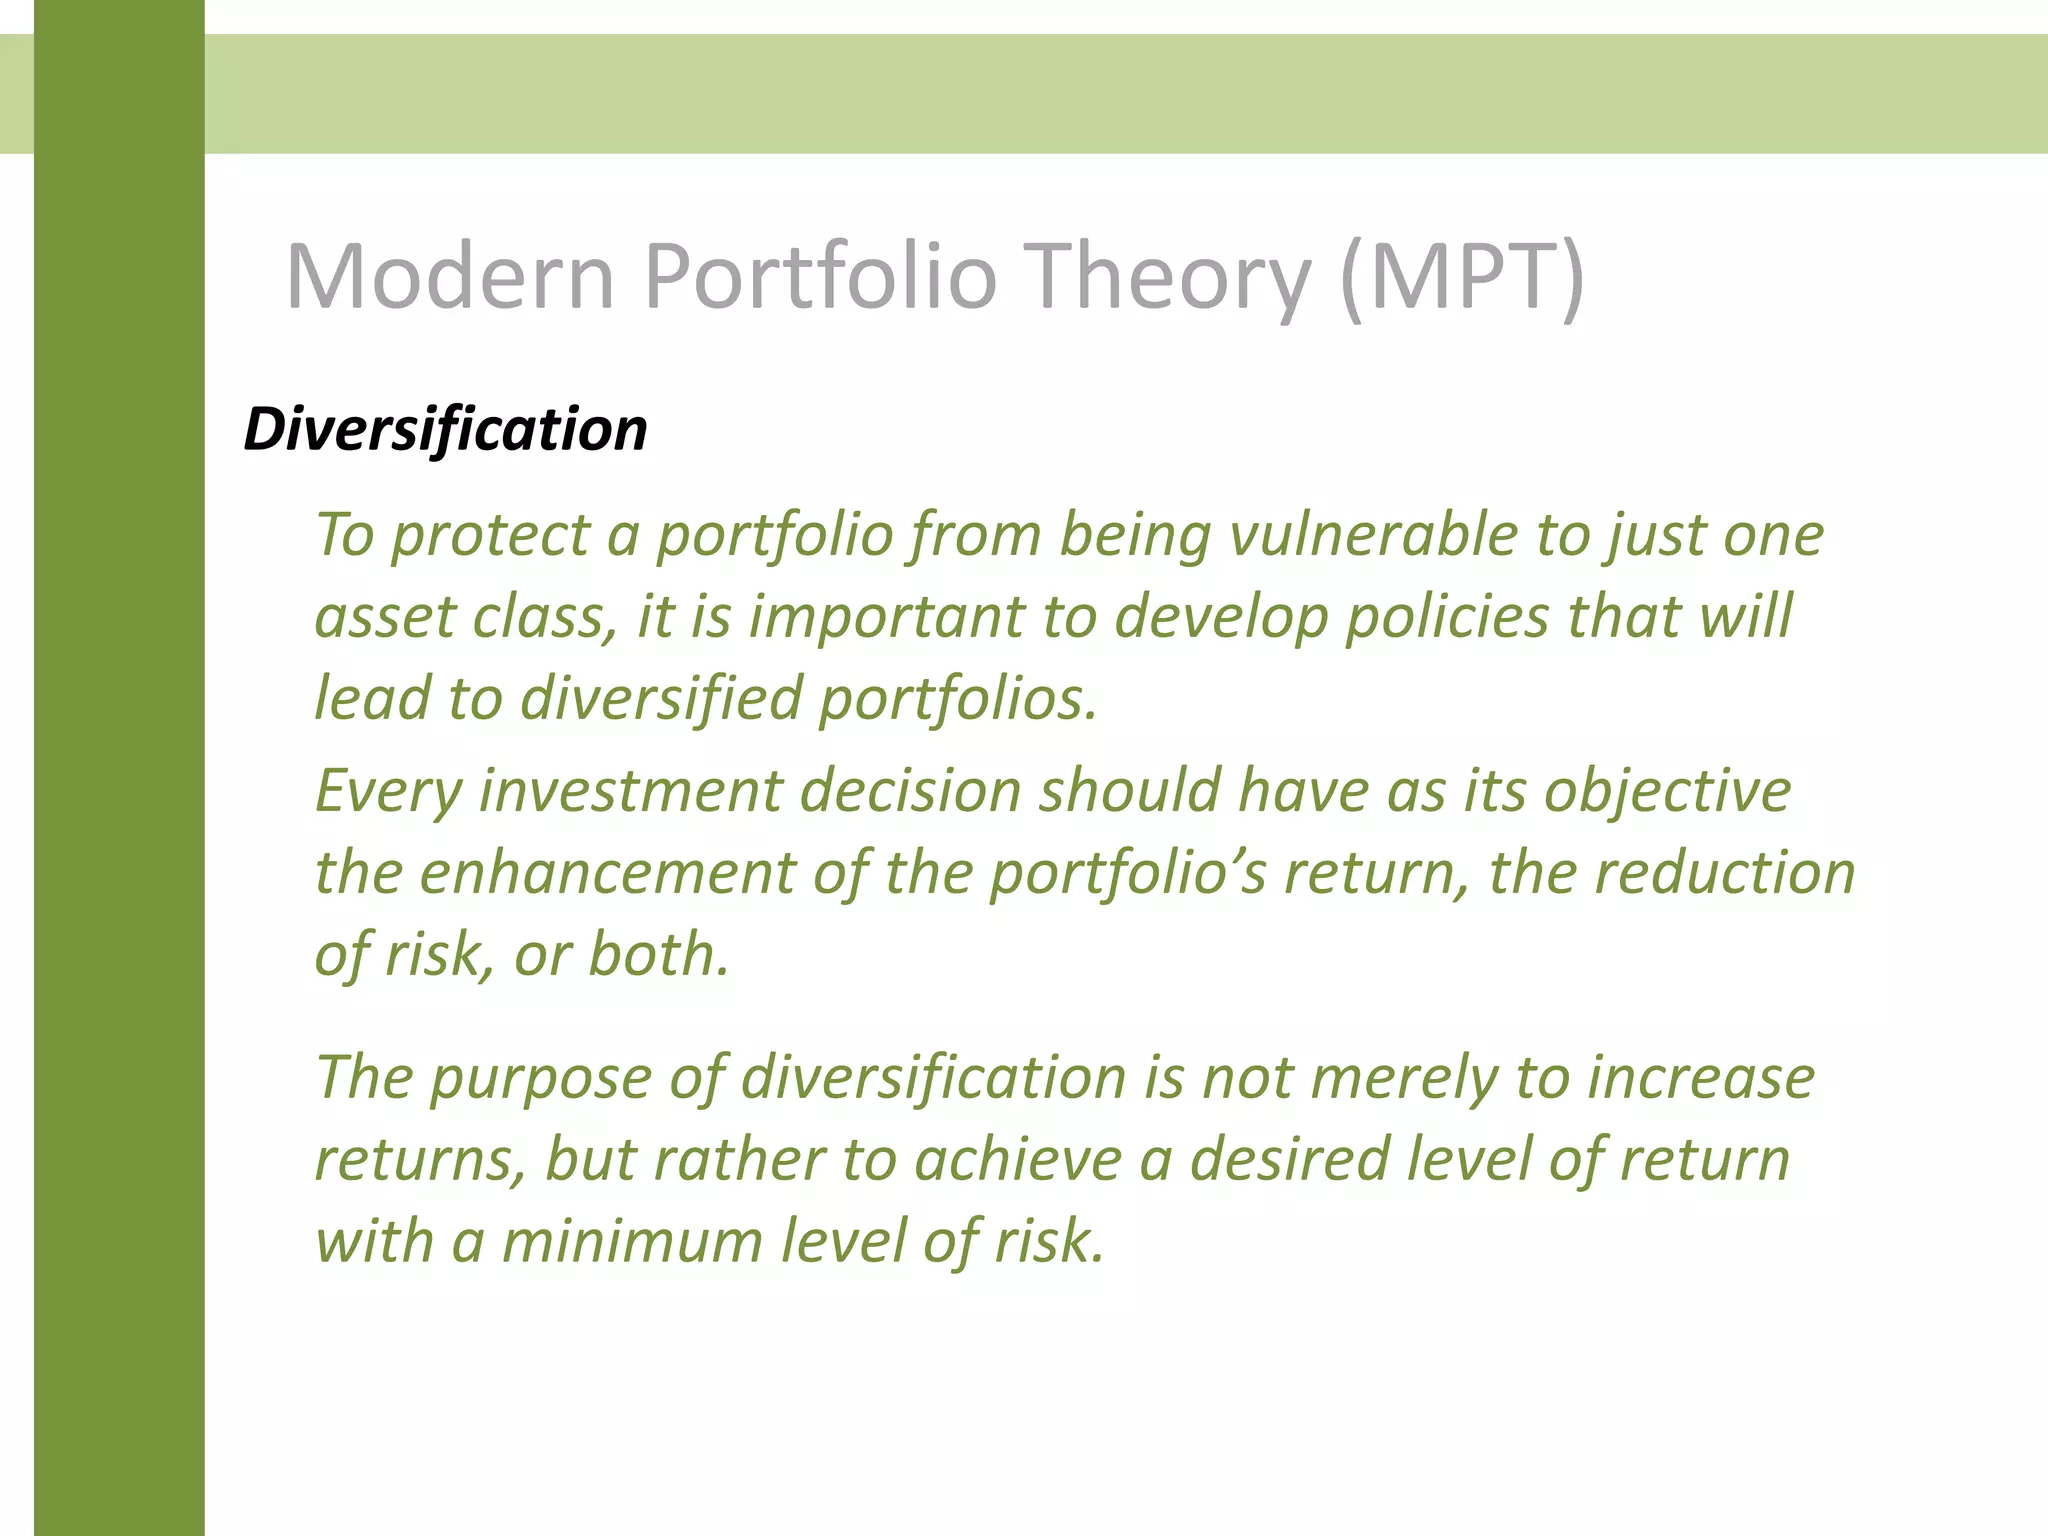
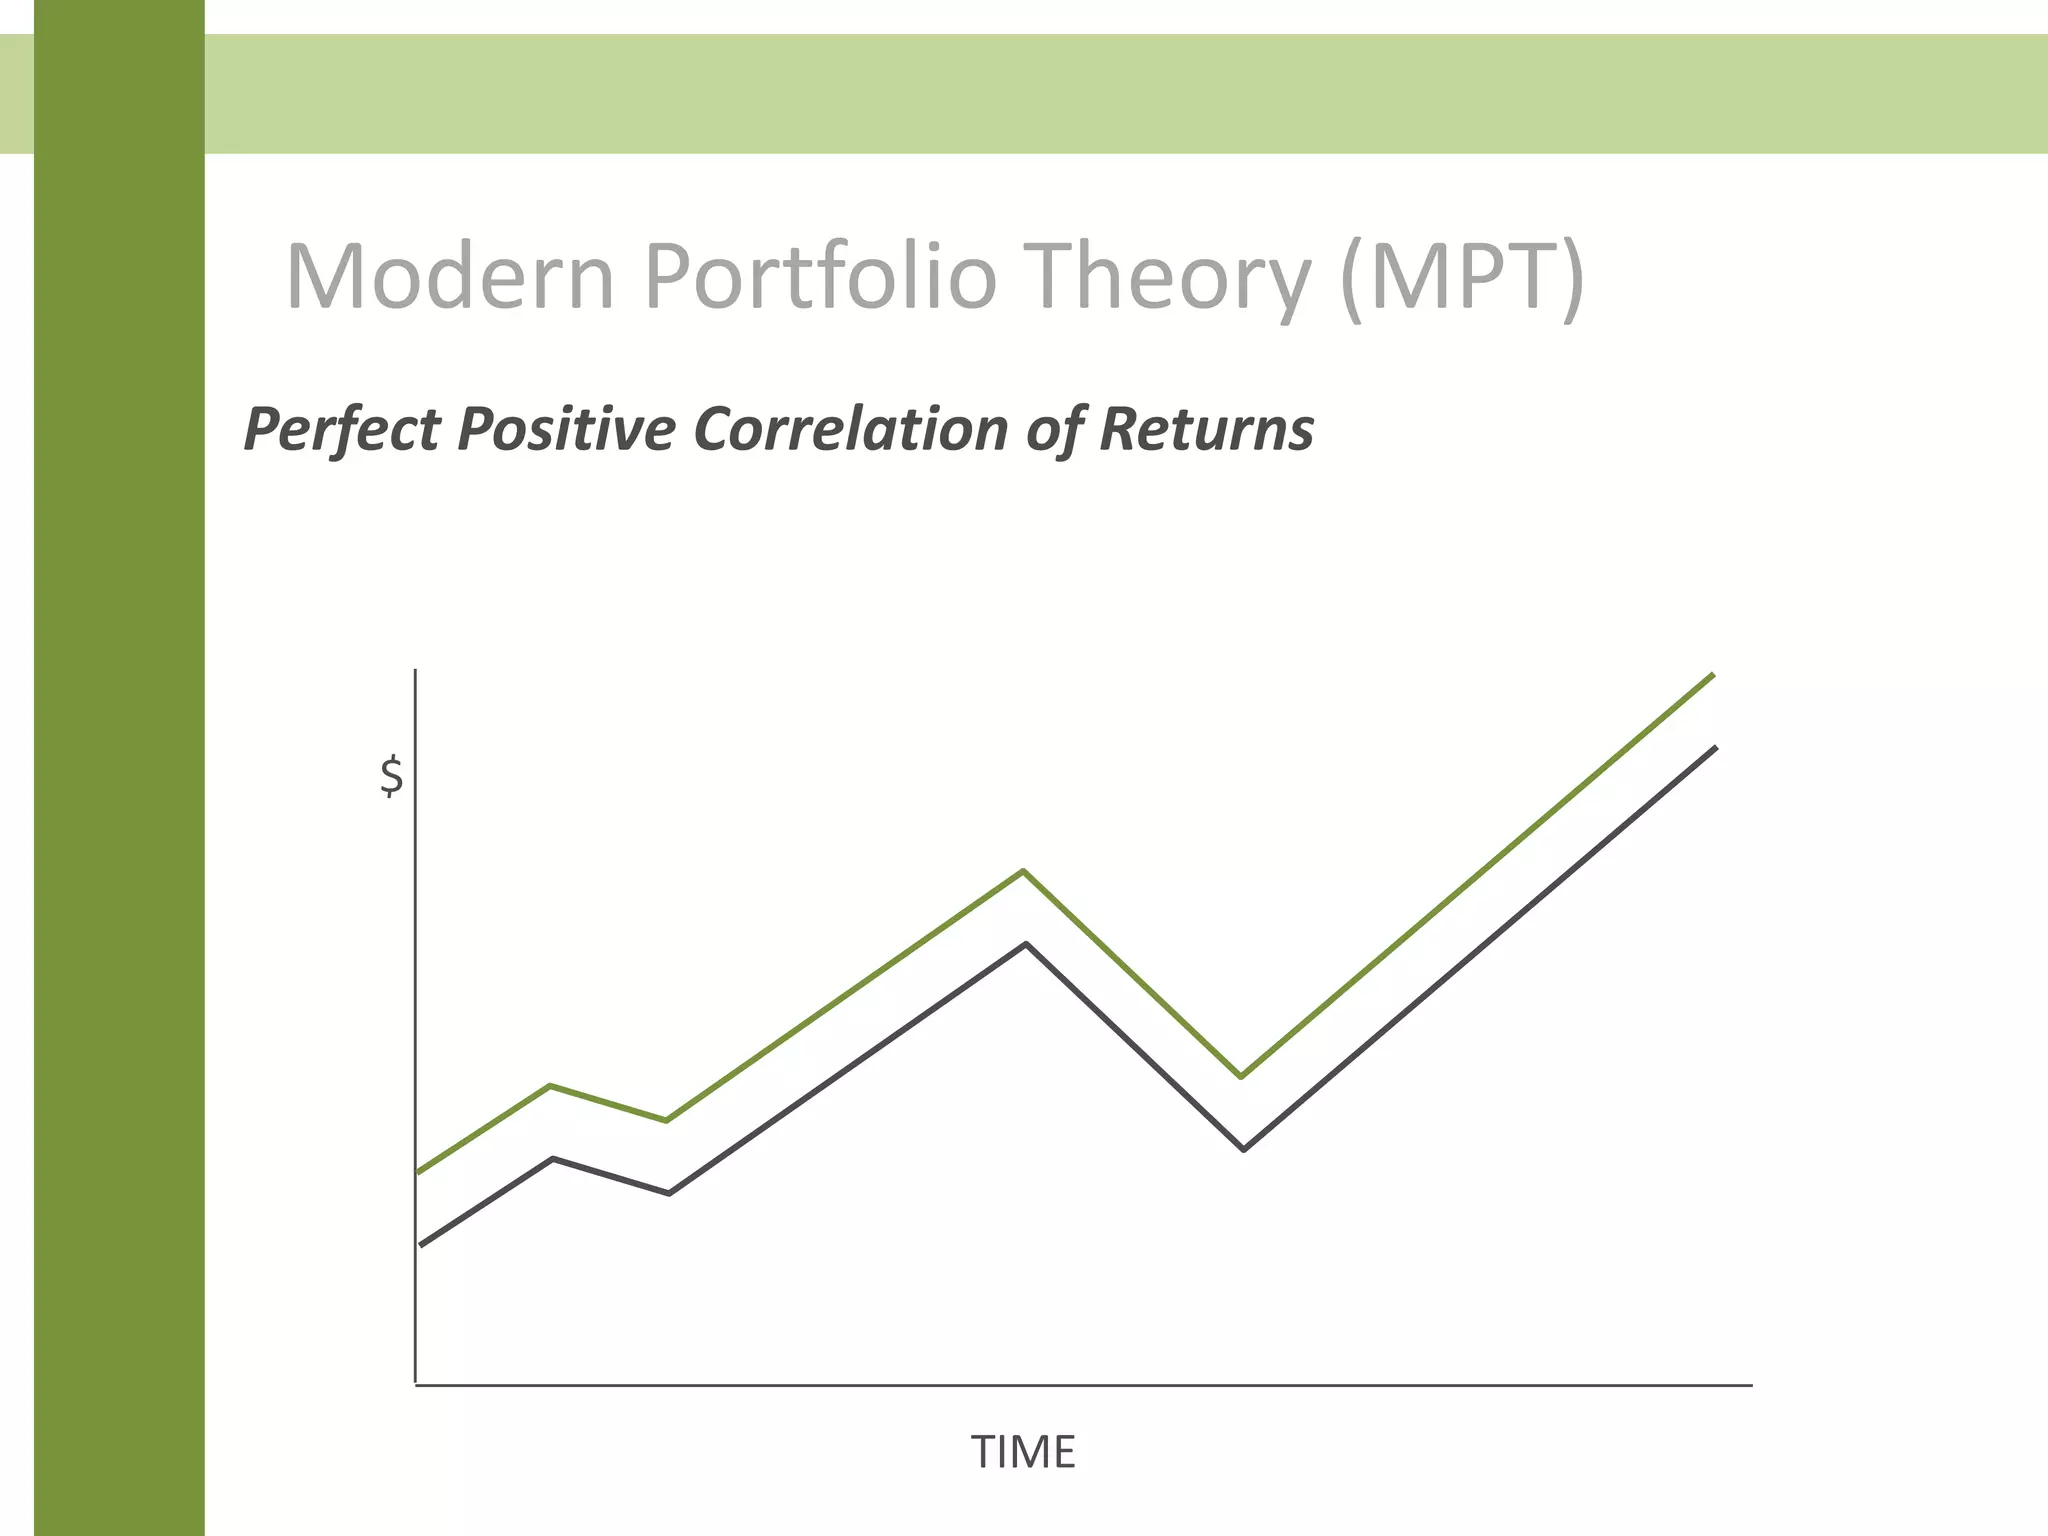
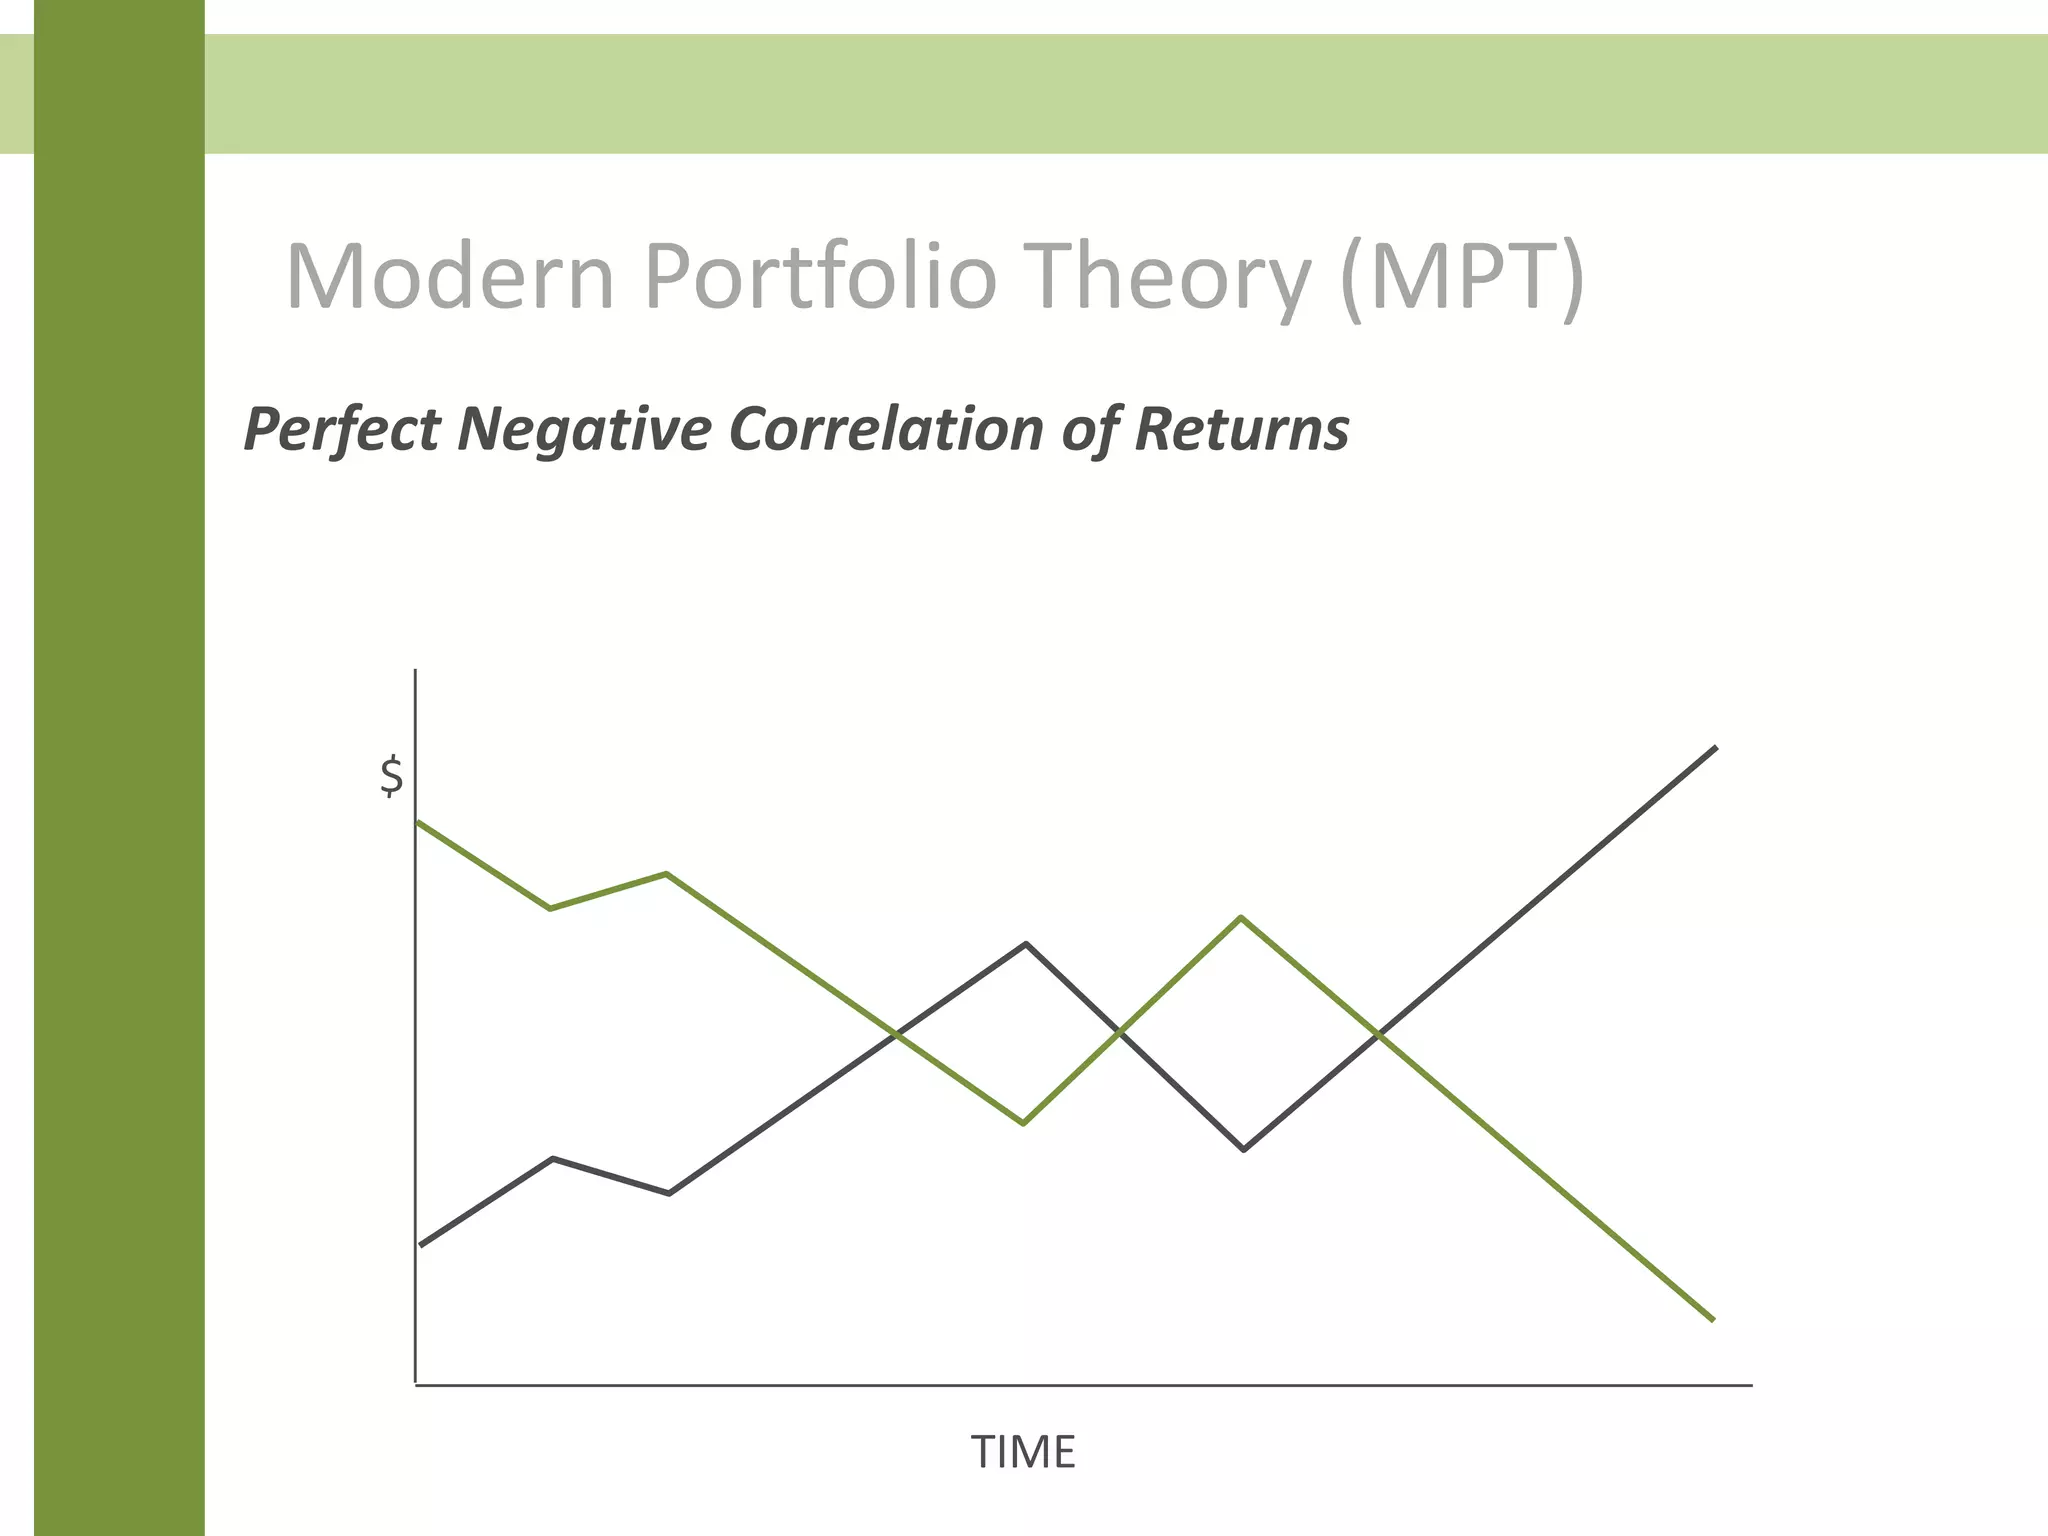
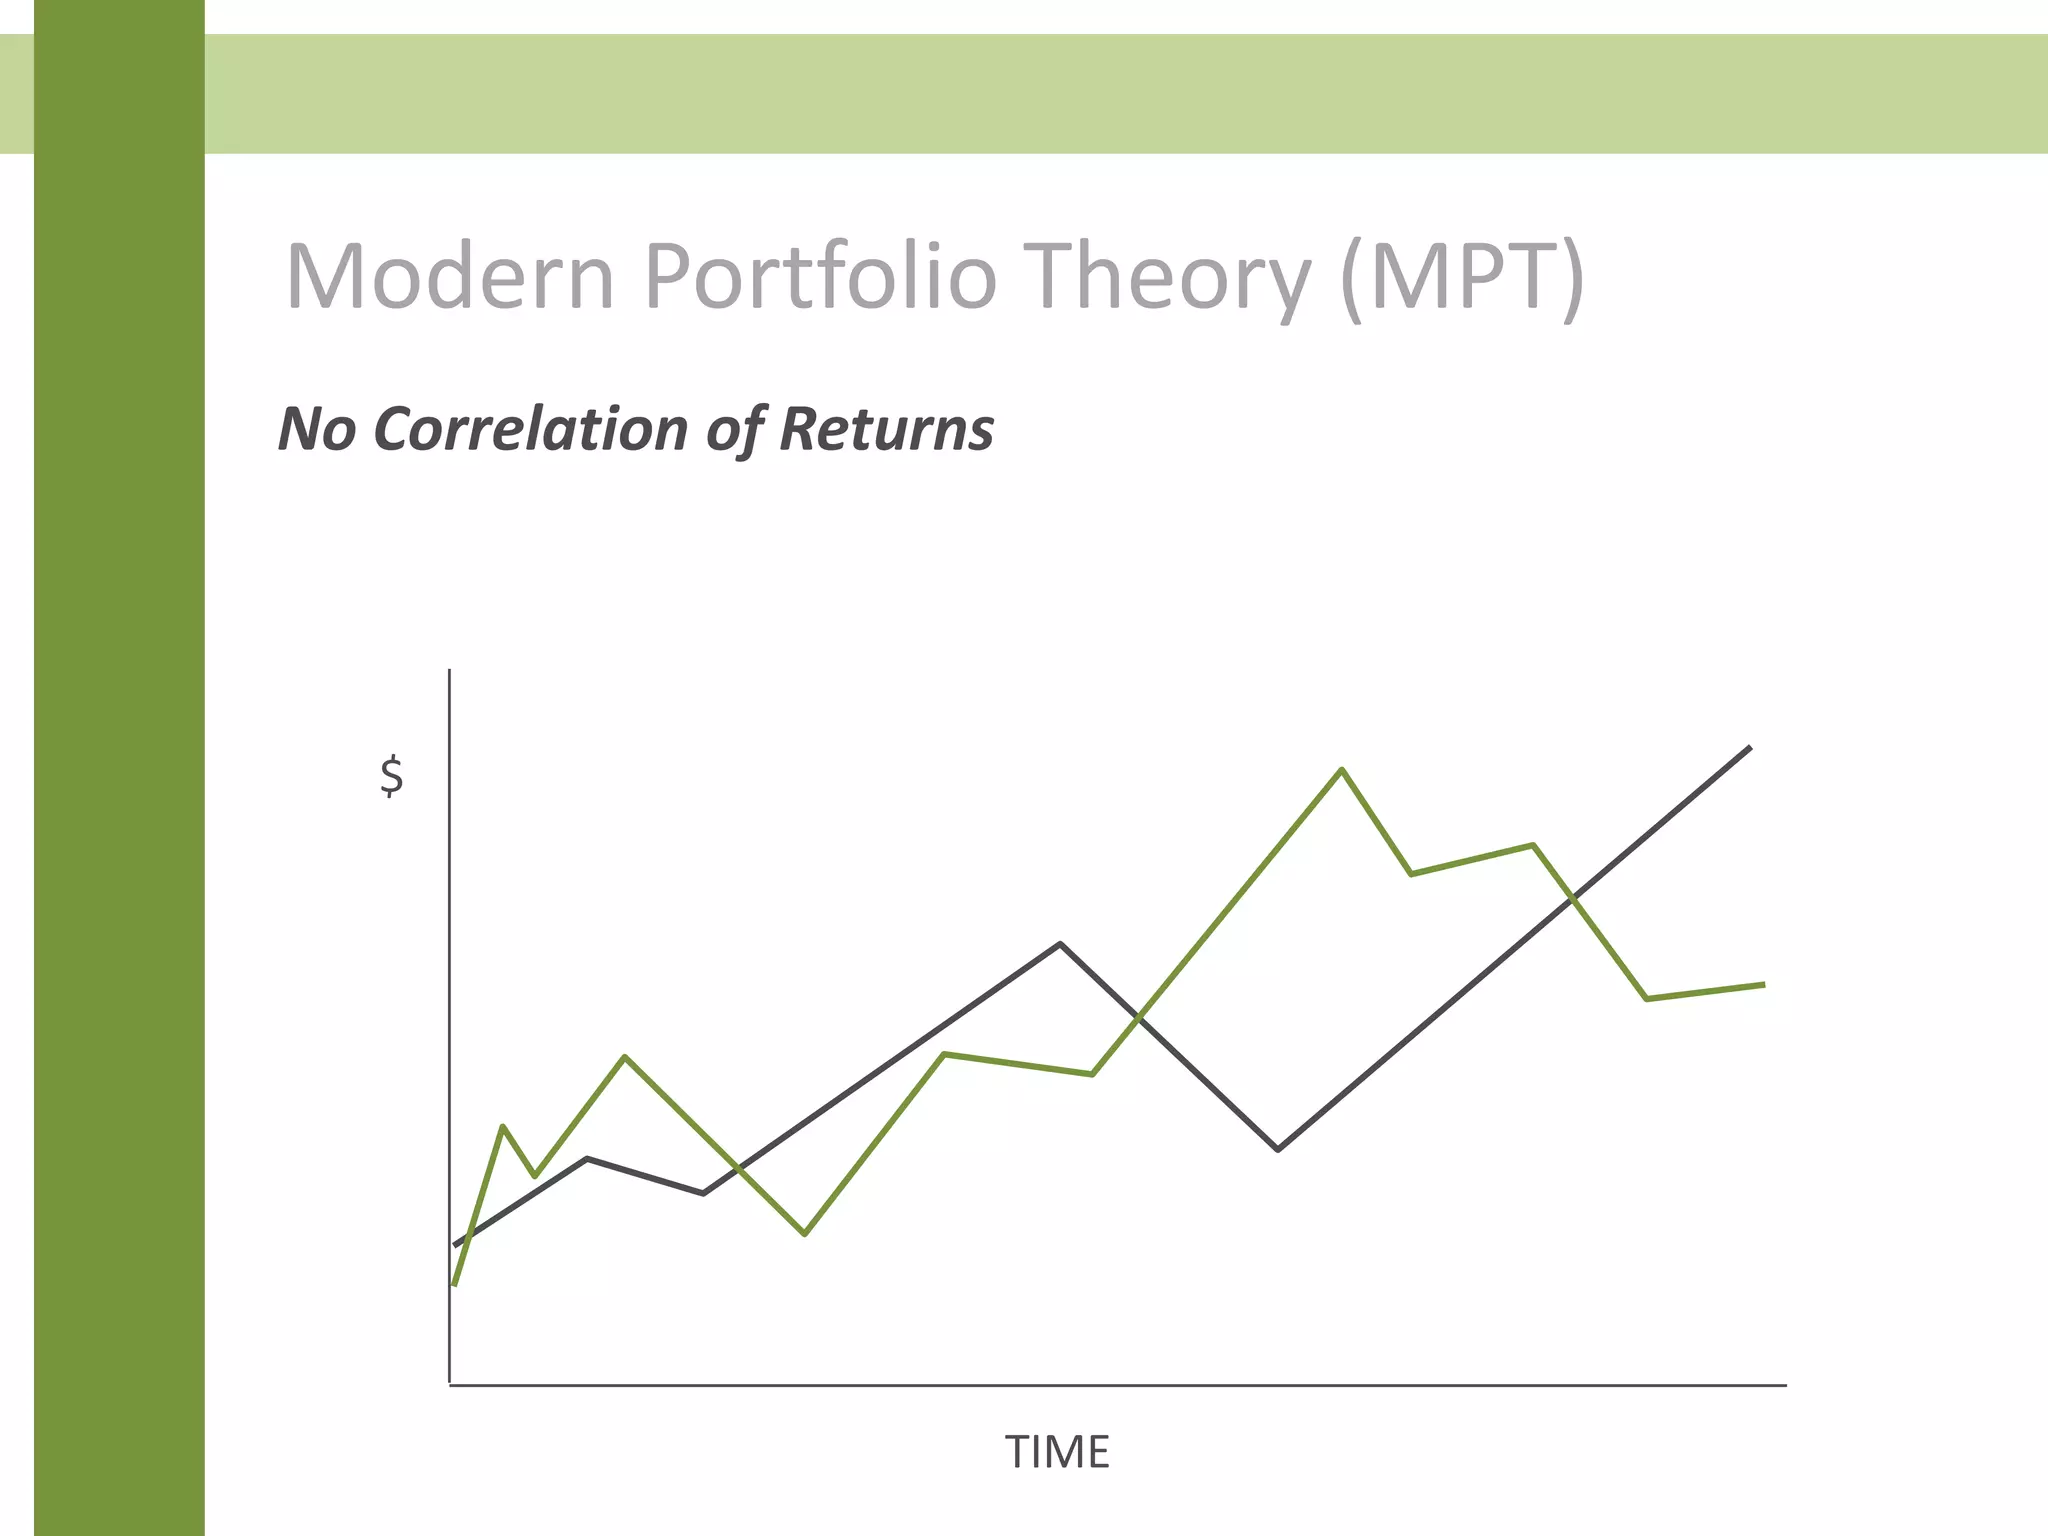
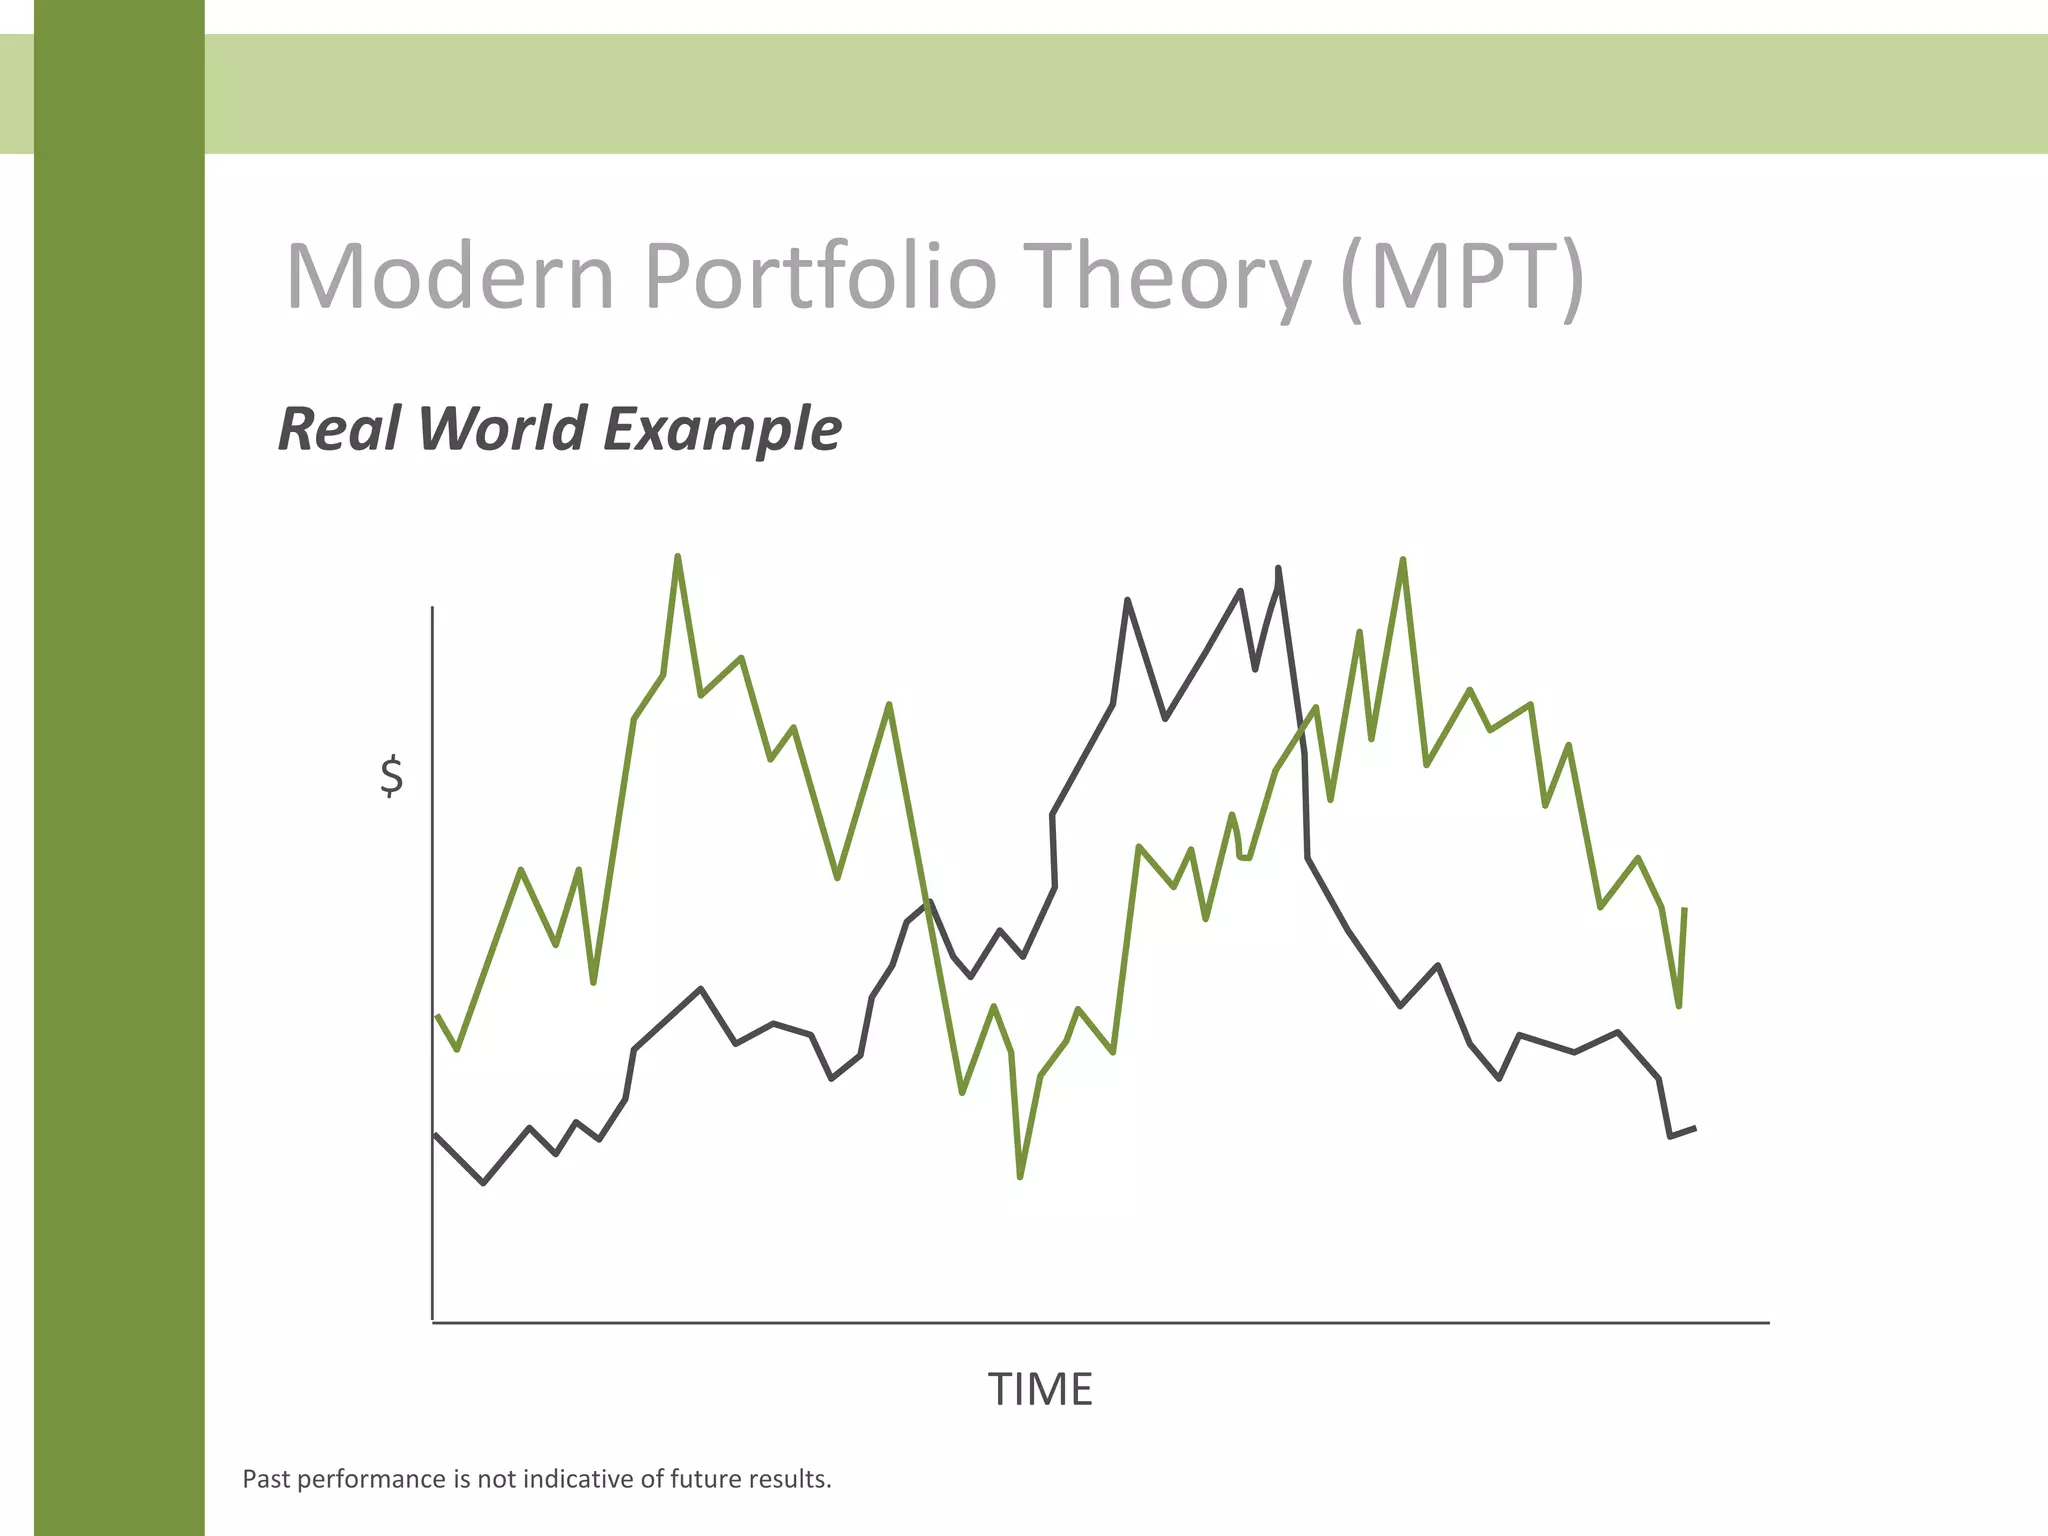
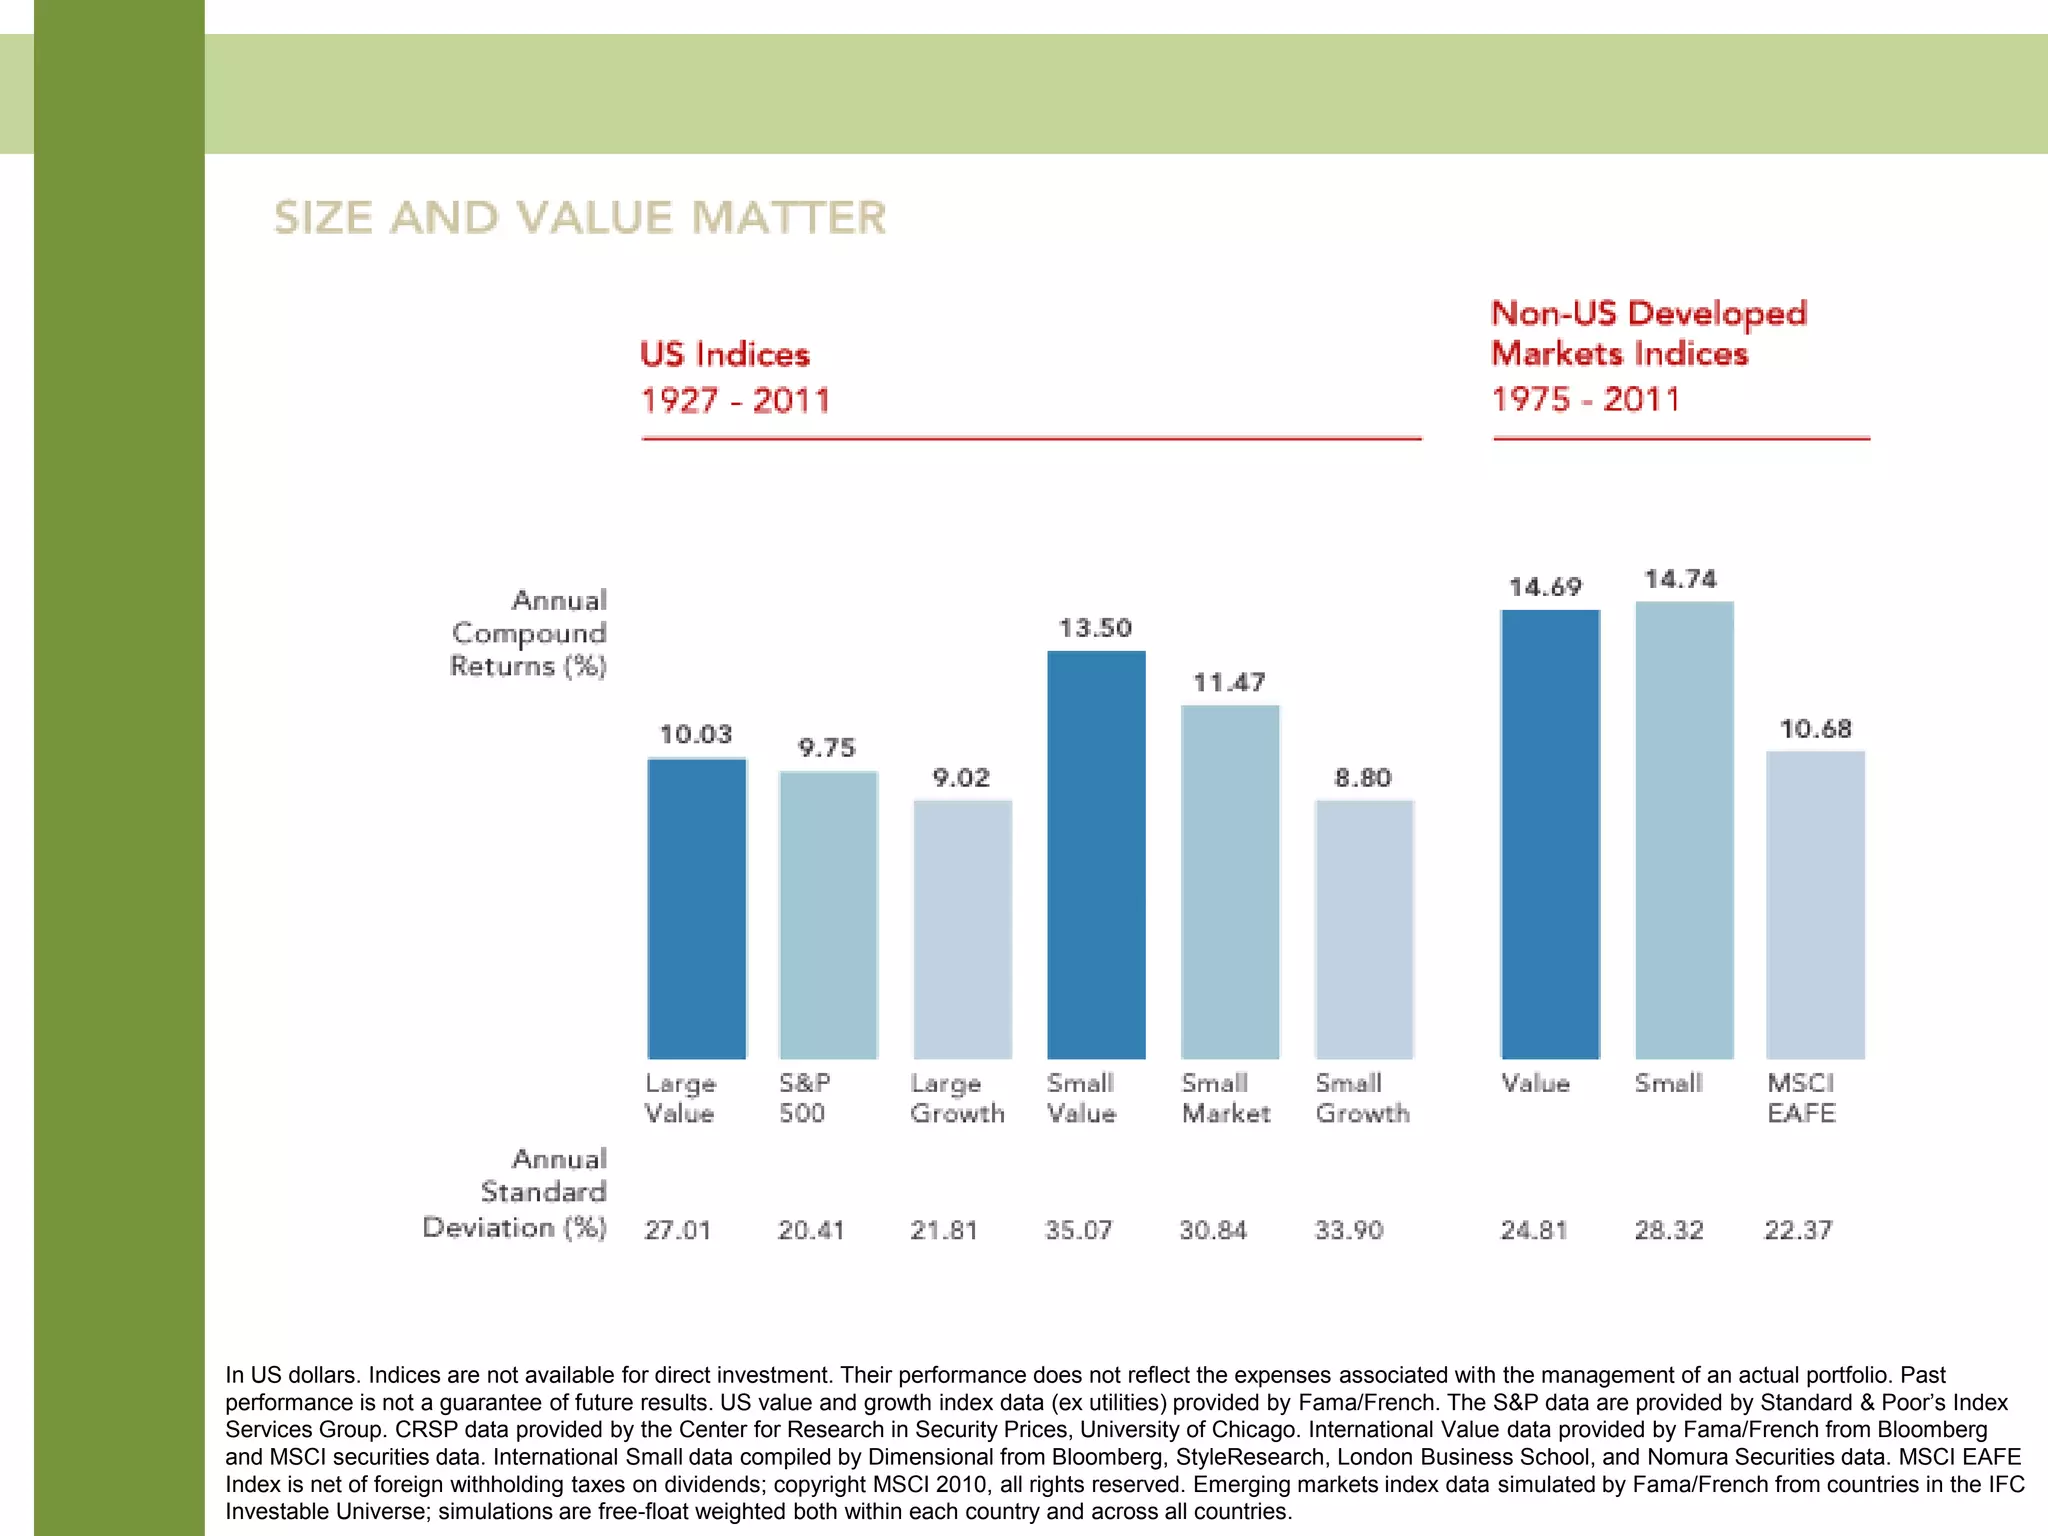
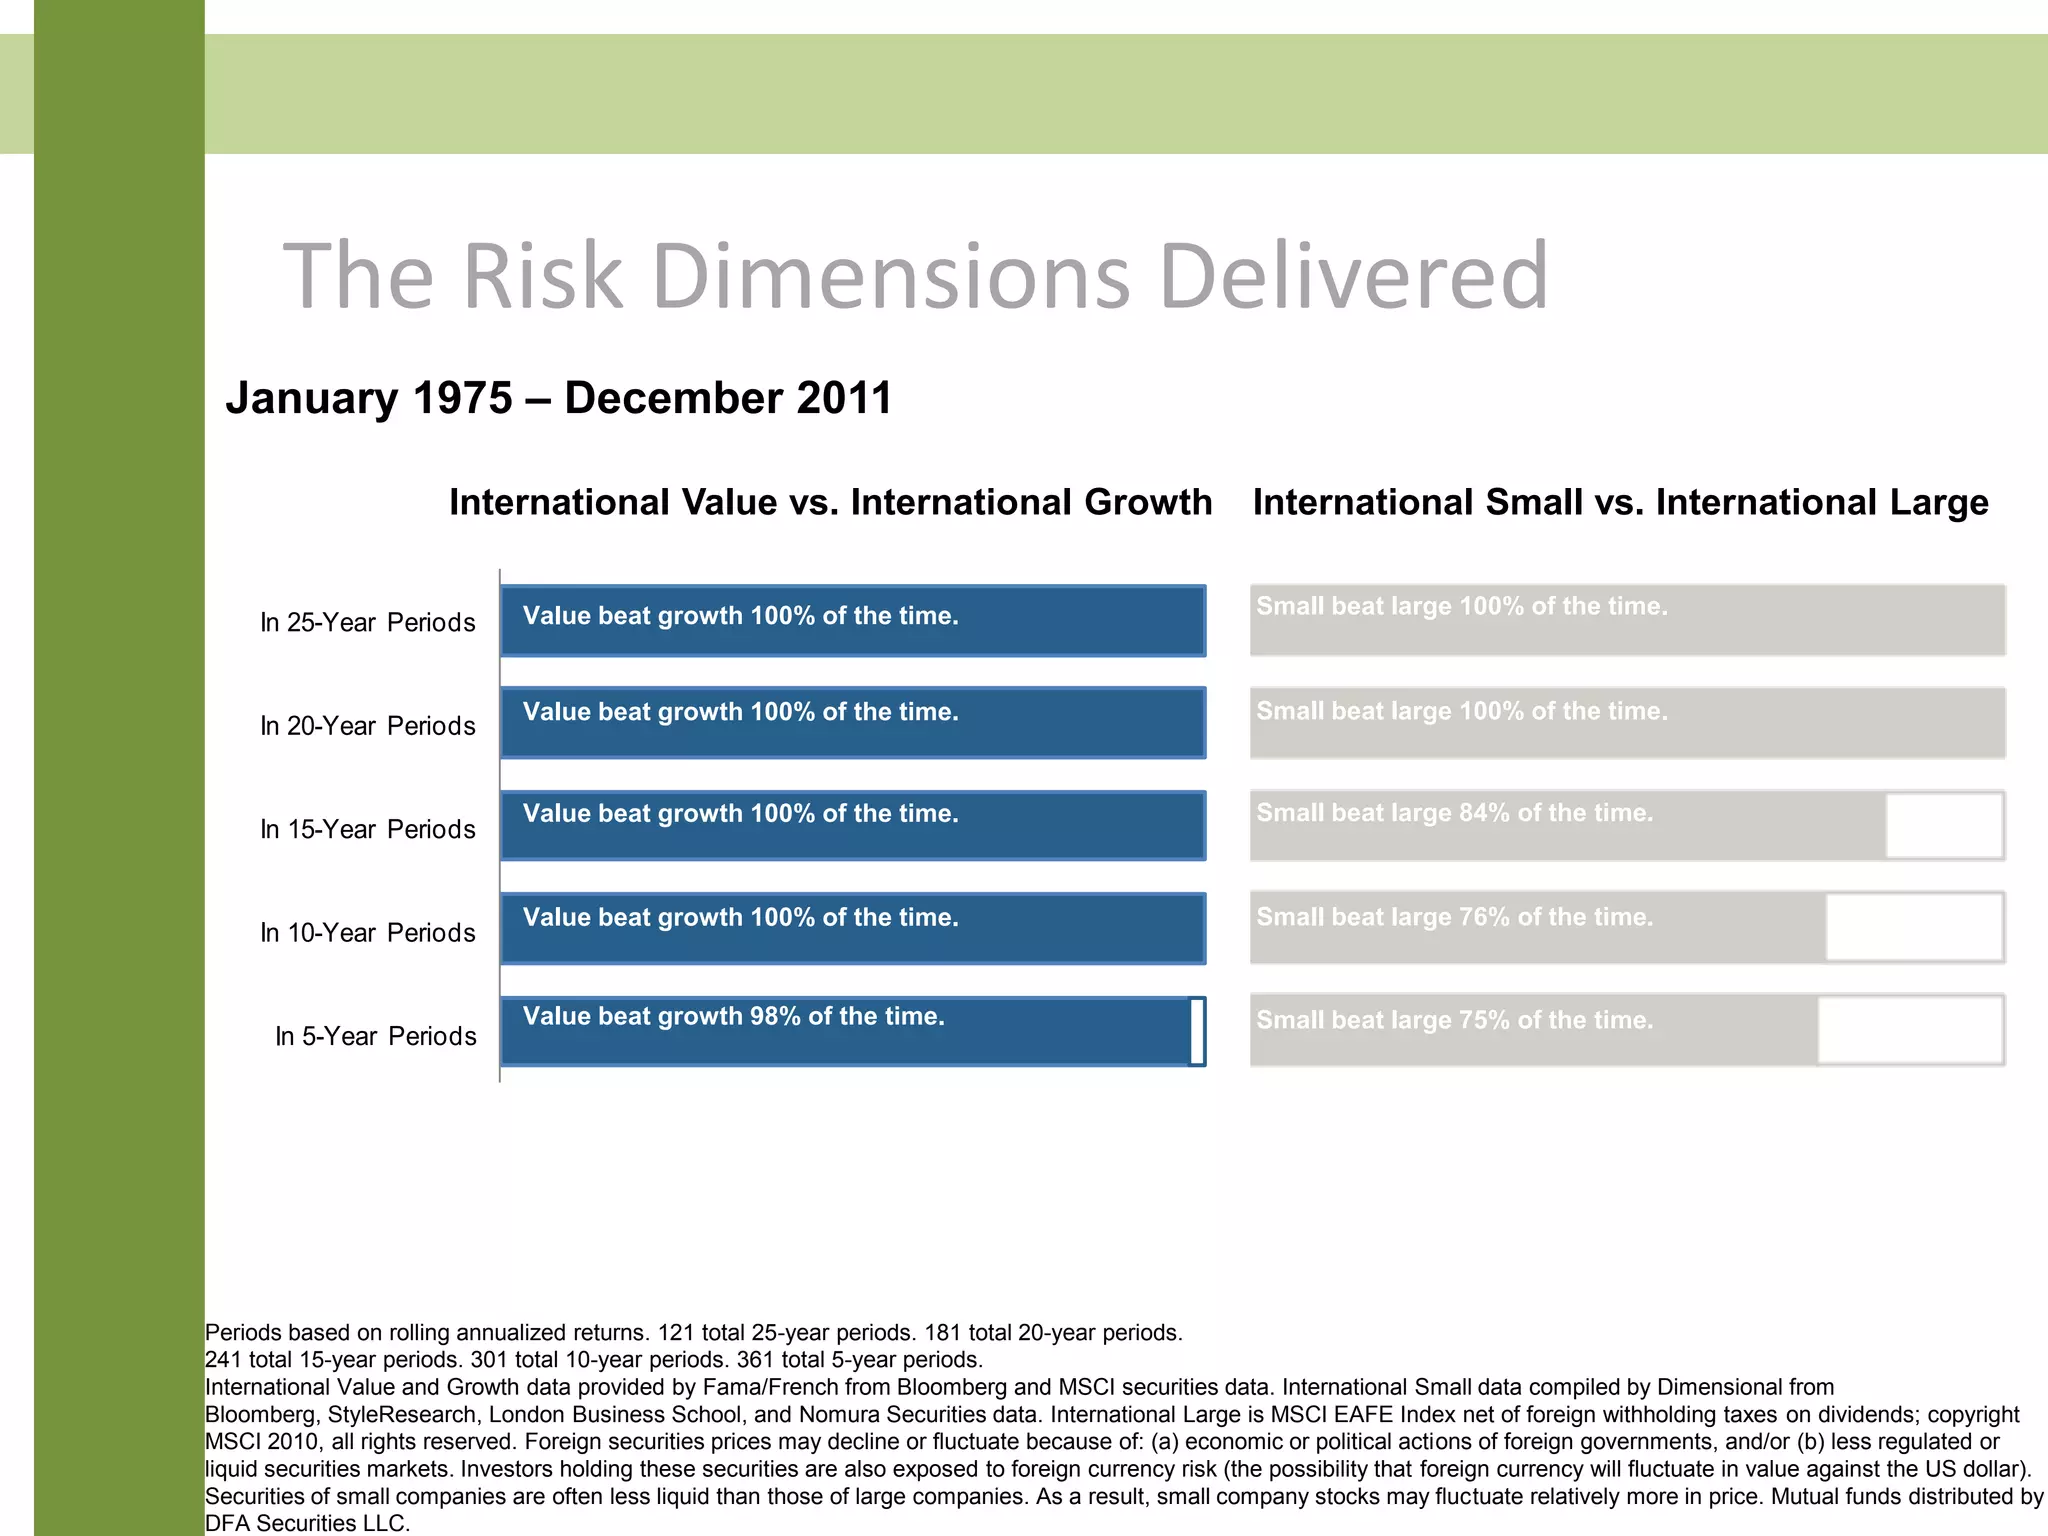
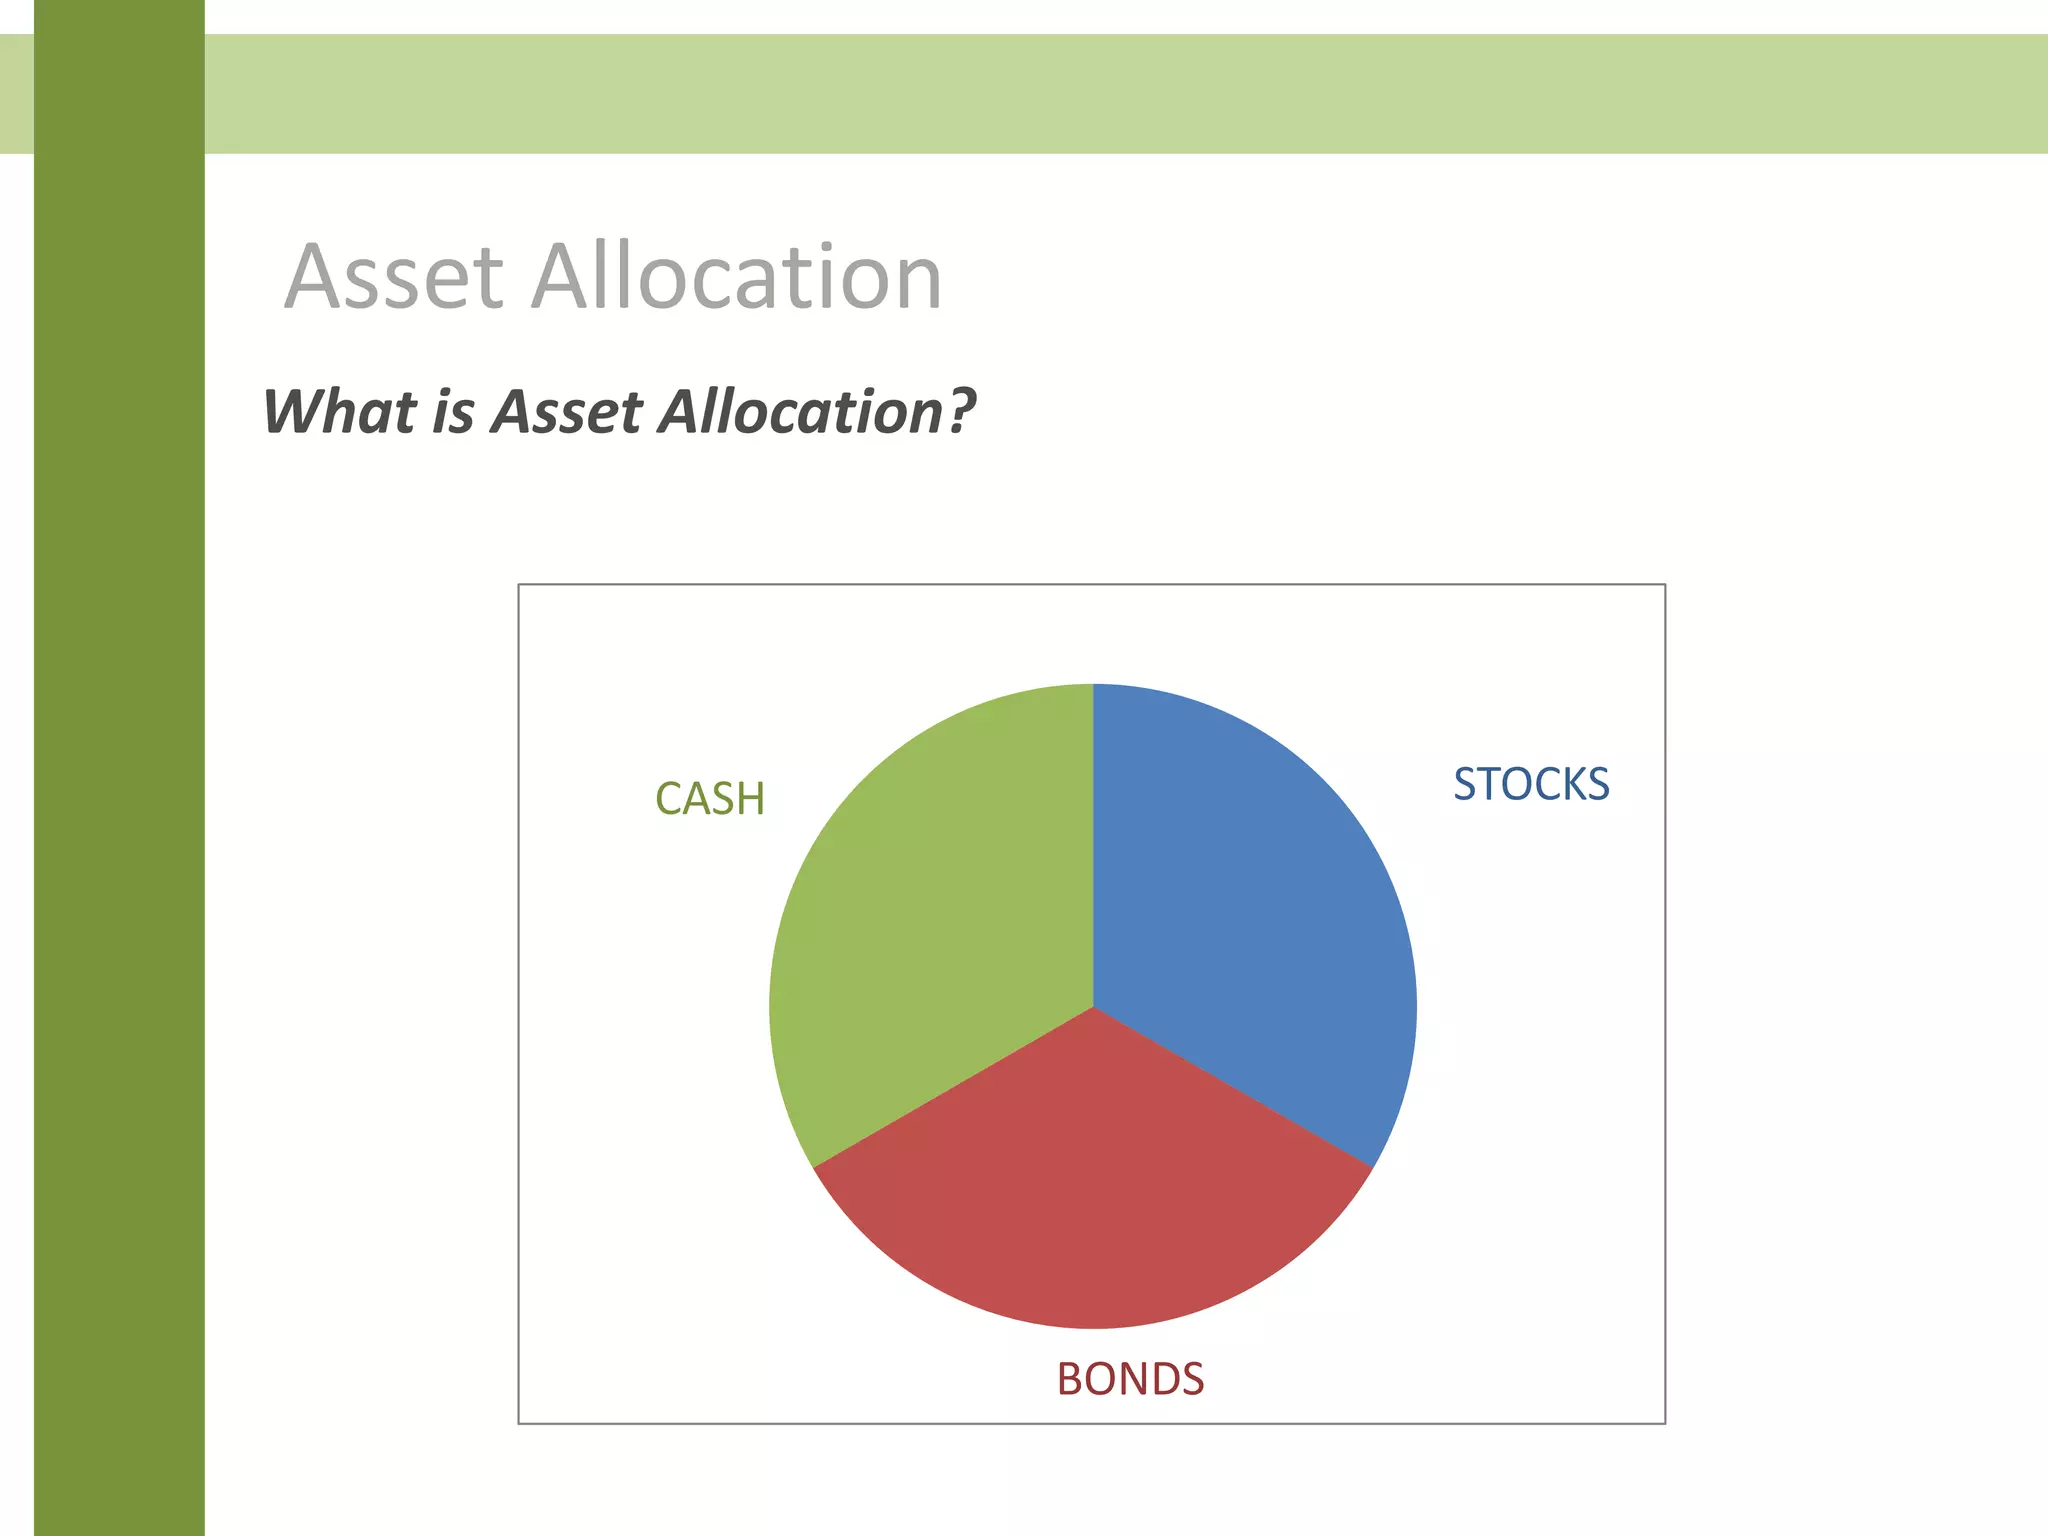
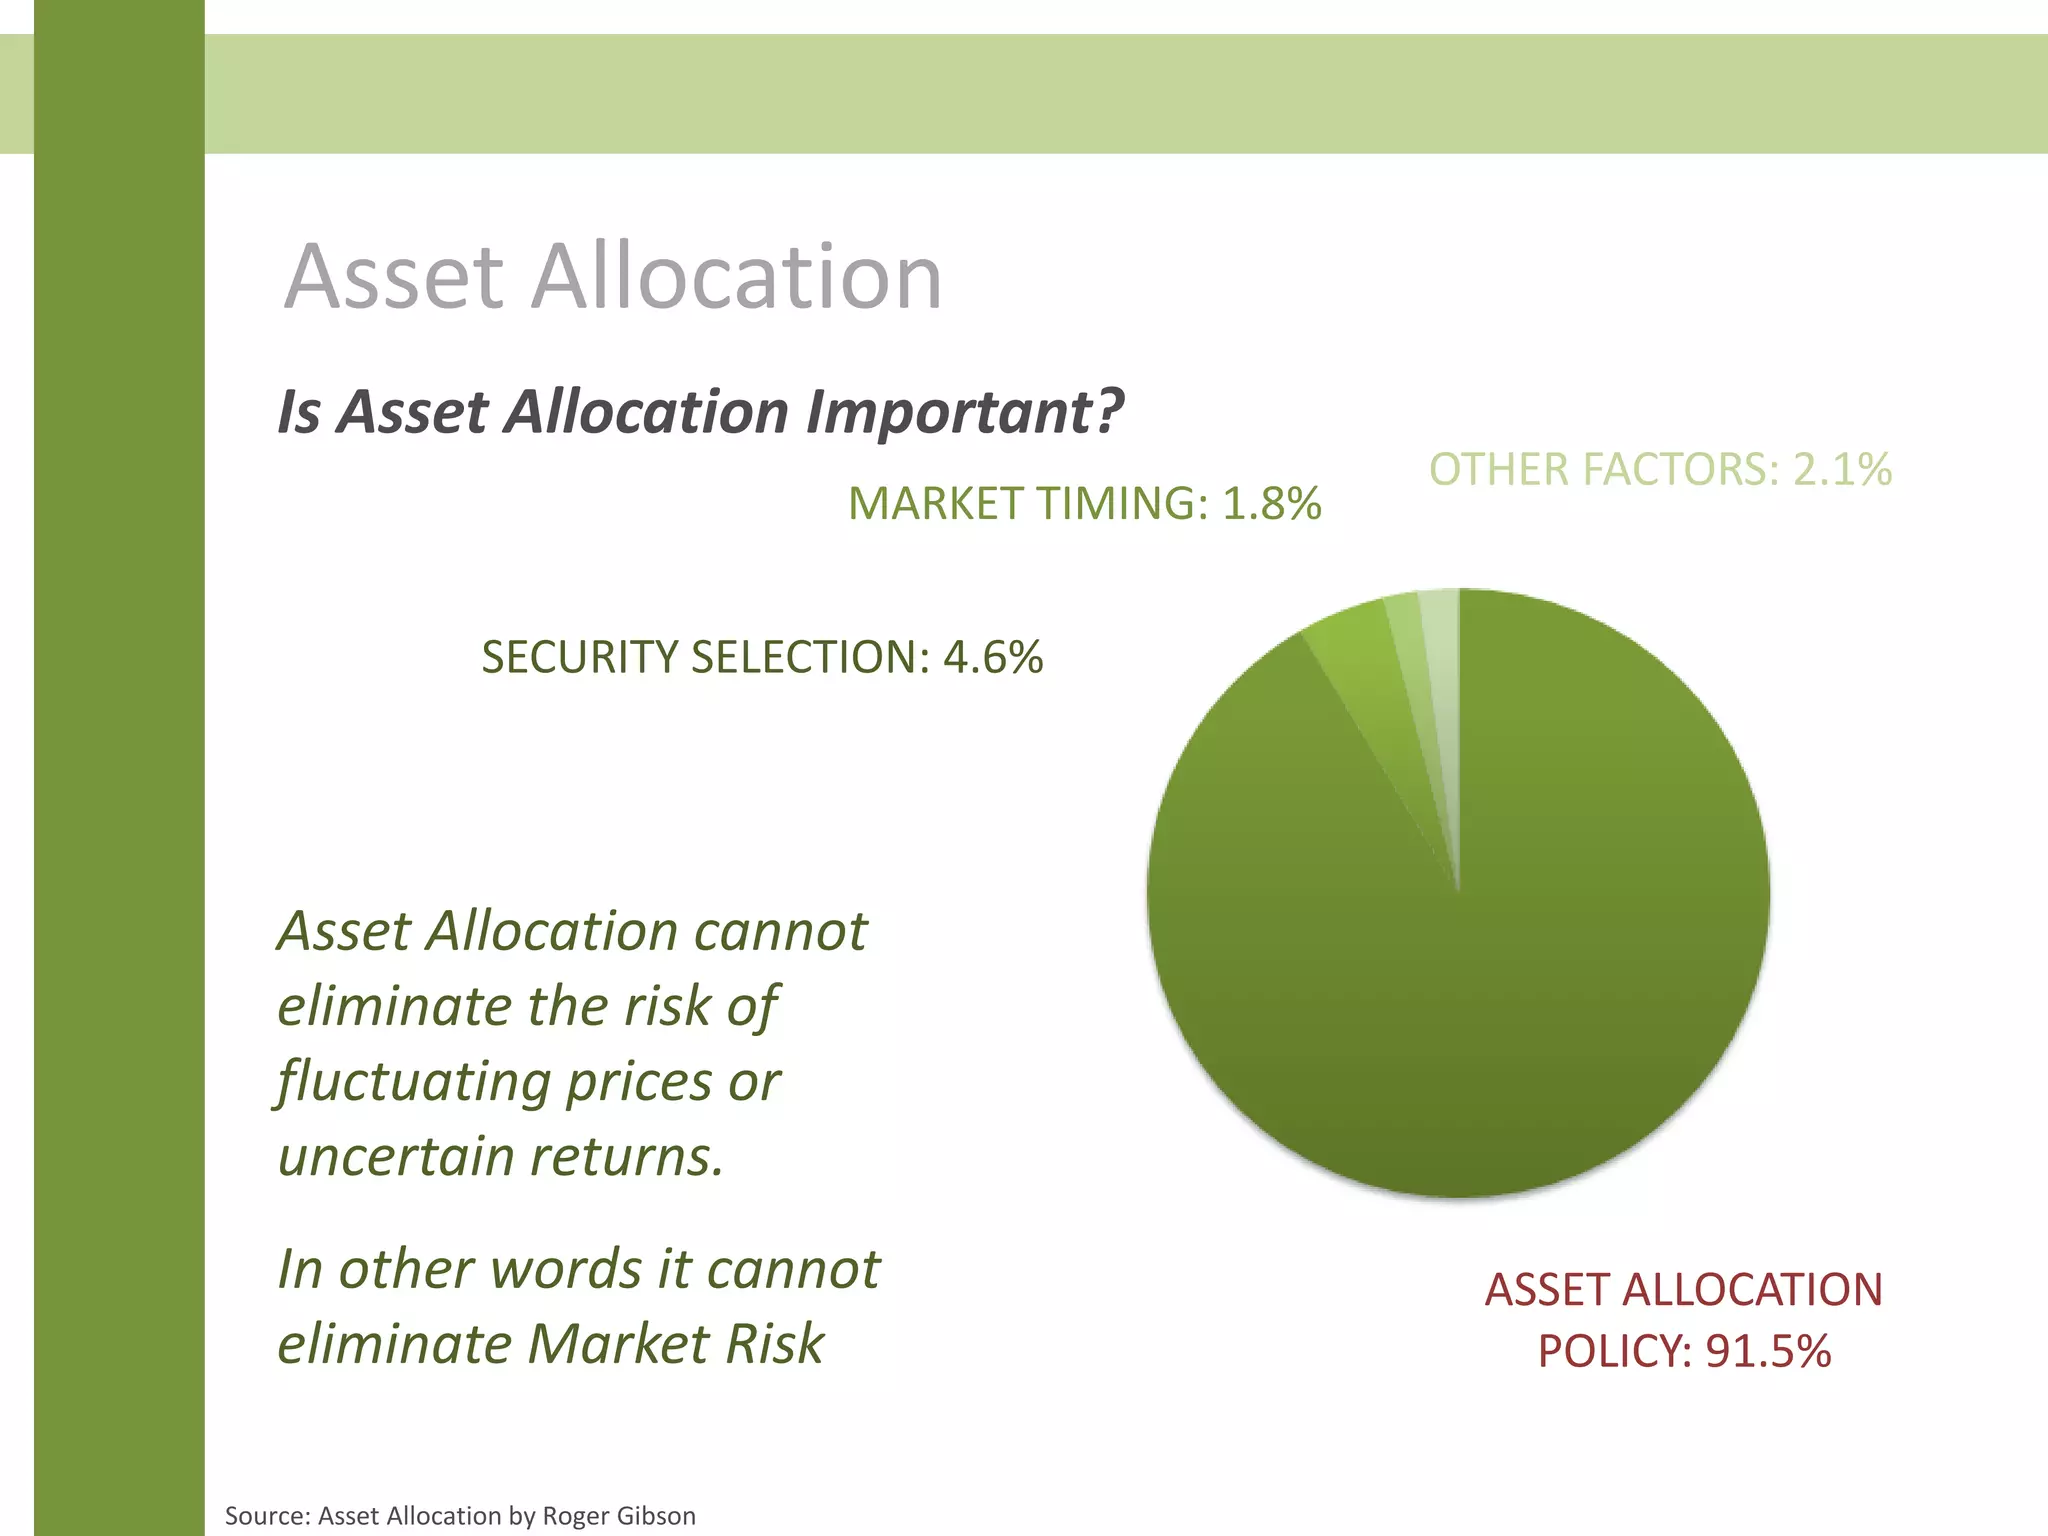
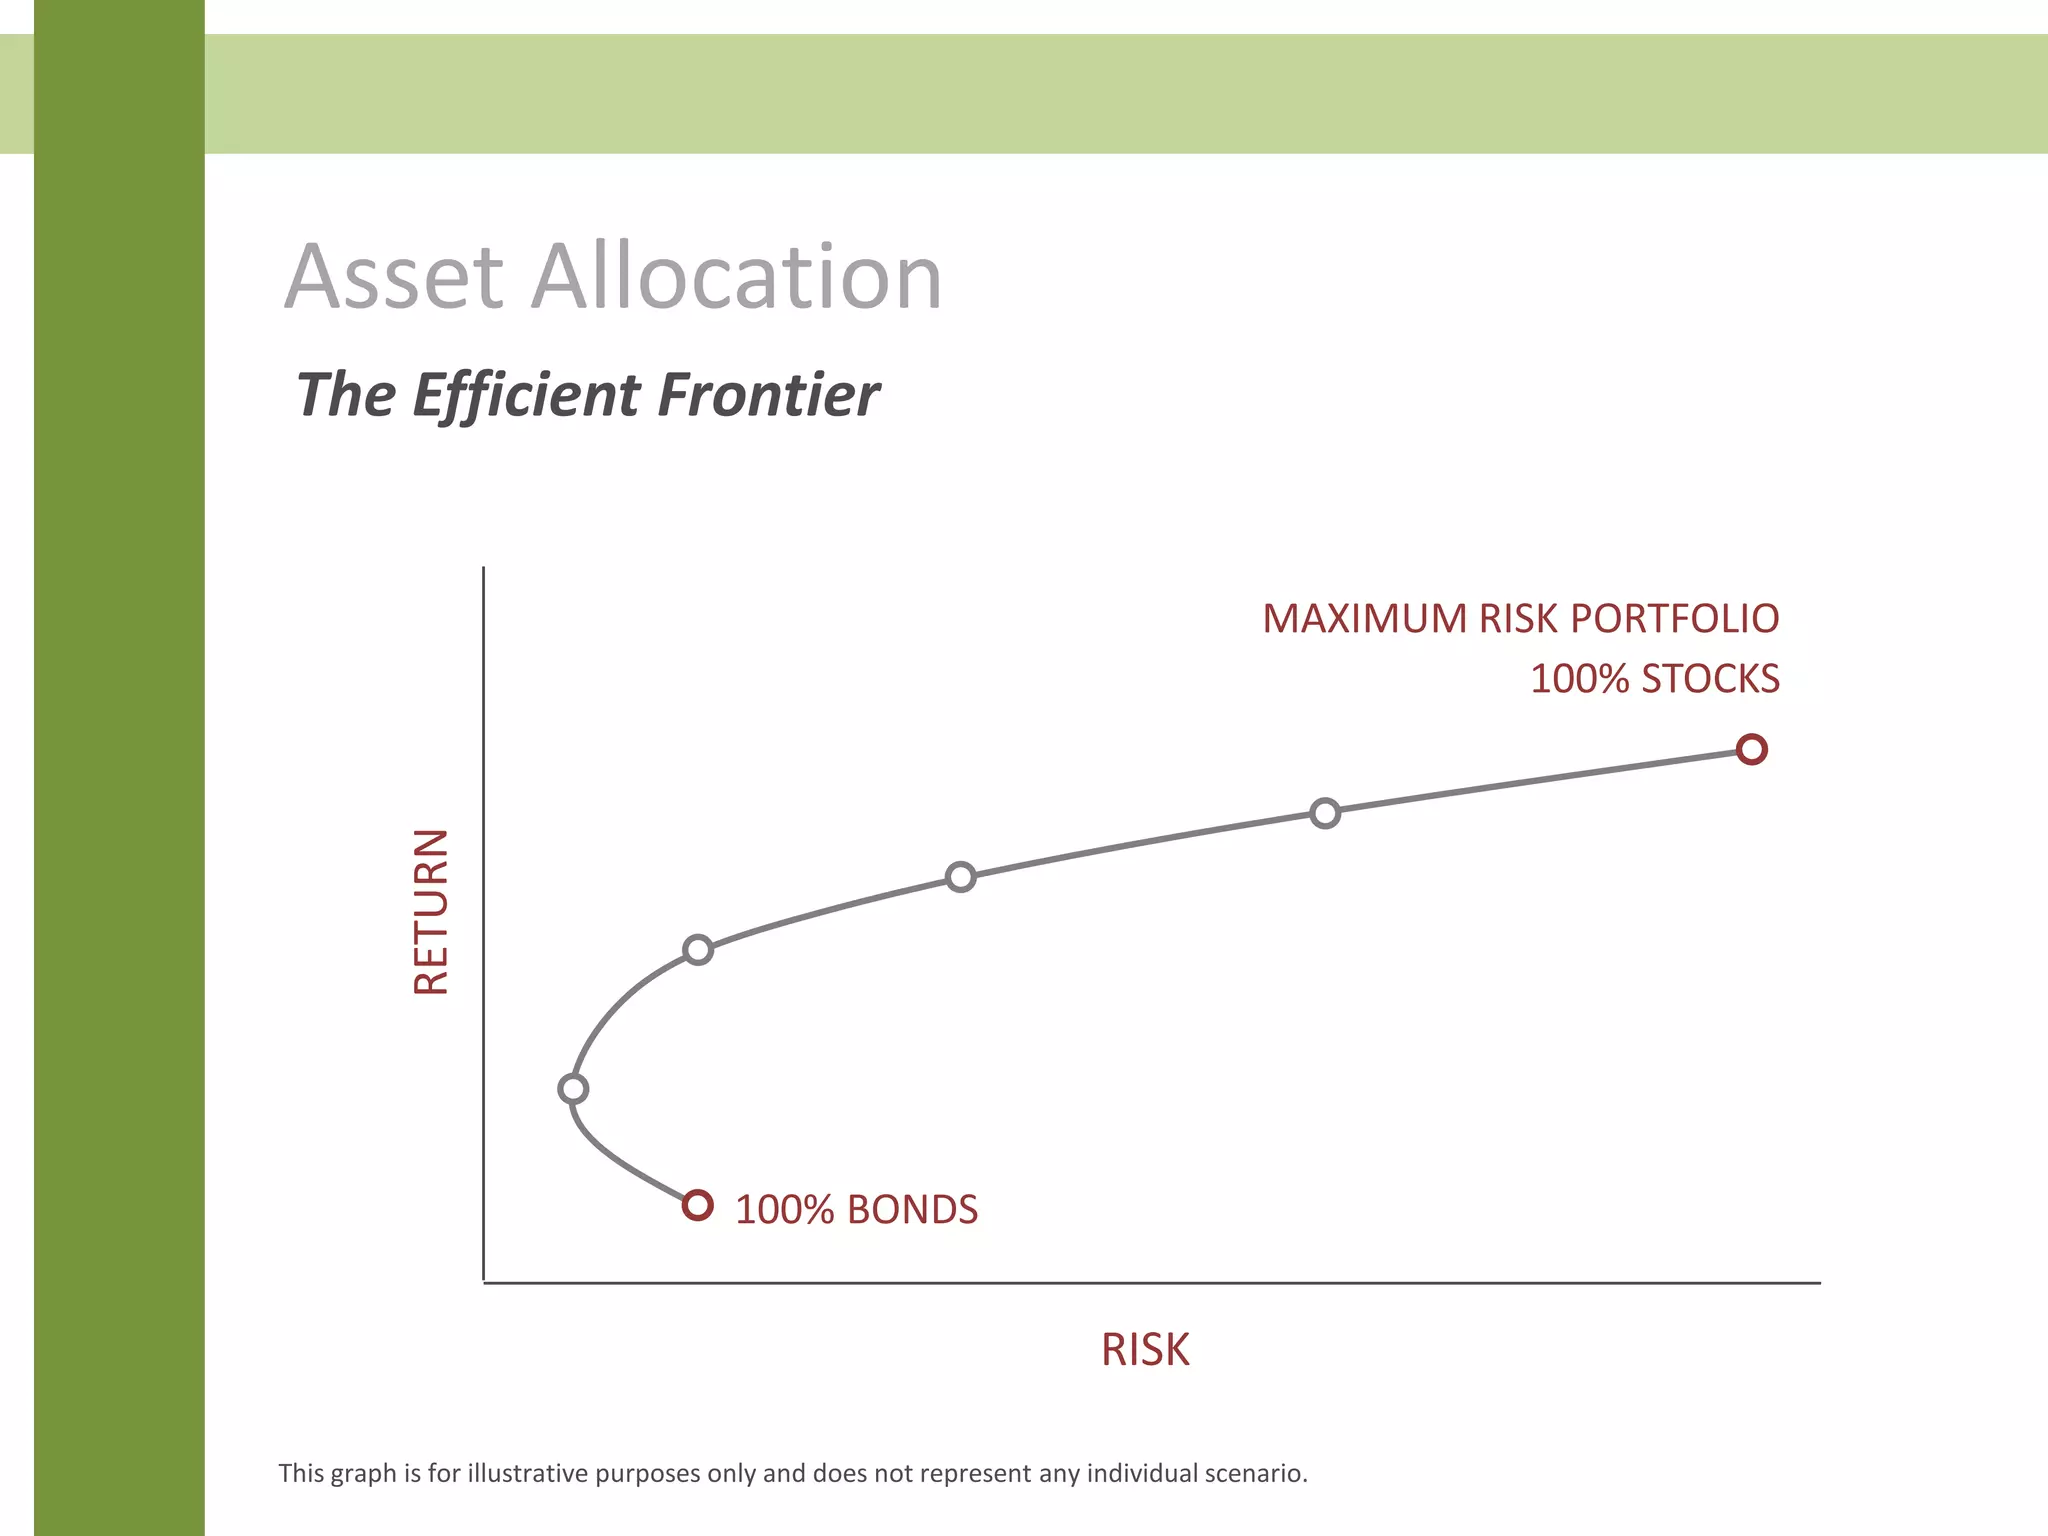
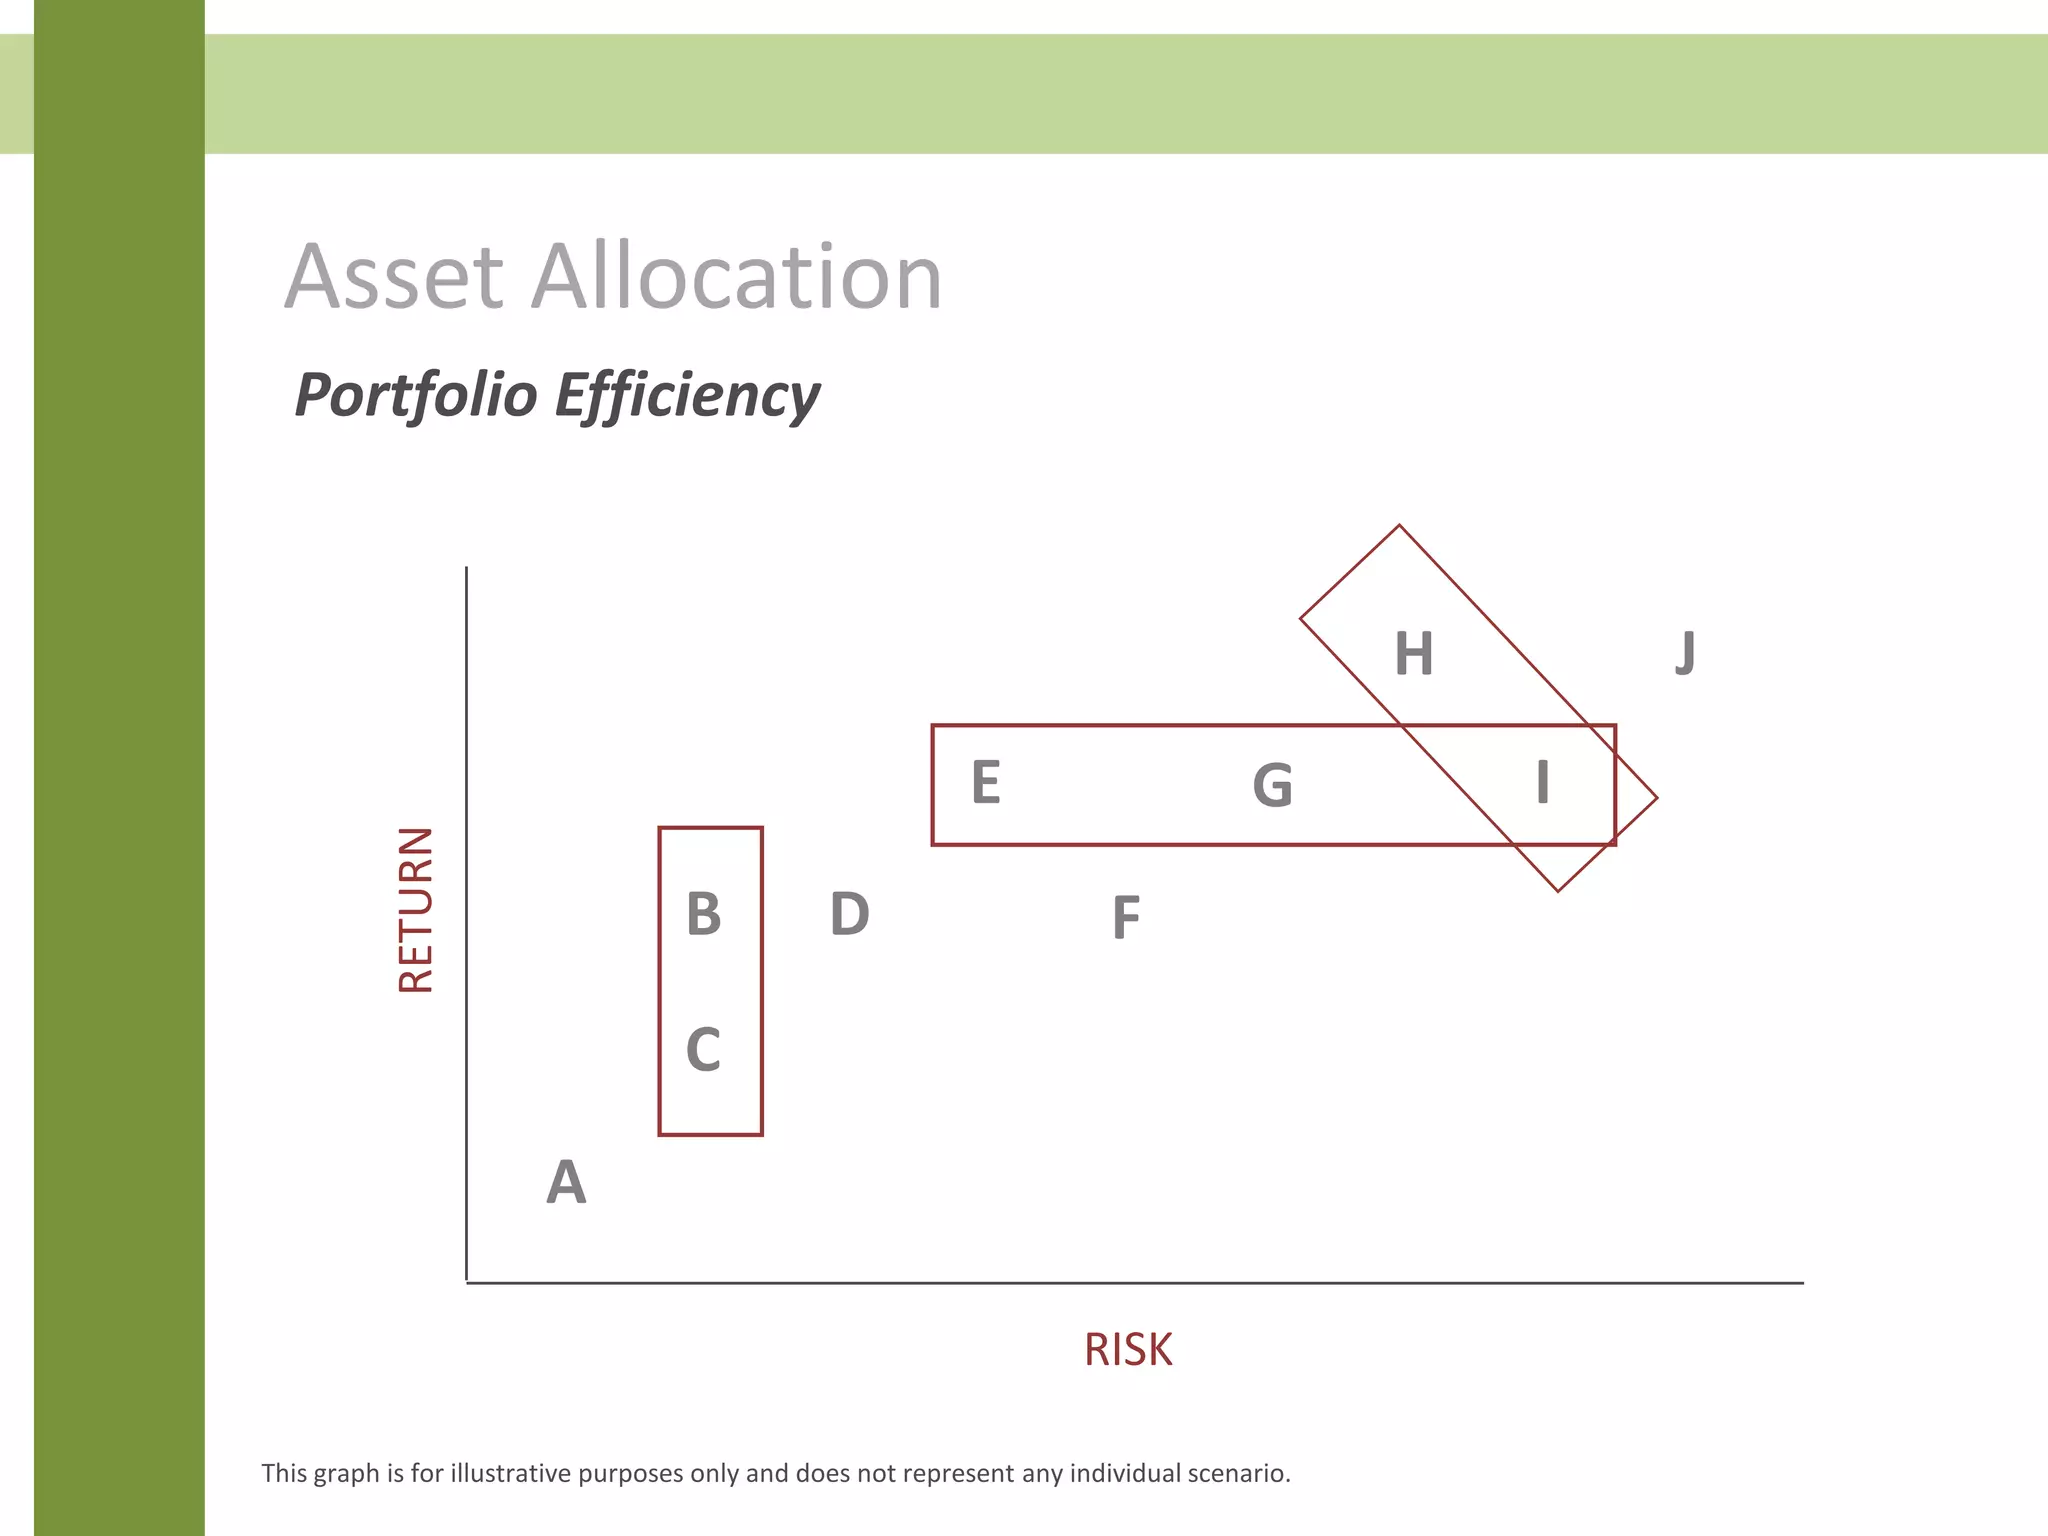
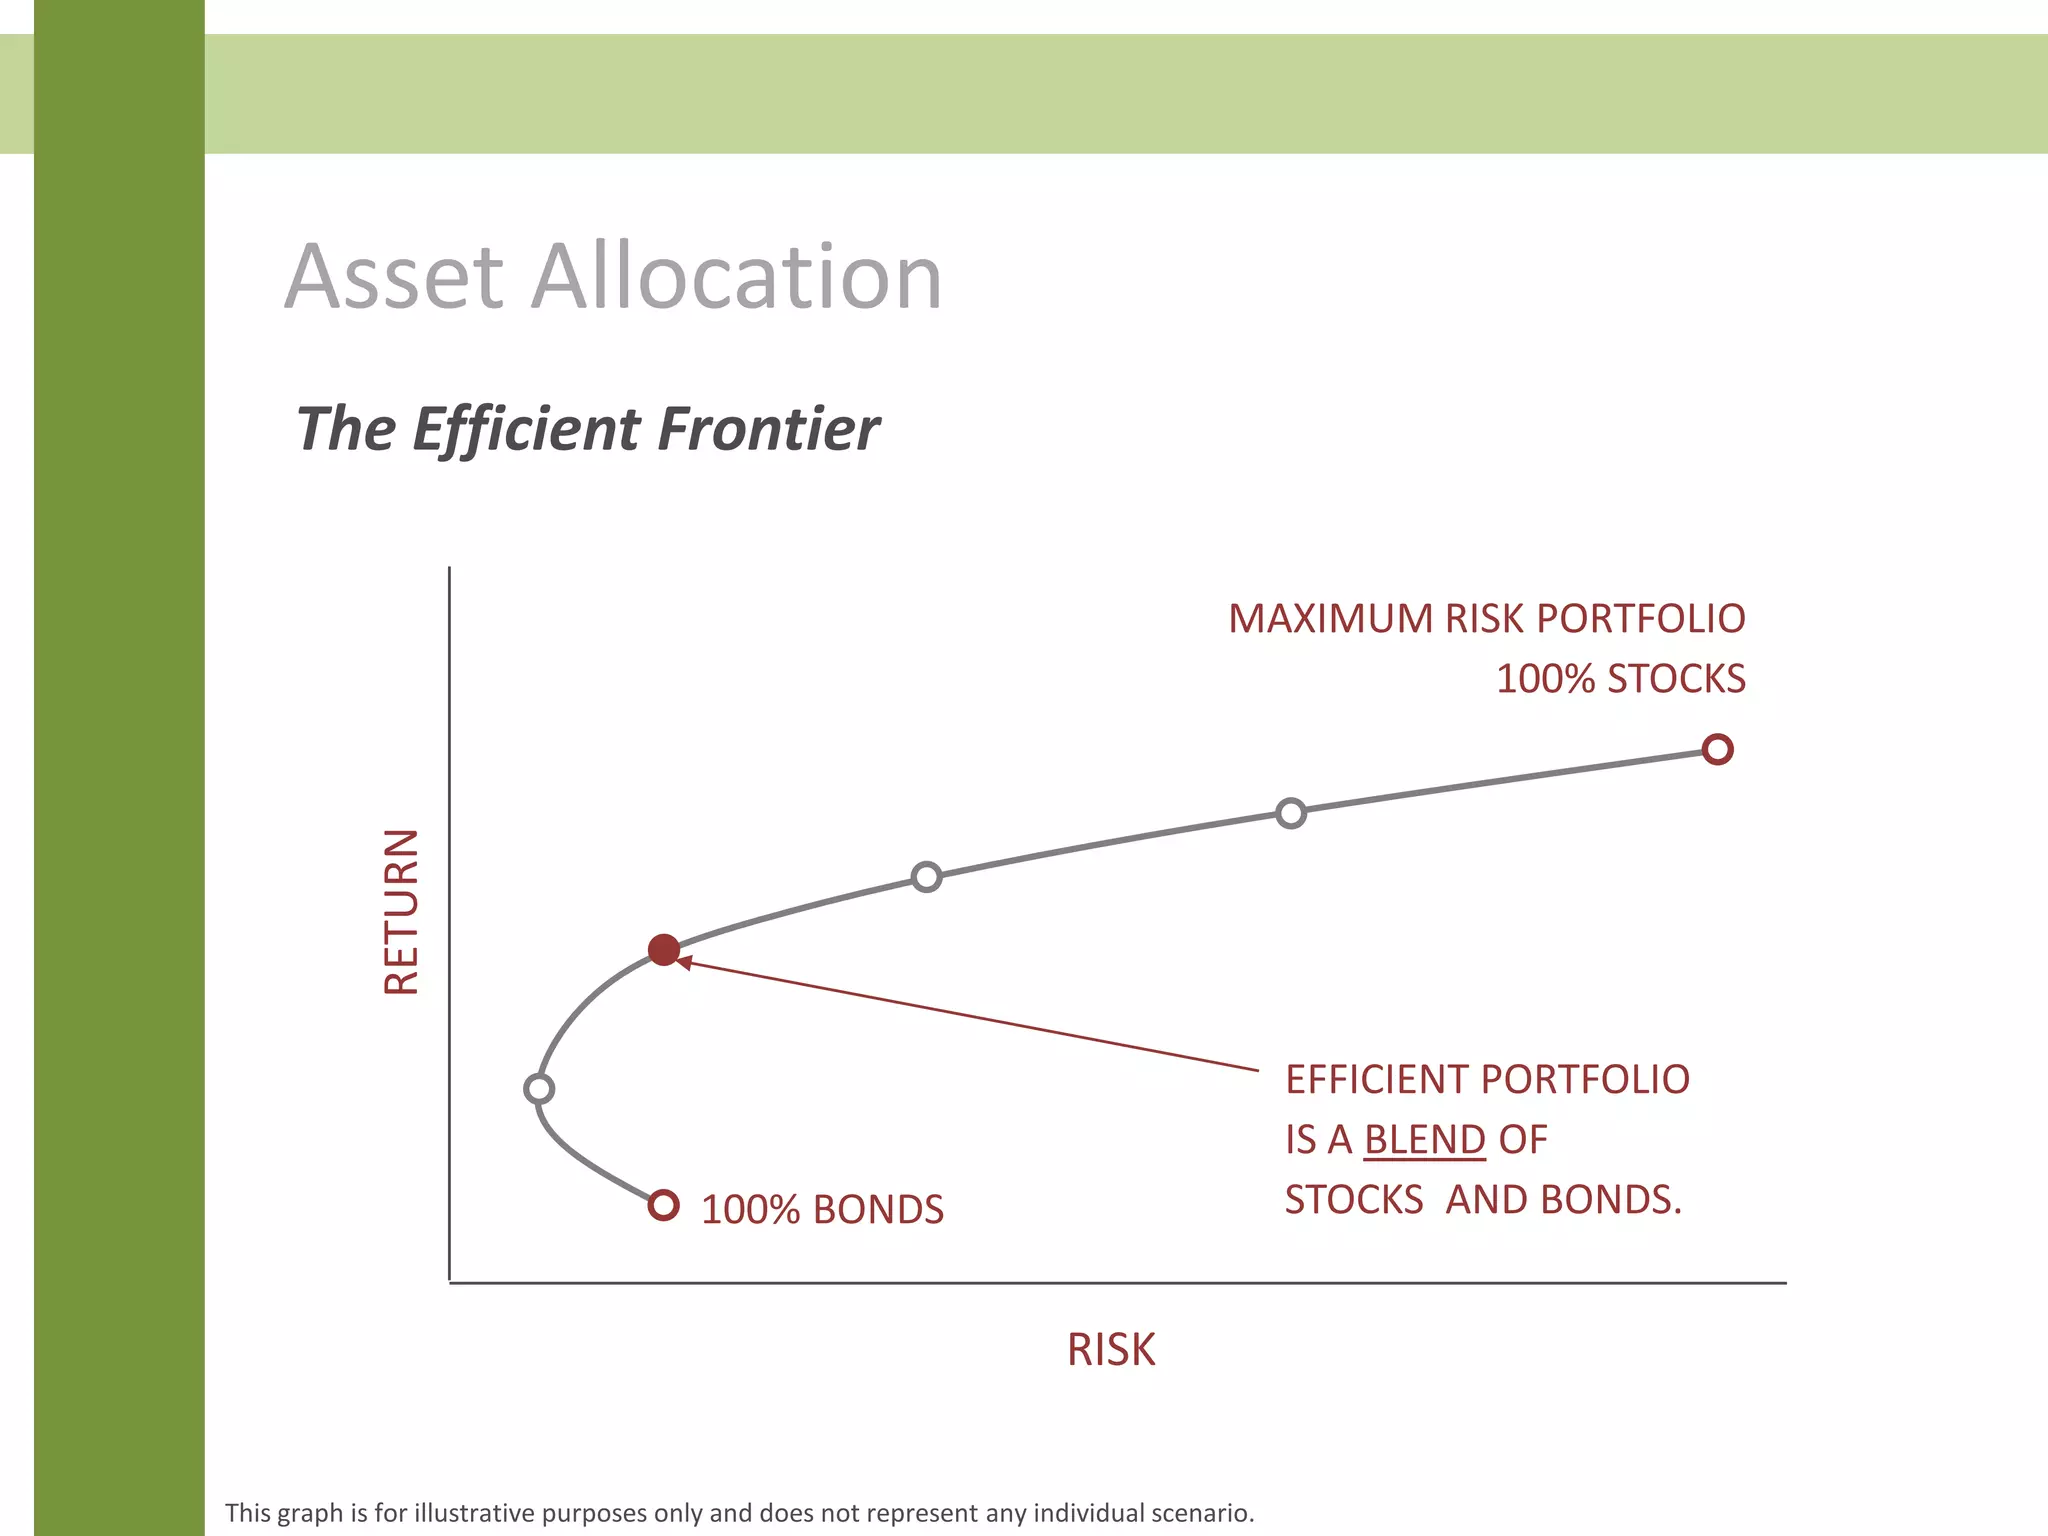
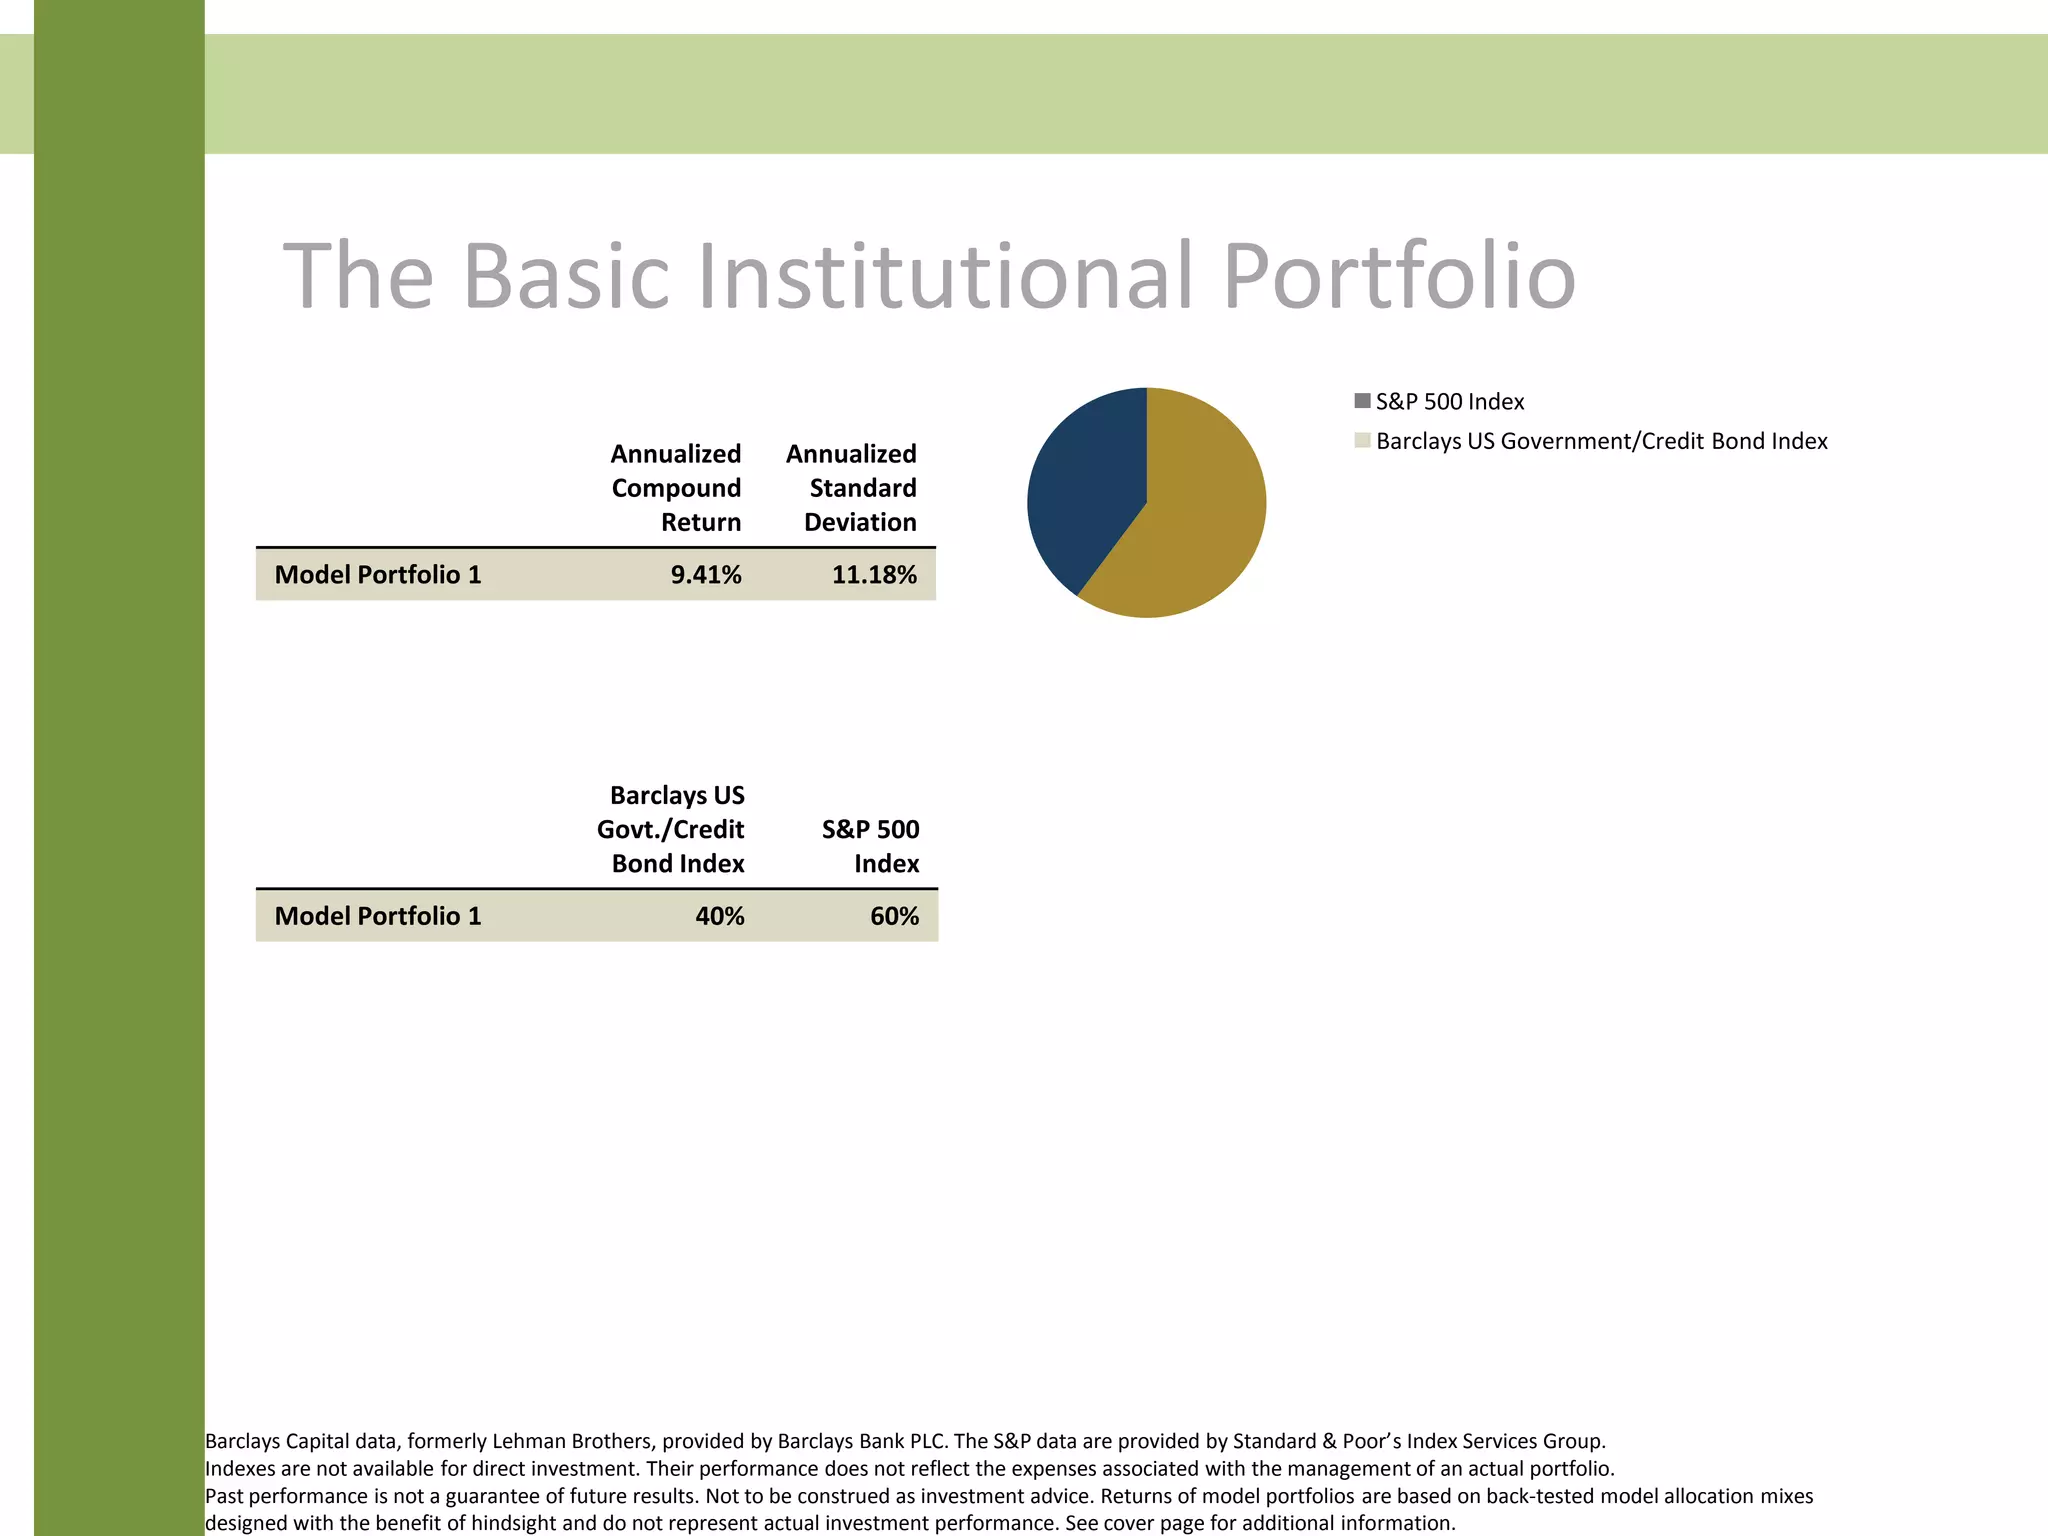
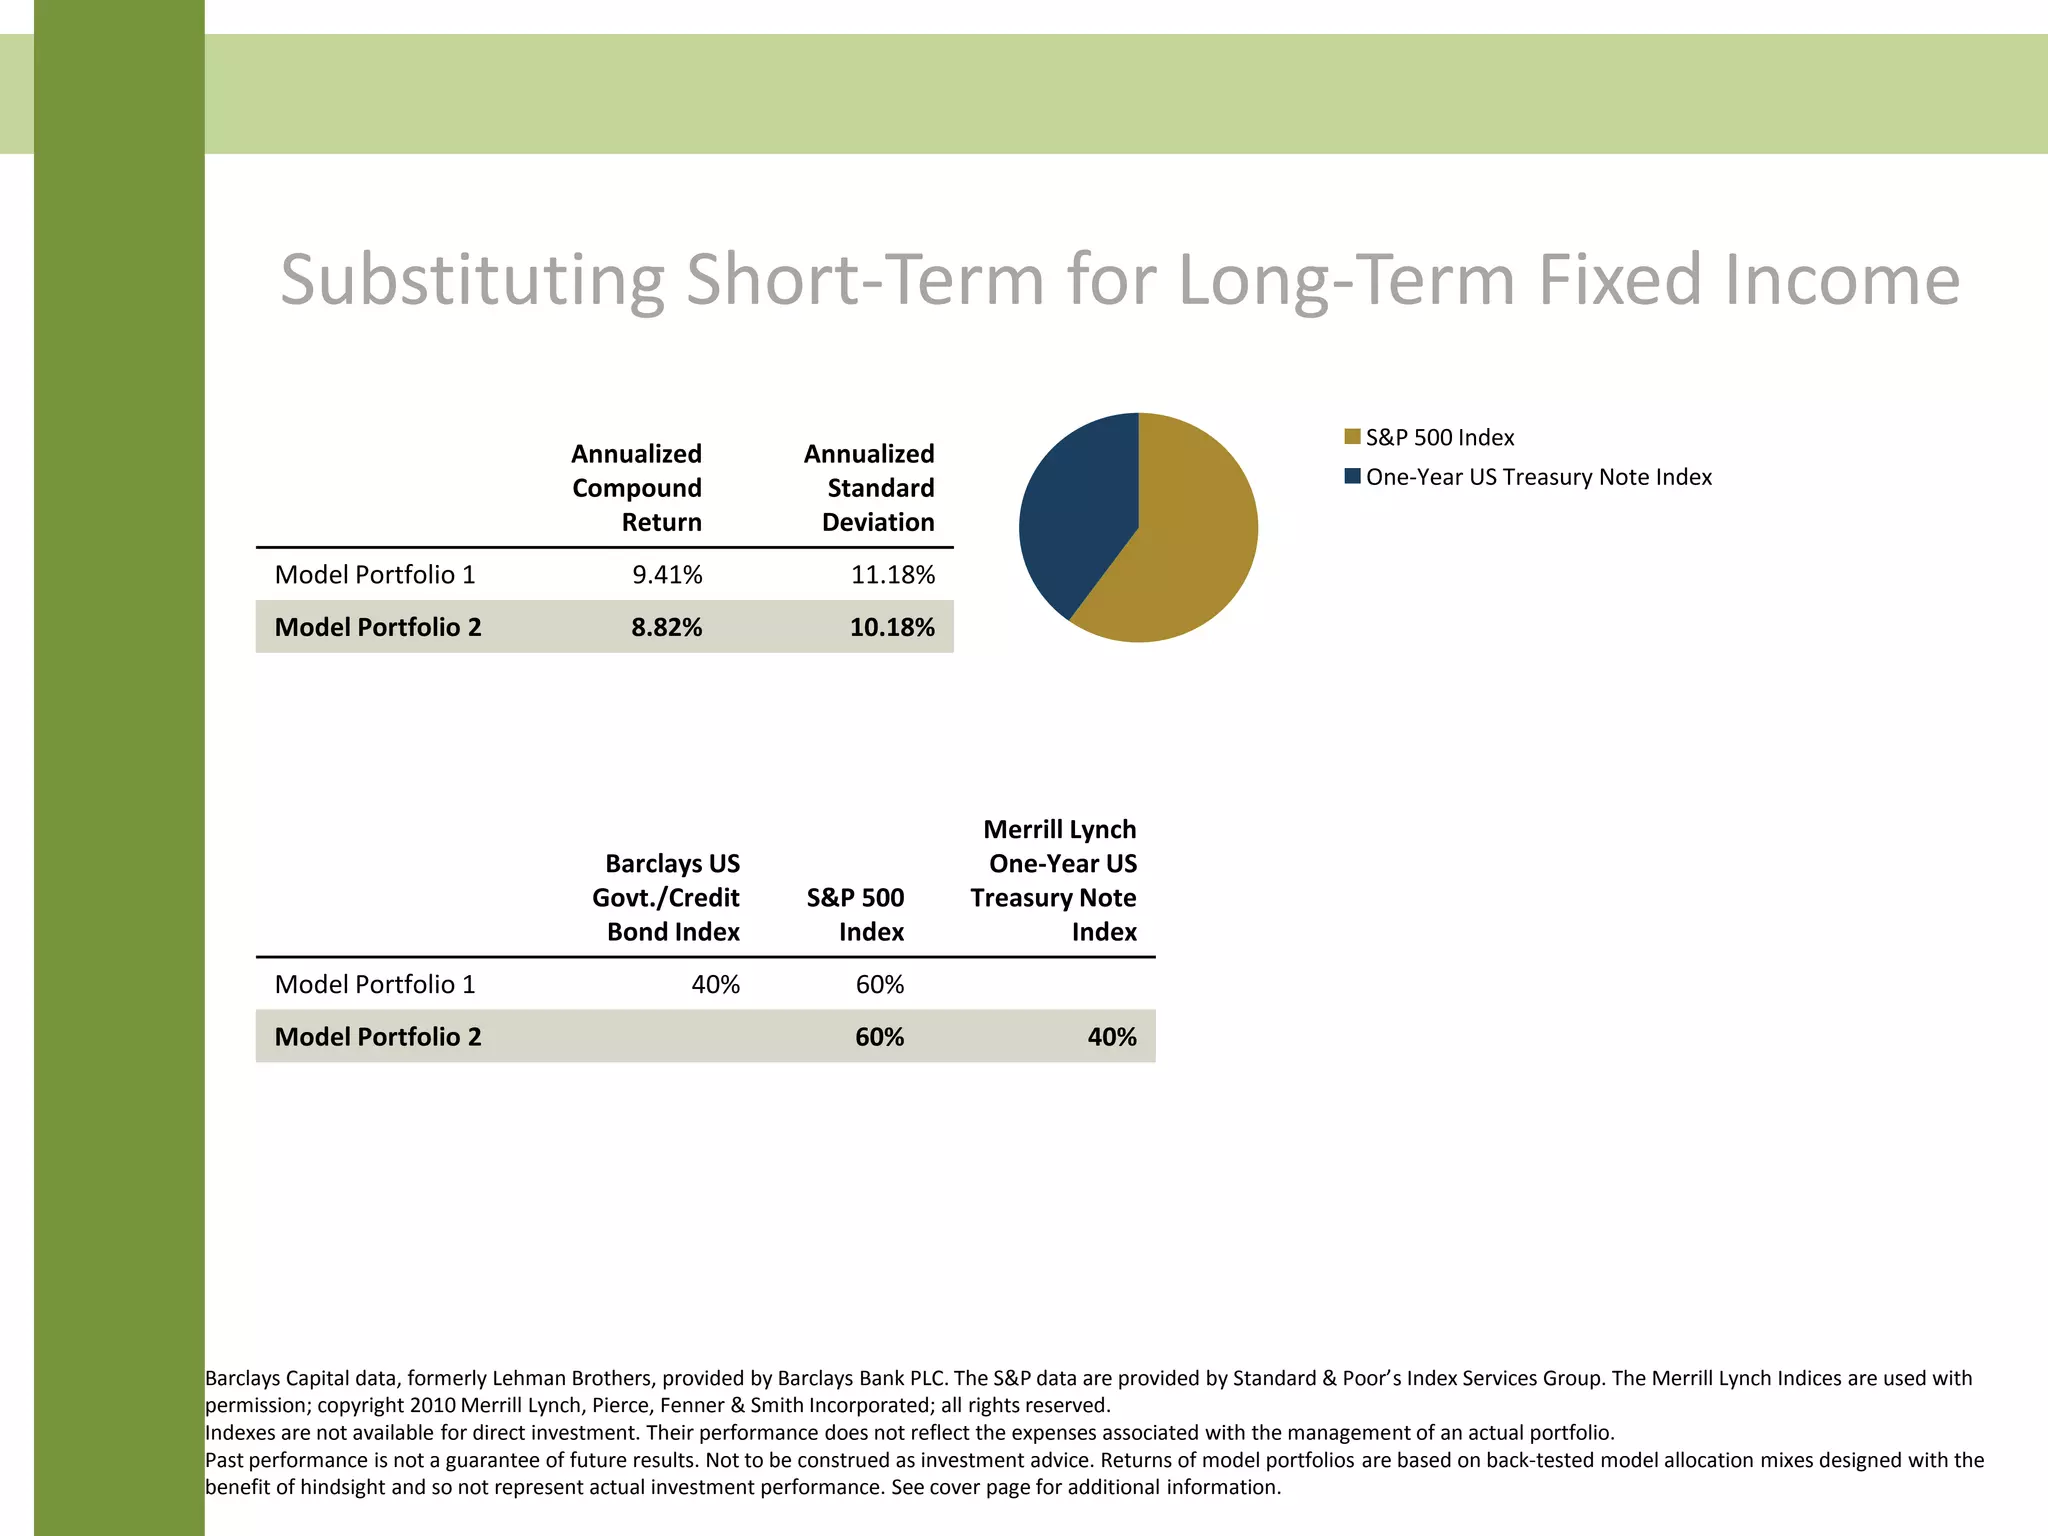
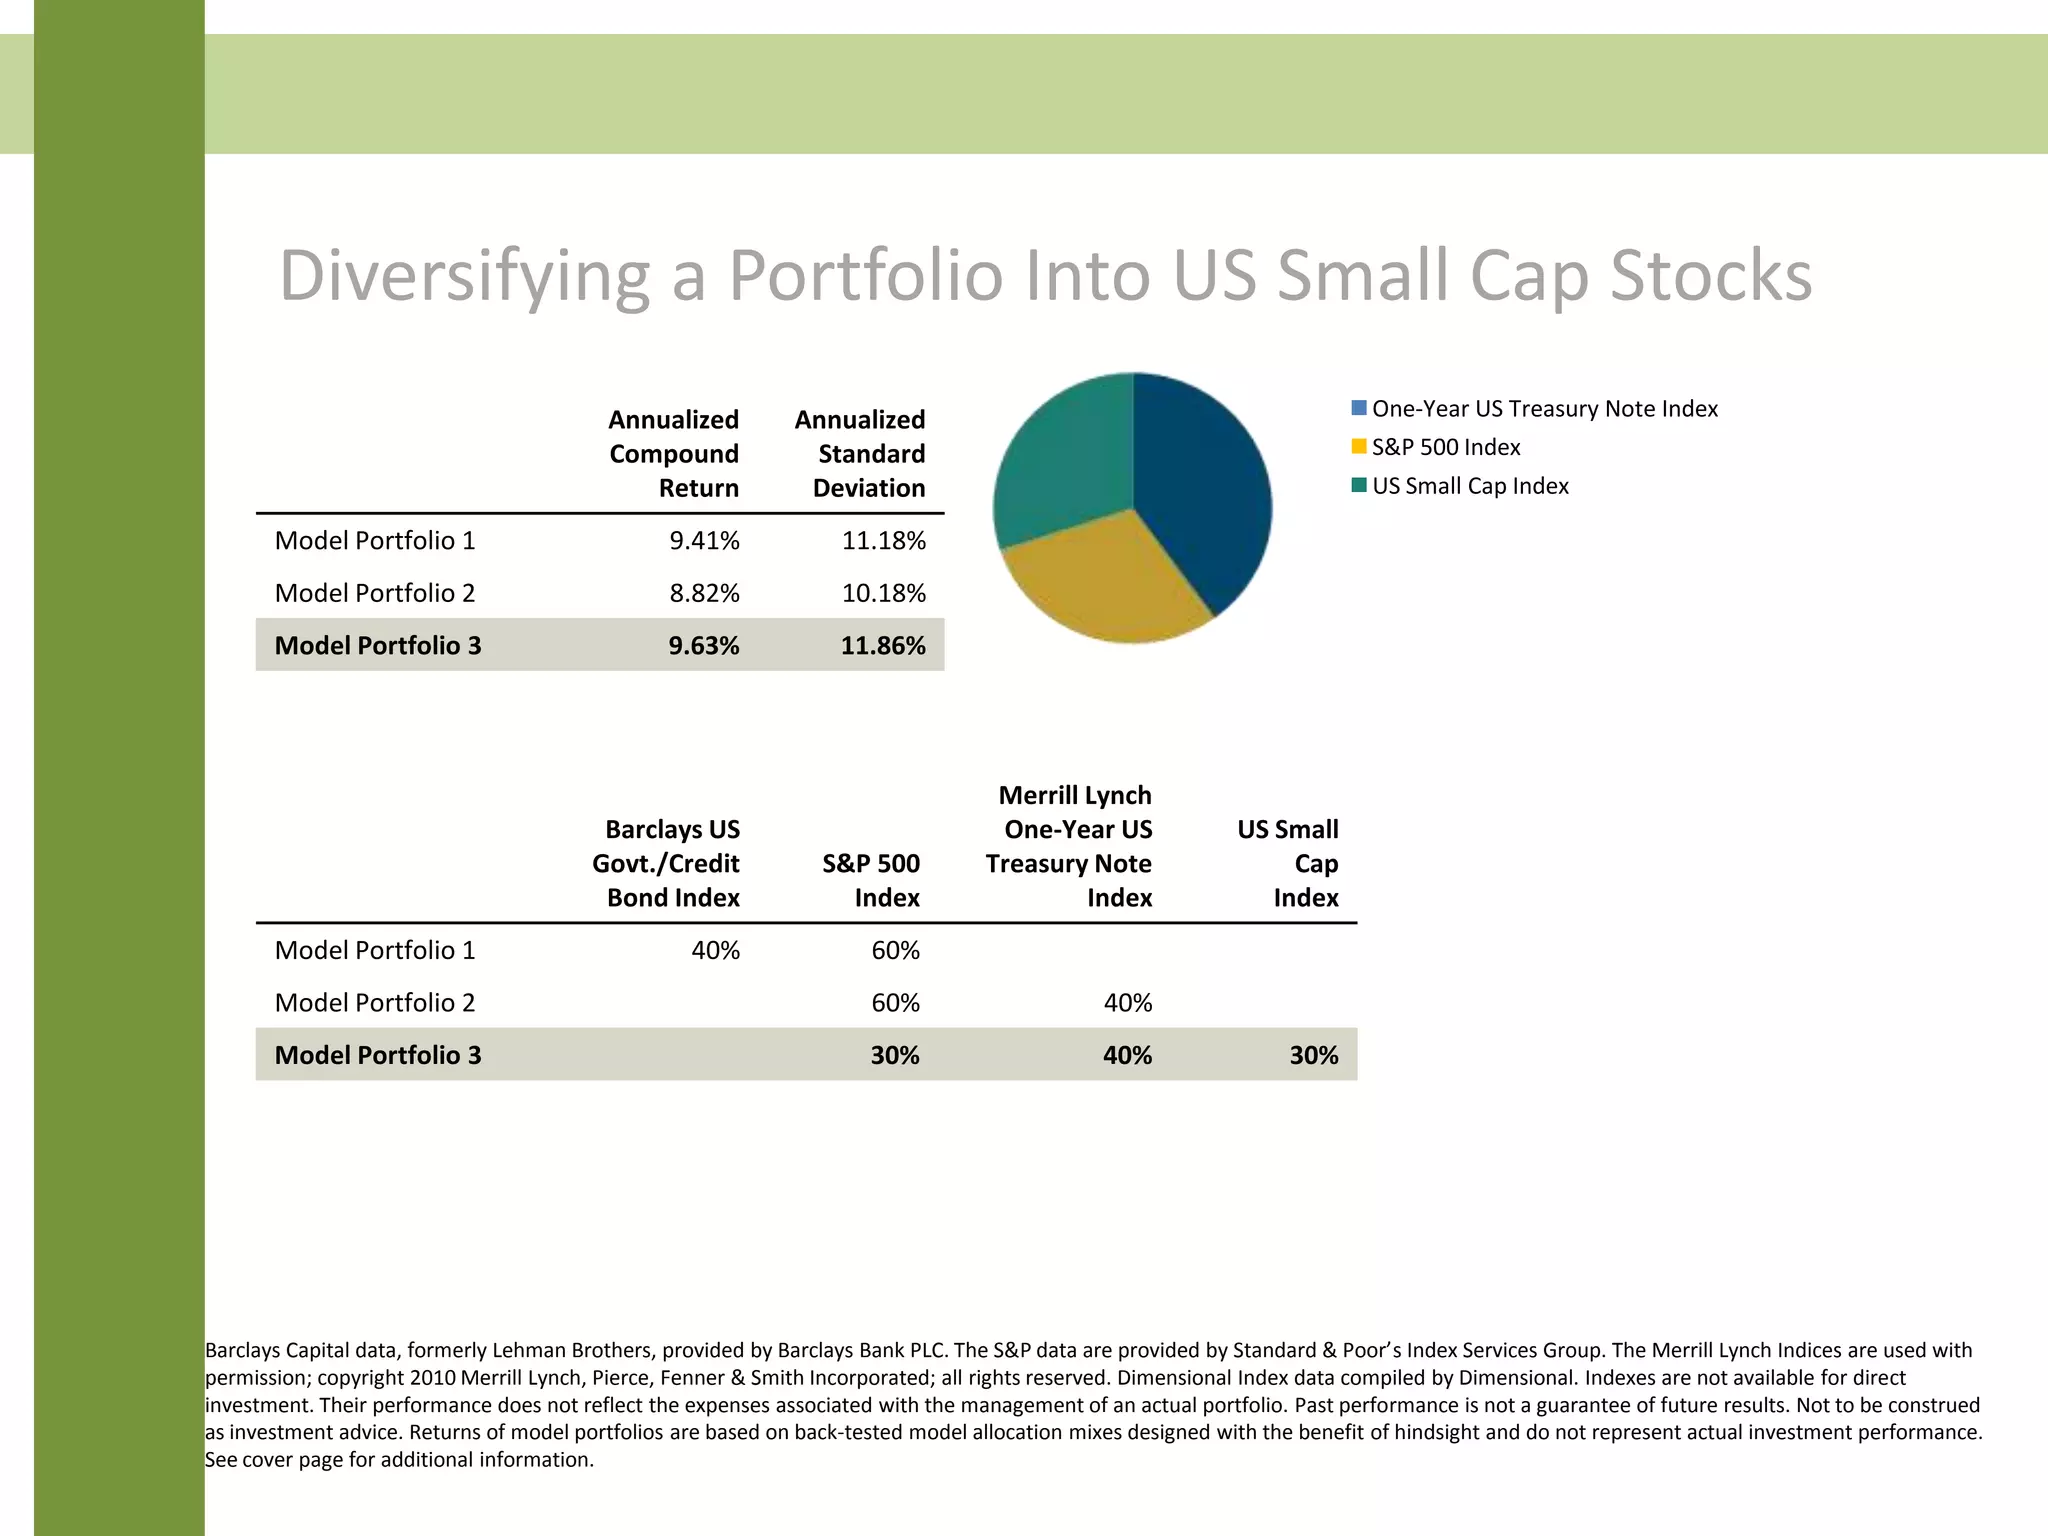
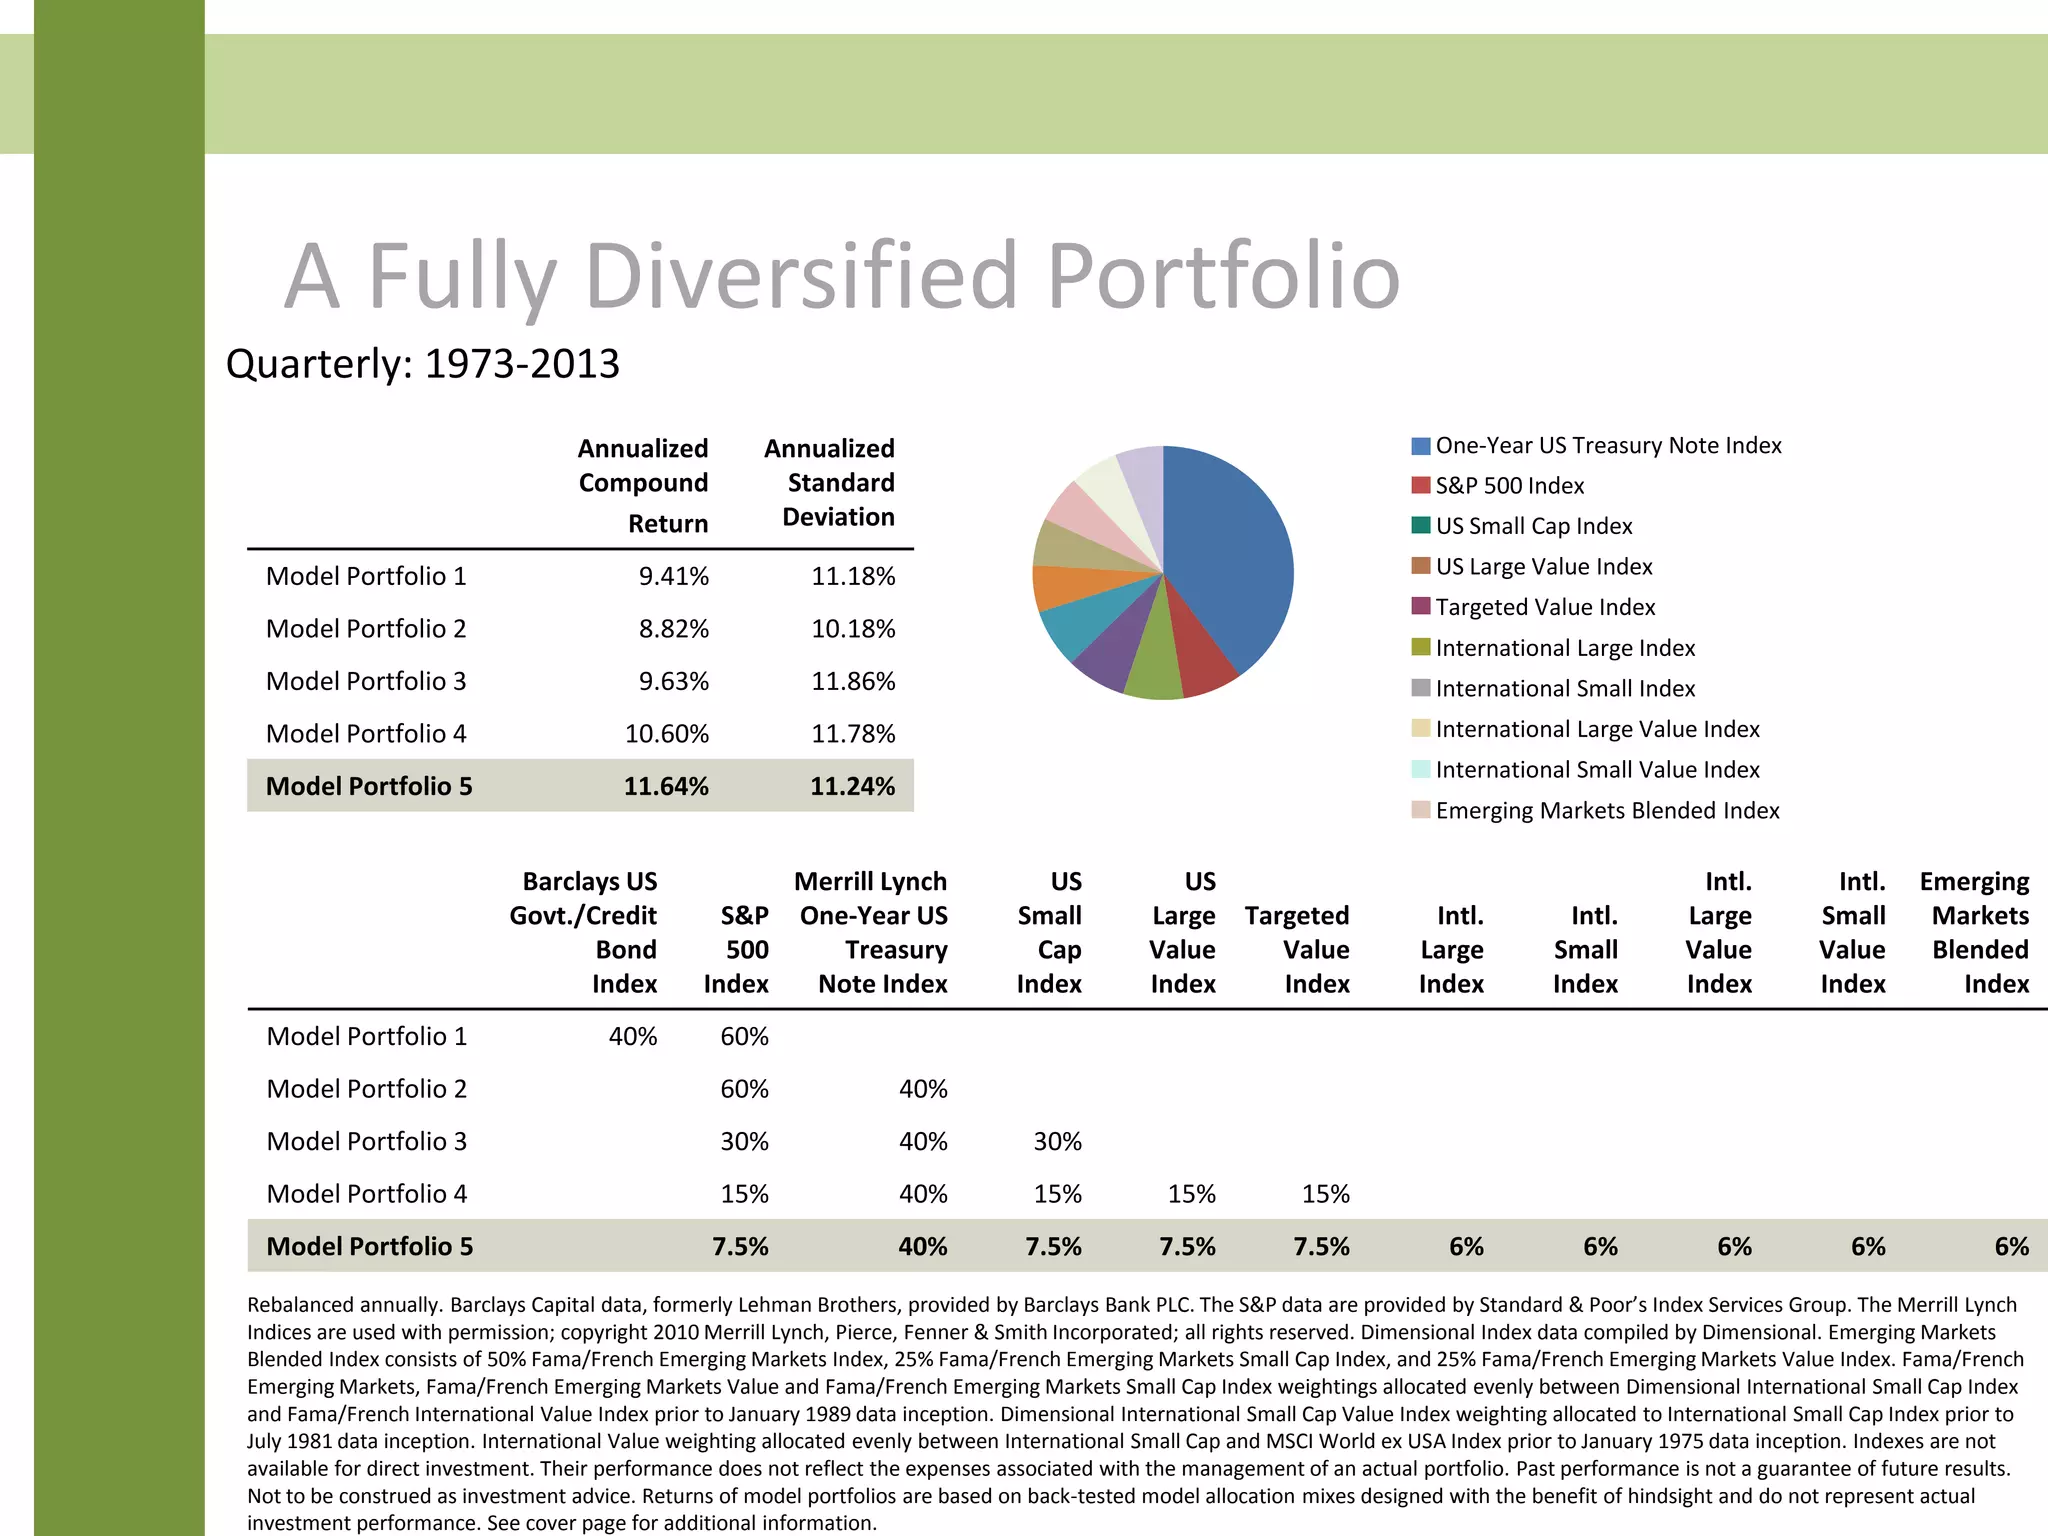
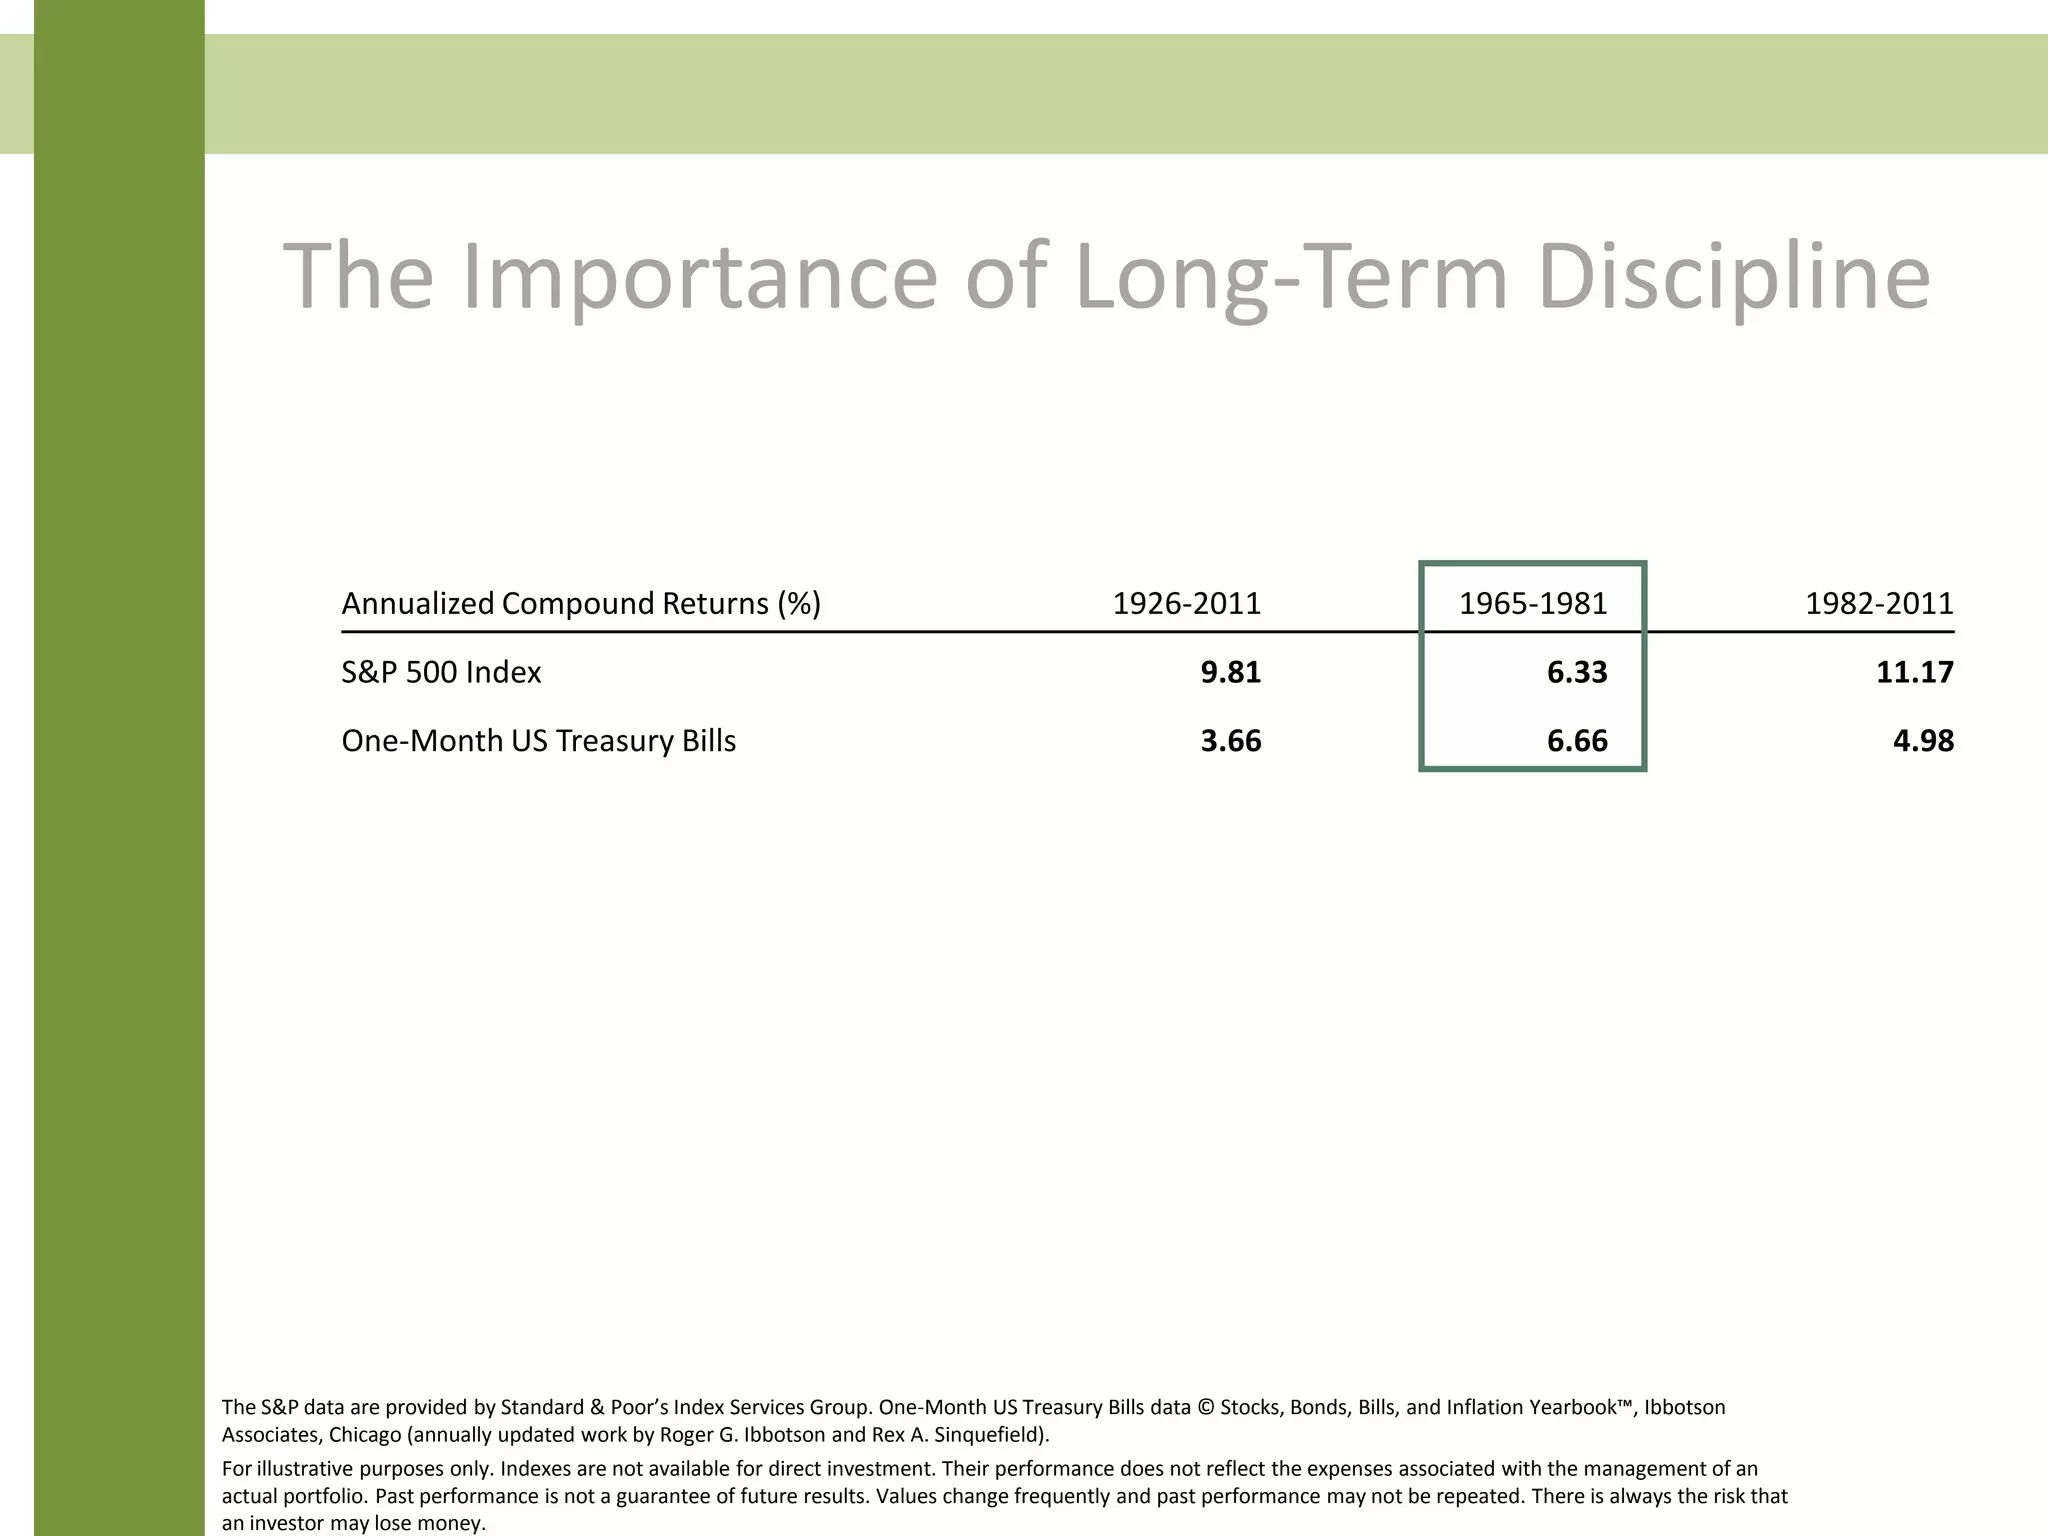
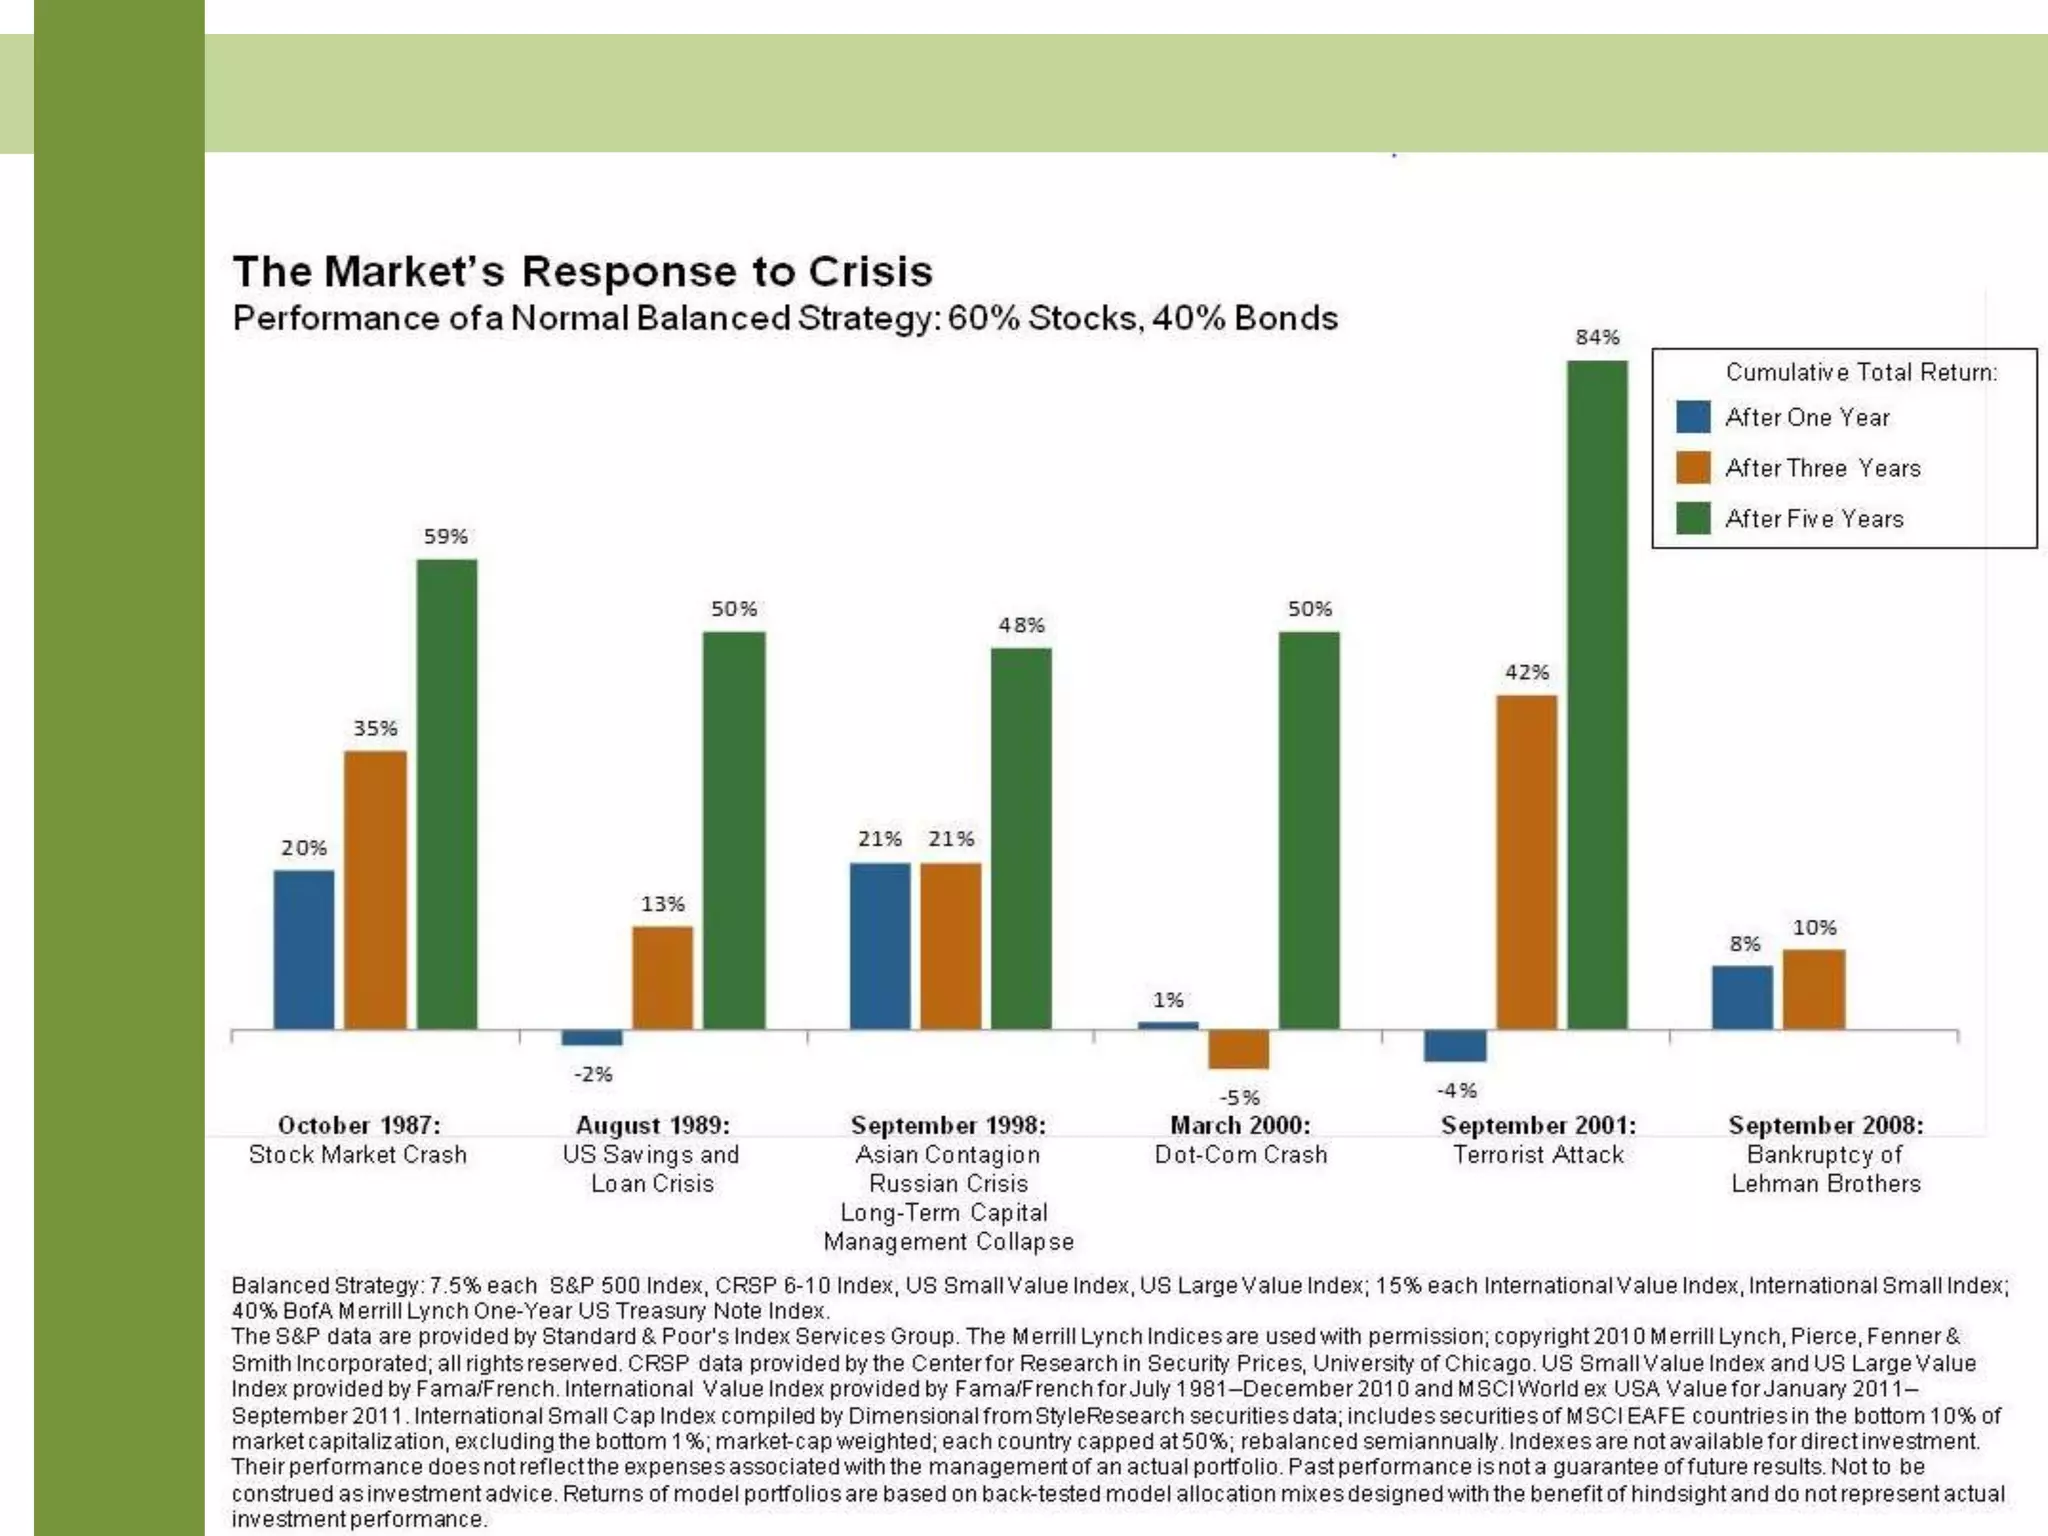
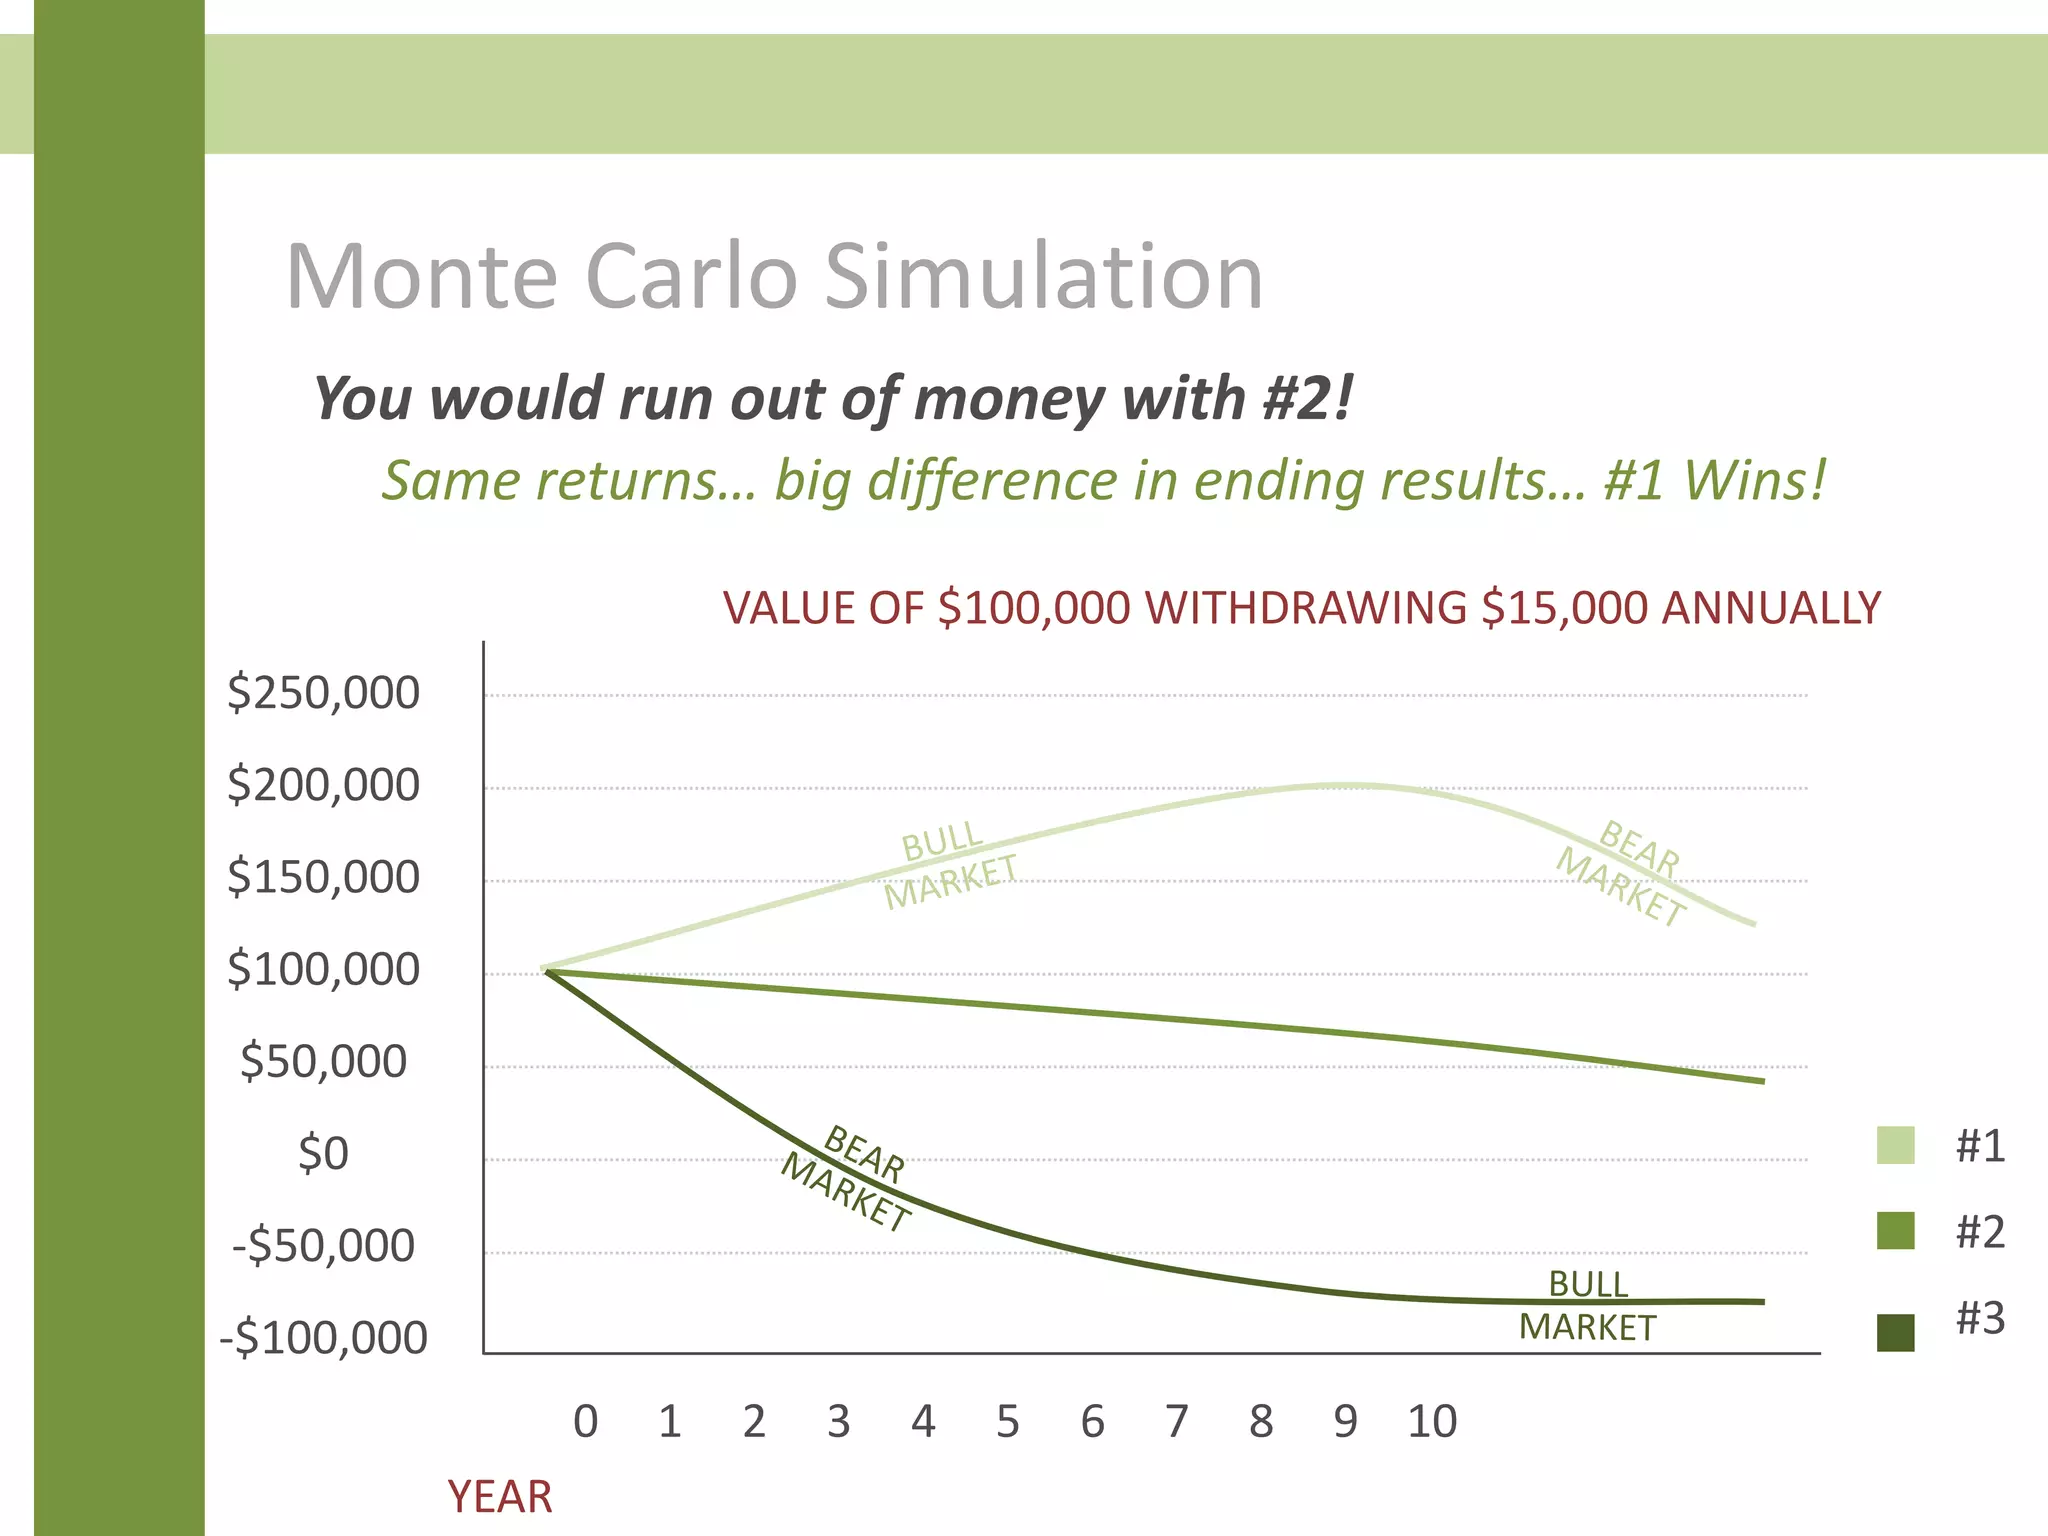
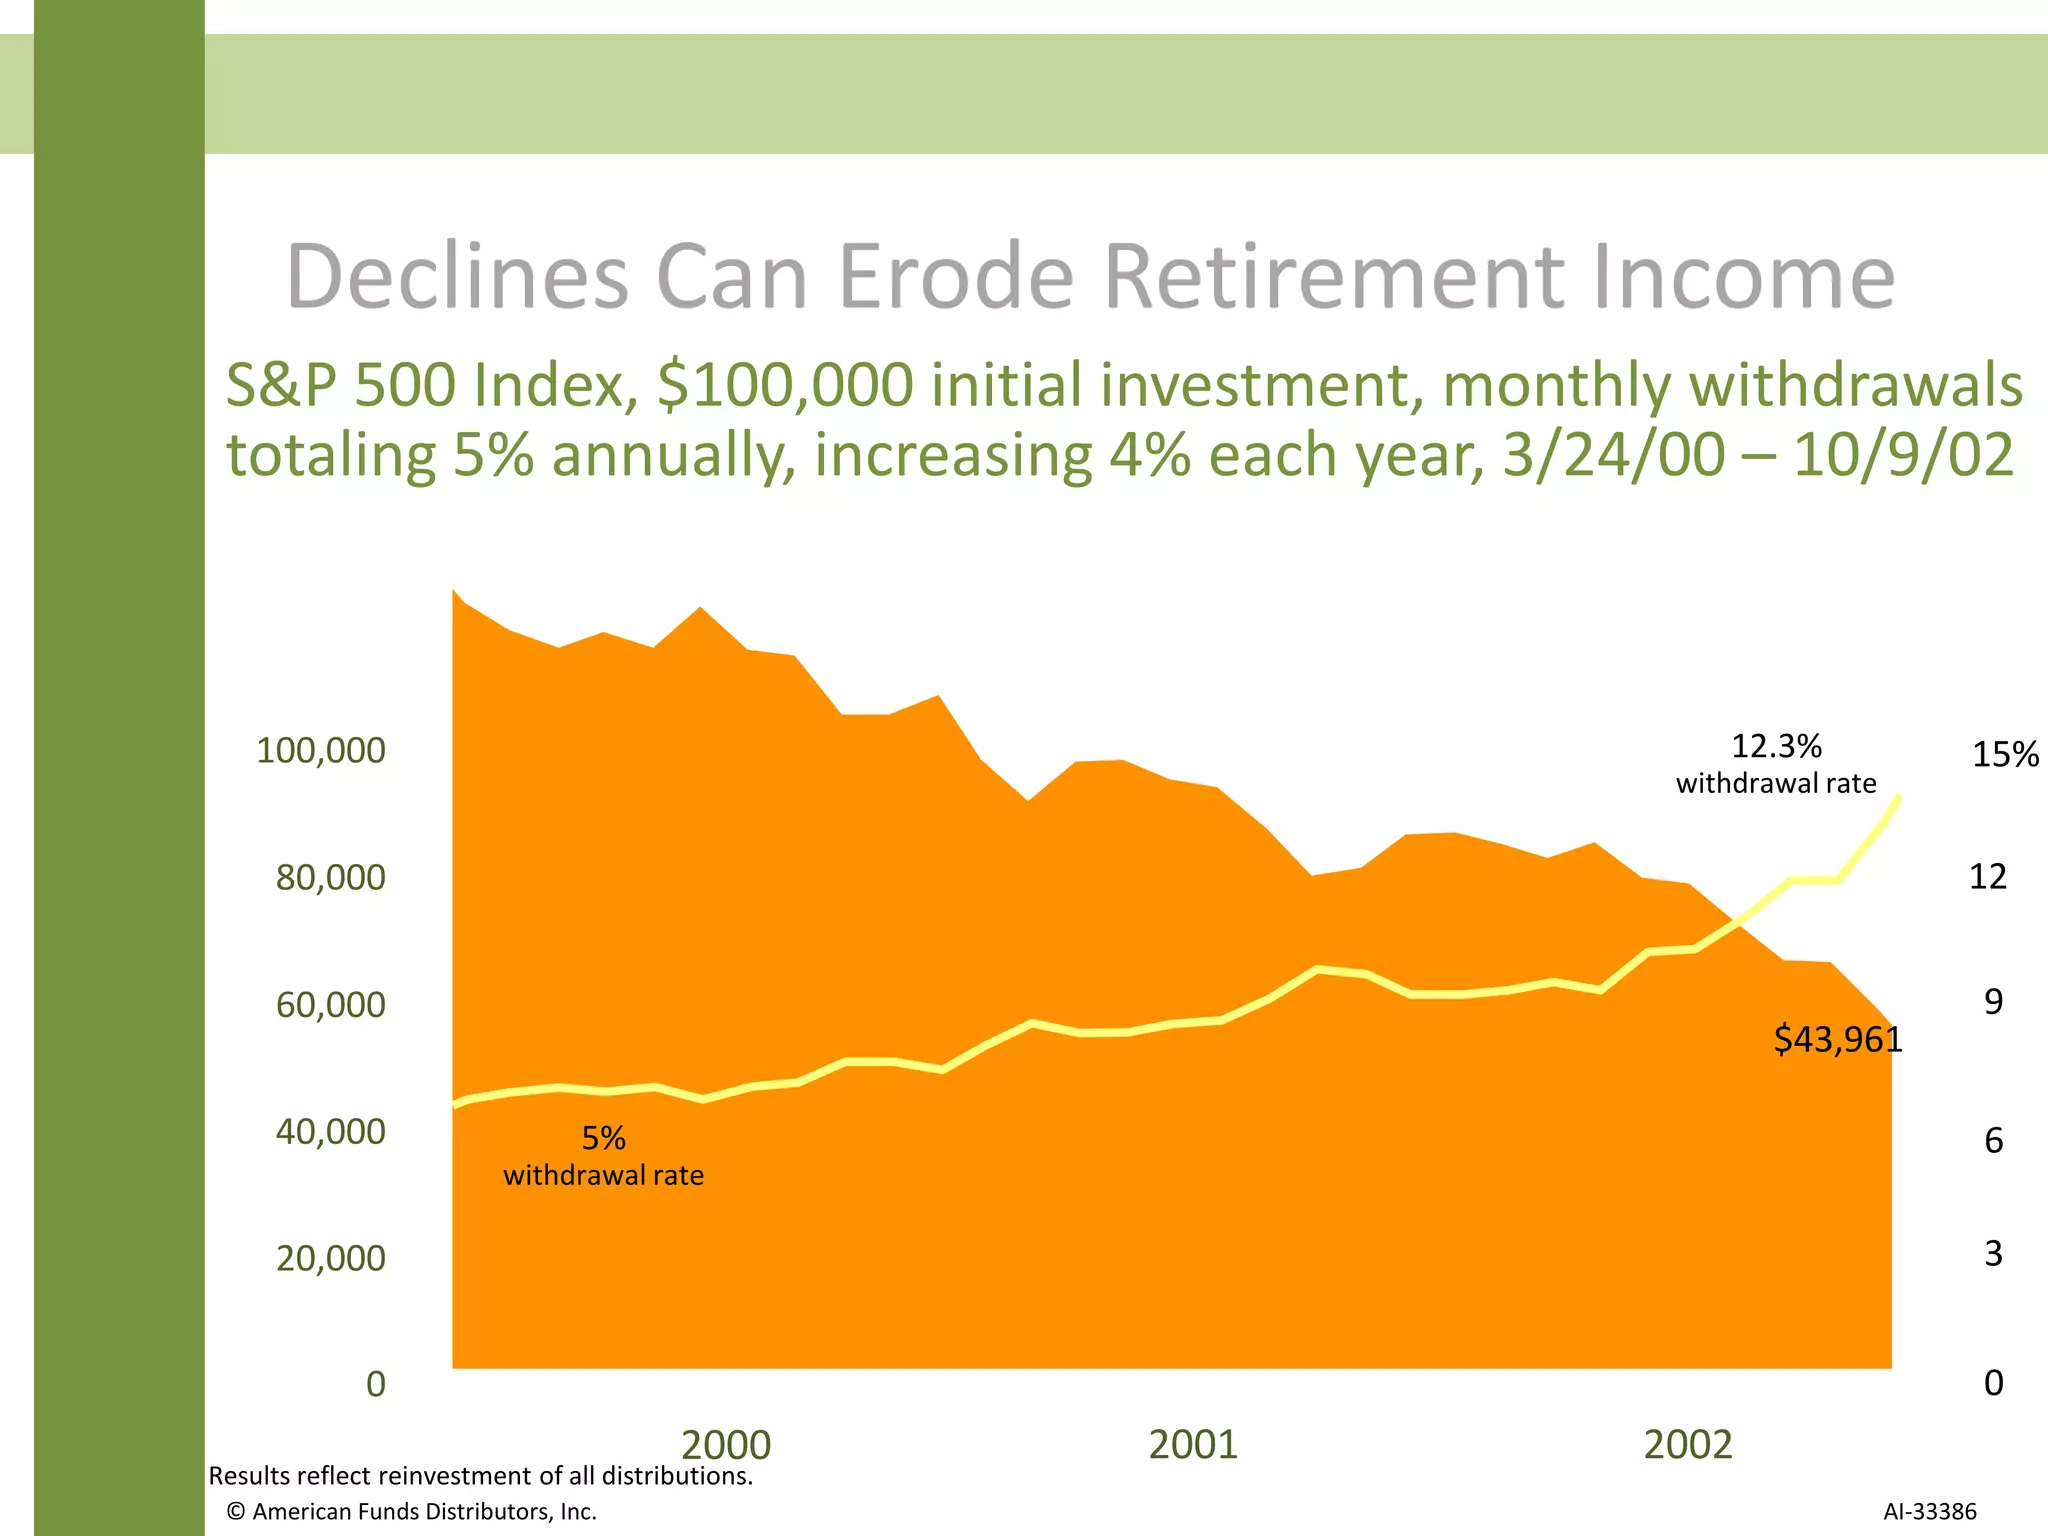
Week One material for Wealth Management course.
The information contained in this presentation is for illustrative and informational purposes only and should not be considered investment advice.
Asset allocation is an investment strategy. It helps to keep a balance between risk and return of any particular asset class. Asset allocation refers to investing a certain percentage of your investible surplus in respective asset classes, such as equity, debt, gold and real estate. Read to understand asset allocation in detail.
Just starting out on your investment journey?
Or have you been investing for a while and need a refresher?
A smart investor takes the time to be clear on the basic principles of investing and uses these to improve investing skills over time and more importantly, to avoid the costly pitfalls. And a smart investor doesn't rely on good luck. Instead, they take the time to consider their investment goals. Then they develop a plan and choose investments that align with their needs and objectives.
This workshop will cover the following areas:
Taking control!
Your money and your life
Savings and investments
Risk and diversification
Investment strategies
Managed fund, shares and property
By attending this session you will gain a better understanding of the fundamental investment principles such as gearing, asset allocation, diversification, dollar cost averaging & compounding. You will leave with a deeper understanding of these concepts which can help you, as an investor, avoid making mistakes and losing substantial sums of money.
Giving you greater confidence, peace of mind and ultimately better financial outcomes
Nick Gahan
Senior Financial Advisor
Nick is passionate about holistic advice encompassing superannuation (including SMSFs), personal insurance, investments, estate planning, retirement planning and social security and ensuring his clients are receiving comprehensive advice.
Managing startup equity (Equity For Startups)Kesava Reddy
Among the more important decisions that an entrepreneur makes is that of raising capital. Many choices have to be made in this context: Debt versus Equity. Own funds versus Funding from outside investors and so on. These choices have long term implications for the entrepreneur as well as the start-up. Equity funding is essential for the growth of a startup. Apart from providing critical funding equity investors also often bring added value by way of connections and strategic advice.
At the same time raising equity capital means sharing control and sharing wealth with the investors in the firm. Allowing investors to engage with the management of the startup calls for a certain degree of compatibility between the investor and the management of the enterprise. Absence of such compatibility can lead to unhappy relationships between the investor and the management team.
All things considered, managing the equity of a start-up is among the most critical decisions that an entrepreneur needs to make. It involves many trade-offs on the entrepreneurial journey. Which makes Managing the Equity of A Start Up a challenge. What does dilution of equity mean? How does the arithmetic of dilution work? How does an entrepreneur decide on when to raise equity? And how much of equity to raise?
Stanford CS 007-10 (2021): Personal Finance for Engineers / Additional Topics...Adam Nash
These are the slides from the 10th session of the Stanford University class, CS 007 "Personal Finance for Engineers" offered on December 7, 2021. This seminar covers student requested additional topics for the course, including bitcoin / cryptocurrency, derivatives, futures, options, private equity & venture capital.
On Thursday, April 27th, 2017, we heard from Windham's own client consultant, Jon Kazarian about best methods and practices for the portfolio construction and evaluation process.
Why do people make irrational investment decisions? How to make sure you don't.netwealthInvest
Part of Netwealth's portfolio construction webinar series - Chris Inifer from Allan Gray presented to an audience on 12th July 2016 on how a contrarian investment approach may help protect against poor human decision making that are often driven by emotion and biases.
Venstone AG | Diferente types d'outils d'investissementVenstone AG
Investir dans votre argent pour augmenter sa valeur et ses capitaux propres via Venstone AG, Zurich. Toutes les informations ont expliqué ici à ce sujet.
Dear students get fully solved assignments
Send your semester & Specialization name to our mail id :
help.mbaassignments@gmail.com
or
call us at : 08263069601
Dear students get fully solved assignments
Send your semester & Specialization name to our mail id :
help.mbaassignments@gmail.com
or
call us at : 08263069601
Dear students get fully solved assignments
Send your semester & Specialization name to our mail id :
help.mbaassignments@gmail.com
or
call us at : 08263069601
Income Matching Using Bonds NorCal 2011Brent Burns
Presentation slides from FPA NorCal 2011. Steve Huxley and I presented on how to create pension-like income usning individual bonds. Also contrasted against annuities, dividends and REITs.
If your company needs to submit a Financial Advisory Proposal PowerPoint Presentation Slides look no further.Our researchers have analyzed thousands of proposals on this topic for effectiveness and conversion. Just download our template, add your company data and submit to your client for a positive response. http://bit.ly/2HwkAEs
This seminar\'s original version became part of the template for Prudential Securities coordinated marketing programs. Participating brokers saw an increase in business that was three times the firm average.
Financial Planning is a long term process through which you can achieve your financial goals. We at Financial Hospital bring to you a presentation to help you understand the basics of having a healthy and planned financial future.
The secret way to sell pi coins effortlessly.DOT TECH
Well as we all know pi isn't launched yet. But you can still sell your pi coins effortlessly because some whales in China are interested in holding massive pi coins. And they are willing to pay good money for it. If you are interested in selling I will leave a contact for you. Just telegram this number below. I sold about 3000 pi coins to him and he paid me immediately.
Telegram: @Pi_vendor_247
how to sell pi coins on Bitmart crypto exchangeDOT TECH
Yes. Pi network coins can be exchanged but not on bitmart exchange. Because pi network is still in the enclosed mainnet. The only way pioneers are able to trade pi coins is by reselling the pi coins to pi verified merchants.
A verified merchant is someone who buys pi network coins and resell it to exchanges looking forward to hold till mainnet launch.
I will leave the telegram contact of my personal pi merchant to trade with.
@Pi_vendor_247
how to swap pi coins to foreign currency withdrawable.DOT TECH
As of my last update, Pi is still in the testing phase and is not tradable on any exchanges.
However, Pi Network has announced plans to launch its Testnet and Mainnet in the future, which may include listing Pi on exchanges.
The current method for selling pi coins involves exchanging them with a pi vendor who purchases pi coins for investment reasons.
If you want to sell your pi coins, reach out to a pi vendor and sell them to anyone looking to sell pi coins from any country around the globe.
Below is the contact information for my personal pi vendor.
Telegram: @Pi_vendor_247
what is the future of Pi Network currency.DOT TECH
The future of the Pi cryptocurrency is uncertain, and its success will depend on several factors. Pi is a relatively new cryptocurrency that aims to be user-friendly and accessible to a wide audience. Here are a few key considerations for its future:
Message: @Pi_vendor_247 on telegram if u want to sell PI COINS.
1. Mainnet Launch: As of my last knowledge update in January 2022, Pi was still in the testnet phase. Its success will depend on a successful transition to a mainnet, where actual transactions can take place.
2. User Adoption: Pi's success will be closely tied to user adoption. The more users who join the network and actively participate, the stronger the ecosystem can become.
3. Utility and Use Cases: For a cryptocurrency to thrive, it must offer utility and practical use cases. The Pi team has talked about various applications, including peer-to-peer transactions, smart contracts, and more. The development and implementation of these features will be essential.
4. Regulatory Environment: The regulatory environment for cryptocurrencies is evolving globally. How Pi navigates and complies with regulations in various jurisdictions will significantly impact its future.
5. Technology Development: The Pi network must continue to develop and improve its technology, security, and scalability to compete with established cryptocurrencies.
6. Community Engagement: The Pi community plays a critical role in its future. Engaged users can help build trust and grow the network.
7. Monetization and Sustainability: The Pi team's monetization strategy, such as fees, partnerships, or other revenue sources, will affect its long-term sustainability.
It's essential to approach Pi or any new cryptocurrency with caution and conduct due diligence. Cryptocurrency investments involve risks, and potential rewards can be uncertain. The success and future of Pi will depend on the collective efforts of its team, community, and the broader cryptocurrency market dynamics. It's advisable to stay updated on Pi's development and follow any updates from the official Pi Network website or announcements from the team.
where can I find a legit pi merchant onlineDOT TECH
Yes. This is very easy what you need is a recommendation from someone who has successfully traded pi coins before with a merchant.
Who is a pi merchant?
A pi merchant is someone who buys pi network coins and resell them to Investors looking forward to hold thousands of pi coins before the open mainnet.
I will leave the telegram contact of my personal pi merchant to trade with
@Pi_vendor_247
how to sell pi coins at high rate quickly.DOT TECH
Where can I sell my pi coins at a high rate.
Pi is not launched yet on any exchange. But one can easily sell his or her pi coins to investors who want to hold pi till mainnet launch.
This means crypto whales want to hold pi. And you can get a good rate for selling pi to them. I will leave the telegram contact of my personal pi vendor below.
A vendor is someone who buys from a miner and resell it to a holder or crypto whale.
Here is the telegram contact of my vendor:
@Pi_vendor_247
Falcon stands out as a top-tier P2P Invoice Discounting platform in India, bridging esteemed blue-chip companies and eager investors. Our goal is to transform the investment landscape in India by establishing a comprehensive destination for borrowers and investors with diverse profiles and needs, all while minimizing risk. What sets Falcon apart is the elimination of intermediaries such as commercial banks and depository institutions, allowing investors to enjoy higher yields.
Exploring Abhay Bhutada’s Views After Poonawalla Fincorp’s Collaboration With...beulahfernandes8
The financial landscape in India has witnessed a significant development with the recent collaboration between Poonawalla Fincorp and IndusInd Bank.
The launch of the co-branded credit card, the IndusInd Bank Poonawalla Fincorp eLITE RuPay Platinum Credit Card, marks a major milestone for both entities.
This strategic move aims to redefine and elevate the banking experience for customers.
BYD SWOT Analysis and In-Depth Insights 2024.pptxmikemetalprod
Indepth analysis of the BYD 2024
BYD (Build Your Dreams) is a Chinese automaker and battery manufacturer that has snowballed over the past two decades to become a significant player in electric vehicles and global clean energy technology.
This SWOT analysis examines BYD's strengths, weaknesses, opportunities, and threats as it competes in the fast-changing automotive and energy storage industries.
Founded in 1995 and headquartered in Shenzhen, BYD started as a battery company before expanding into automobiles in the early 2000s.
Initially manufacturing gasoline-powered vehicles, BYD focused on plug-in hybrid and fully electric vehicles, leveraging its expertise in battery technology.
Today, BYD is the world’s largest electric vehicle manufacturer, delivering over 1.2 million electric cars globally. The company also produces electric buses, trucks, forklifts, and rail transit.
On the energy side, BYD is a major supplier of rechargeable batteries for cell phones, laptops, electric vehicles, and energy storage systems.
USDA Loans in California: A Comprehensive Overview.pptxmarketing367770
USDA Loans in California: A Comprehensive Overview
If you're dreaming of owning a home in California's rural or suburban areas, a USDA loan might be the perfect solution. The U.S. Department of Agriculture (USDA) offers these loans to help low-to-moderate-income individuals and families achieve homeownership.
Key Features of USDA Loans:
Zero Down Payment: USDA loans require no down payment, making homeownership more accessible.
Competitive Interest Rates: These loans often come with lower interest rates compared to conventional loans.
Flexible Credit Requirements: USDA loans have more lenient credit score requirements, helping those with less-than-perfect credit.
Guaranteed Loan Program: The USDA guarantees a portion of the loan, reducing risk for lenders and expanding borrowing options.
Eligibility Criteria:
Location: The property must be located in a USDA-designated rural or suburban area. Many areas in California qualify.
Income Limits: Applicants must meet income guidelines, which vary by region and household size.
Primary Residence: The home must be used as the borrower's primary residence.
Application Process:
Find a USDA-Approved Lender: Not all lenders offer USDA loans, so it's essential to choose one approved by the USDA.
Pre-Qualification: Determine your eligibility and the amount you can borrow.
Property Search: Look for properties in eligible rural or suburban areas.
Loan Application: Submit your application, including financial and personal information.
Processing and Approval: The lender and USDA will review your application. If approved, you can proceed to closing.
USDA loans are an excellent option for those looking to buy a home in California's rural and suburban areas. With no down payment and flexible requirements, these loans make homeownership more attainable for many families. Explore your eligibility today and take the first step toward owning your dream home.
how can i use my minded pi coins I need some funds.DOT TECH
If you are interested in selling your pi coins, i have a verified pi merchant, who buys pi coins and resell them to exchanges looking forward to hold till mainnet launch.
Because the core team has announced that pi network will not be doing any pre-sale. The only way exchanges like huobi, bitmart and hotbit can get pi is by buying from miners.
Now a merchant stands in between these exchanges and the miners. As a link to make transactions smooth. Because right now in the enclosed mainnet you can't sell pi coins your self. You need the help of a merchant,
i will leave the telegram contact of my personal pi merchant below. 👇 I and my friends has traded more than 3000pi coins with him successfully.
@Pi_vendor_247
What website can I sell pi coins securely.DOT TECH
Currently there are no website or exchange that allow buying or selling of pi coins..
But you can still easily sell pi coins, by reselling it to exchanges/crypto whales interested in holding thousands of pi coins before the mainnet launch.
Who is a pi merchant?
A pi merchant is someone who buys pi coins from miners and resell to these crypto whales and holders of pi..
This is because pi network is not doing any pre-sale. The only way exchanges can get pi is by buying from miners and pi merchants stands in between the miners and the exchanges.
How can I sell my pi coins?
Selling pi coins is really easy, but first you need to migrate to mainnet wallet before you can do that. I will leave the telegram contact of my personal pi merchant to trade with.
Tele-gram.
@Pi_vendor_247
Introduction to Indian Financial System ()Avanish Goel
The financial system of a country is an important tool for economic development of the country, as it helps in creation of wealth by linking savings with investments.
It facilitates the flow of funds form the households (savers) to business firms (investors) to aid in wealth creation and development of both the parties
3. Basics of Investing
Types of Investors
RISK
RETURN
LOW HIGH
HIGH
MANAGES
ONLY
RISK
MANAGES
BOTH RISK
& RETURN
MANAGES
ONLY
RETURN
4. Something to Consider:
“Stocks have outperformed fixed income securities over time.
Why not always invest in stocks for future funding?”
Answer: Time Horizon and Risk Tolerance evolve with age
7. Some Assumptions Do Not Apply
Before Retirement
Cash flow not an issue
Known time horizon
Risk = standard deviation
Cash flow is critical
Unknown time horizon
Risk = loss of capital
During Retirement
8. Why Do We Invest?
To satisfy a current goal
To satisfy a future goal
Goals Drive Investments,
Investments DO NOT Drive Goals
Basics of Investing
9. Asset Allocation Overview
What type of investor are you?
Influencing Factors:
Age, Retirement Goals and Horizon, Investment Experience, Personality
Source: Investopedia.com
Fixed
Income
Equities
Cash
Equivalents
Fixed
Income
Equities
Cash
Equivalents
Fixed
Income
Equities
Cash
Equivalents
Fixed
Income
Equities
Cash
Equivalents
Less Risk More Risk
Conservative Moderate Aggressive Very
Aggressive
10. The Common Approach:
Aggressive
I don’t want to lose any
money, but if I can still
make a little money, that’s
great!
I want to make money and I
don’t mind taking a few
risks to make it happen. I want to make the most
money possible! I am willing
to take whatever risks
needed to make it happen!
Conservative
Moderate
Determining Your Risk Tolerance
11. Determining Your Risk Tolerance
The Expanded Approach:
Risk Questionnaires
Your Age and Time Horizon
Your Assets and Savings Potential
Your Level of Comfort
Your Spending Level
Risk is approached from two different directions
1. How much risk do I need to take?
2. How much risk do I want to take?
I need to consider several
factors to determine my true
risk tolerance…
17. Basics of Investing
Effect of Variability
PORTFOLIO A PORTFOLIO B
First Year Return Gain 30% Gain 10%
Value After First Year $1,300,000 $1,100,000
Second Year Return Loss 10% Gain 10%
Value After Second Year $1,170,000 $1,210,000
Average return for each portfolio was 10% per year. Portfolio B
with a stable return had a real dollar return which was $40,000
greater than Portfolio A
RULE: Given 2 portfolios with the same arithmetic return the
portfolio with the lowest volatility will always have the highest
real dollar return.
For illustrative purposes only. This chart does not reflect the performance of any specific investment.
Original Value $1,000,000 $1,000,000
18. Not in Hard Copies: Variance Drain
• Here’s an example:
– Using coin-flipping
– 50% chance of coming up heads or tails
– In the experiment, heads doubles your money and tails loses half your money
Head 100%
Tails -50%
Heads 100%
Heads 100%
Tails -50%
Heads 100%
Tails -50%
Tails -50%
Heads 100%
Tails -50%
Average 25%
Seems highly
profitable right?
19. Variance drain: Average Return
• Let’s put some money to the numbers and see
– For the experiment, we will start with $2000
Head 100% $4000
Tails -50% $2000
Heads 100% $4000
Heads 100% $8000
Tails -50% $4000
Heads 100% $8000
Tails -50% $4000
Tails -50% $2000
Heads 100% $4000
Tails -50% $2000
Return 0%
You started with $1000 and ended
with $1000
• How is that possible?
• Your average return was
25%, but your compounded
return is 0
20. Variance drain: Compounded Return
– Volatility is reduced by lowering the risk you take
– In this experiment, you will only commit half of your
capital, thereby halving your risk
Investment: $1000
Half Balance
Return
Head 50% $1500
Tails -25% $1125
Heads 50% $1688
Heads 50% $2531
Tails -25% $1898
Heads 50% $2848
Tails -25% $2136
Tails -25% $1602
Heads 50% $2403
Tails -25% $1802
Total Return 80%
After 10 flips, you had a total
return of 80%, or 6.1%
compounded per flip
• You netted a profit of
$800 on this investment
so far
21. The Impact of Volatility
Impact on a Hypothetical $100,000 Portfolio
Year 1
Return
Year 2
Return
Average
Return
Compound
Return
Value at End
of Year 2
Portfolio #1 50% -50% 0% -13.4% $75,000
Portfolio #2 10% -10% 0% -0.5% $99,000
For illustrative purposes only.
Image Source: http://www.saturdayeveningpost.com/2010/07/26/in-the-magazine/finance/investing-america.html
26. Stocks
Historical Return from 1926 to 2011:
0%
2%
6%
8%
%RETURN
12%
4%
10%
ASSET CLASSES
CASH (T-Bill)
FIXED INCOME/BONDS
(LT Gov Bonds)
STOCKS
(LC Stocks)
14%
Ibbotson Associates U.S. Return & Risk Data: 1926-2009
Source: Stocks, Bonds, Bills and Inflation 2009 Yearbook. 2009 Ibbotson Associates, Inc. Based on copyrighted works by Ibbotson and Sinquefield.
All right reserved. Used with permission.
Past performance does not guarantee future results.
5.72%
3.59%
9.77%
27. Risk
Different Asset Classes can be Measured
Cash
Fixed Income/Bonds
Stocks
HOW DO WE MEASURE THE
RISK FOR EACH ASSET CLASS?
29. Measuring Risk
Defines risk in terms of variability or volatility of return
Measures total volatility -- both downside and upside dispersion of a portfolio’s return -
- to the average return
It shows how much variation there is from the average. 95% of ALL observations fall
with +/- 2 standard deviations
MEAN RETURN-1 SD-2 SD +1 SD +2 SD
Standard Deviation
= 95%
30. Measuring Risk
US T-Bills have a historical mean return of 2.96% and a standard deviation of 0.57%
We would expect 95% of all returns to fall within a range of 1.85% to 4.1%.
MEAN RETURN-1 SD-2 SD +1 SD +2 SD
Range of 2.25%
1.85% 2.42% 3.53% 4.10%
2.96%
1989-2012
Std Dev = 0.57%
Data Source: Morningstar, Barclays US Treasury Bill TR
US T-Bills
31. Measuring Risk
S&P 500 Large Cap Stocks
The S&P 500 has a historical mean return of 9.62% and a standard deviation of 18.11%
We would expect 95% of all returns to fall within a range of -26.6% to 45.8%.
MEAN RETURN-1 SD-2 SD +1 SD +2 SD
Range of 72.44%
-26.60% -8.49% 27.73% 45.84%
9.62%
Std Dev = 18.11%Data Source: www.russell.com 1973-2011
32. Measuring Risk
Small Cap Stocks have a historical mean return of 11.47% with a standard deviation of
22.23%. We would expect 95% of all returns to fall within a range of -32.9% to 55.9%
MEAN RETURN-1 SD-2 SD +1 SD +2 SD
Range of 88.92%
-32.99% -10.76% 33.7% 55.93%
11.47%
Std Dev of 22.23%
Small Cap Stocks
Data Source: www.russell.com, Ibbotson & Associates, 1973-1978, Russell 2000, 1979-2011
33. Measuring Risk
International Stocks have a historical mean return of 8.97% with a standard deviation
of 22.58%. We would expect 95% of all returns to fall within a range of -36.1% to
54.1%
MEAN RETURN-1 SD-2 SD +1 SD +2 SD
Range of 90.32%
-36.19% -13.61% 31.55% 54.13%
8.97%
Std Dev of 22.58%
International Stocks
Data Source: www.russell.com, MSCI EAFE
34. Measuring Risk
Real Estate has a historical mean return of 10.35% with a standard deviation of
14.79%. We would expect 95% of all returns to fall within a range of -19.23% to
39.93%
MEAN RETURN-1 SD-2 SD +1 SD +2 SD
Range of 56.16%
-19.23% -4.44% 25.14% 39.93%
10.35%
Std Dev of 14.79%
Real Estate
Data Source: www.russell.com, NAREIT Equity REIT Index
35. Summary
As of 12/31/2012
3 Yr
Historical
IWB
Large
Cap
IWN
Small
Cap
DODFX
Intl.
Fund
VWO
Emrg.
Markets
FGOVX
Intermd
Govt
DODIX
Corp/
Mrtg
VUSTX
LT Gov
GSHIX
High
Yield
Ave.
Return
5.06% 6.49% 0.65% 0.23% 4.83% 6.85% 8.34% 9.62%
Std.
Dev.
19.20% 24.62% 26.72% 29.60% 3.67% 4.76% 13.65% 13.06%
Equity Funds Bond/ Fixed Income Funds
Increasing Standard Deviation & Returns
Fund Names are not investment recommendations. Data Source: Asset Allocation, Roger Gibson, 2008
36. Measuring Risk
Standard Deviation of Asset Classes
-30% -10% 30% 50%
3%
CASH
9%
BONDS
10%
LARGE STOCKS
11.5%
SMALL STOCKS
1972-2008 Data Source: Asset Allocation, Roger Gibson, 2008
37. Measuring Risk
2006
Histogram of Stocks’ Performance Based on the S&P 500
(given in percent)
2004 2009
2000 2007 1998 2003 1997
1990 2005 1986 1999 1995
1981 1994 1979 1998 1991
1977 1993 1972 1996 1989
1969 1992 1971 1983 1985
1962 1987 1968 1982 1980
1953 1984 1965 1976 1975
1946 1978 1964 1967 1955
2001 1940 1970 1959 1963 1950
1973 1939 1960 1952 1961 1945
2002 1966 1934 1956 1949 1951 1938 1958
1974 1957 1932 1948 1944 1943 1936 1935 1954
1931 1937 1930 1941 1929 1947 1926 1942 1927 1928 1933
LARGE COMPANY
STOCKS
-40 -30 -20 -10 0 10 20 30 40 50 60
Source: Stocks, Bonds, Bills and Inflation 2009 Yearbook. 2009 Ibbotson Associates, Inc. Based on copyrighted works by Ibbotson and Sinquefield.
All right reserved. Used with permission.
Past performance does not guarantee future results.
2008
2010 2012
2011
38. Mixing Assets Together
Equity Assets
Fixed Assets
Real estate
Hedge funds
Annuities
Insurance
Private Equity
Venture Capital
Assets choices
How do I mix them together?
39. Modern Portfolio Theory (MPT)
Diversification
Every investment decision should have as its objective
the enhancement of the portfolio’s return, the reduction
of risk, or both.
The purpose of diversification is not merely to increase
returns, but rather to achieve a desired level of return
with a minimum level of risk.
To protect a portfolio from being vulnerable to just one
asset class, it is important to develop policies that will
lead to diversified portfolios.
43. Modern Portfolio Theory (MPT)
Real World Example
TIME
Past performance is not indicative of future results.
$
44. In US dollars. Indices are not available for direct investment. Their performance does not reflect the expenses associated with the management of an actual portfolio. Past
performance is not a guarantee of future results. US value and growth index data (ex utilities) provided by Fama/French. The S&P data are provided by Standard & Poor’s Index
Services Group. CRSP data provided by the Center for Research in Security Prices, University of Chicago. International Value data provided by Fama/French from Bloomberg
and MSCI securities data. International Small data compiled by Dimensional from Bloomberg, StyleResearch, London Business School, and Nomura Securities data. MSCI EAFE
Index is net of foreign withholding taxes on dividends; copyright MSCI 2010, all rights reserved. Emerging markets index data simulated by Fama/French from countries in the IFC
Investable Universe; simulations are free-float weighted both within each country and across all countries.
45. The Risk Dimensions Delivered
Periods based on rolling annualized returns. 121 total 25-year periods. 181 total 20-year periods.
241 total 15-year periods. 301 total 10-year periods. 361 total 5-year periods.
International Value and Growth data provided by Fama/French from Bloomberg and MSCI securities data. International Small data compiled by Dimensional from
Bloomberg, StyleResearch, London Business School, and Nomura Securities data. International Large is MSCI EAFE Index net of foreign withholding taxes on dividends; copyright
MSCI 2010, all rights reserved. Foreign securities prices may decline or fluctuate because of: (a) economic or political actions of foreign governments, and/or (b) less regulated or
liquid securities markets. Investors holding these securities are also exposed to foreign currency risk (the possibility that foreign currency will fluctuate in value against the US dollar).
Securities of small companies are often less liquid than those of large companies. As a result, small company stocks may fluctuate relatively more in price. Mutual funds distributed by
DFA Securities LLC.
Value beat growth 100% of the time.
Value beat growth 98% of the
time.
Small beat large 100% of the time.
Small beat large 84% of the time.
Small beat large 76% of the time.
Small beat large 75% of the time.
International Value vs. International Growth International Small vs. International Large
January 1975 – December 2011
In 5-Year Periods
In 10-Year Periods
In 15-Year Periods
In 20-Year Periods
In 25-Year Periods Value beat growth 100% of the time.
Value beat growth 100% of the time.
Value beat growth 98% of the time.
46. The Risk Dimensions Delivered
Periods based on rolling annualized returns. 703 total 25-year periods. 763 total 20-year periods.
823 total 15-year periods. 883 total 10-year periods. 943 total 5-year periods.
Performance based on Fama/French Research Factors. Securities of small companies are often less liquid than those of large companies. As a result, small company stocks may
fluctuate relatively more in price. Mutual funds distributed by DFA Securities LLC.
Value beat growth 100% of the time.
Value beat growth 99% of the time.
Value beat growth 96% of the time.
Value beat growth 86% of the time.
Small beat large 96% of the time.
Small beat large 83% of the time.
Small beat large 78% of the time.
Small beat large 68% of the time.
Small beat large 60% of the time.
US Value vs. US Growth US Small vs. US Large
July 1926 – December 2011
48. Asset Allocation
Is Asset Allocation Important?
ASSET ALLOCATION
POLICY: 91.5%
MARKET TIMING: 1.8%
SECURITY SELECTION: 4.6%
OTHER FACTORS: 2.1%
Source: Asset Allocation by Roger Gibson
Asset Allocation cannot
eliminate the risk of
fluctuating prices or
uncertain returns.
In other words it cannot
eliminate Market Risk
49. Asset Allocation
The Efficient FrontierRETURN
RISK
100% BONDS
MAXIMUM RISK PORTFOLIO
100% STOCKS
This graph is for illustrative purposes only and does not represent any individual scenario.
51. Asset Allocation
The Efficient FrontierRETURN
RISK
100% BONDS
MAXIMUM RISK PORTFOLIO
100% STOCKS
This graph is for illustrative purposes only and does not represent any individual scenario.
EFFICIENT PORTFOLIO
IS A BLEND OF
STOCKS AND BONDS.
52. The Basic Institutional Portfolio
Barclays Capital data, formerly Lehman Brothers, provided by Barclays Bank PLC. The S&P data are provided by Standard & Poor’s Index Services Group.
Indexes are not available for direct investment. Their performance does not reflect the expenses associated with the management of an actual portfolio.
Past performance is not a guarantee of future results. Not to be construed as investment advice. Returns of model portfolios are based on back-tested model allocation mixes
designed with the benefit of hindsight and do not represent actual investment performance. See cover page for additional information.
S&P 500 Index
Barclays US Government/Credit Bond Index
Annualized
Compound
Return
Annualized
Standard
Deviation
Model Portfolio 1 9.41% 11.18%
Barclays US
Govt./Credit
Bond Index
S&P 500
Index
Model Portfolio 1 40% 60%
53. Substituting Short-Term for Long-Term Fixed Income
Annualized
Compound
Return
Annualized
Standard
Deviation
Model Portfolio 1 9.41% 11.18%
Model Portfolio 2 8.82% 10.18%
Barclays US
Govt./Credit
Bond Index
S&P 500
Index
Merrill Lynch
One-Year US
Treasury Note
Index
Model Portfolio 1 40% 60%
Model Portfolio 2 60% 40%
S&P 500 Index
One-Year US Treasury Note Index
Barclays Capital data, formerly Lehman Brothers, provided by Barclays Bank PLC. The S&P data are provided by Standard & Poor’s Index Services Group. The Merrill Lynch Indices are used with
permission; copyright 2010 Merrill Lynch, Pierce, Fenner & Smith Incorporated; all rights reserved.
Indexes are not available for direct investment. Their performance does not reflect the expenses associated with the management of an actual portfolio.
Past performance is not a guarantee of future results. Not to be construed as investment advice. Returns of model portfolios are based on back-tested model allocation mixes designed with the
benefit of hindsight and so not represent actual investment performance. See cover page for additional information.
54. Diversifying a Portfolio Into US Small Cap Stocks
Annualized
Compound
Return
Annualized
Standard
Deviation
Model Portfolio 1 9.41% 11.18%
Model Portfolio 2 8.82% 10.18%
Model Portfolio 3 9.63% 11.86%
Barclays US
Govt./Credit
Bond Index
S&P 500
Index
Merrill Lynch
One-Year US
Treasury Note
Index
US Small
Cap
Index
Model Portfolio 1 40% 60%
Model Portfolio 2 60% 40%
Model Portfolio 3 30% 40% 30%
One-Year US Treasury Note Index
S&P 500 Index
US Small Cap Index
Barclays Capital data, formerly Lehman Brothers, provided by Barclays Bank PLC. The S&P data are provided by Standard & Poor’s Index Services Group. The Merrill Lynch Indices are used with
permission; copyright 2010 Merrill Lynch, Pierce, Fenner & Smith Incorporated; all rights reserved. Dimensional Index data compiled by Dimensional. Indexes are not available for direct
investment. Their performance does not reflect the expenses associated with the management of an actual portfolio. Past performance is not a guarantee of future results. Not to be construed
as investment advice. Returns of model portfolios are based on back-tested model allocation mixes designed with the benefit of hindsight and do not represent actual investment performance.
See cover page for additional information.
55. Diversifying a Portfolio Into US Value Stocks
Barclays Capital data, formerly Lehman Brothers, provided by Barclays Bank PLC. The S&P data are provided by Standard & Poor’s Index Services Group. The Merrill Lynch Indices
are used with permission; copyright 2010 Merrill Lynch, Pierce, Fenner & Smith Incorporated; all rights reserved. Dimensional Index data compiled by Dimensional.
Indexes are not available for direct investment. Their performance does not reflect the expenses associated with the management of an actual portfolio.
Past performance is not a guarantee of future results. Not to be construed as investment advice. Returns of model portfolios are based on back-tested model allocation mixes
designed with the benefit of hindsight and do not represent actual investment performance. See cover page for additional information.
Annualized
Compound
Return
Annualized
Standard
Deviation
Model Portfolio 1 9.41% 11.18%
Model Portfolio 2 8.82% 10.18%
Model Portfolio 3 9.63% 11.86%
Model Portfolio 4 10.60% 11.78%
Barclays US
Govt./Credit
Bond
Index
S&P 500
Index
Merrill Lynch
One-Year US
Treasury Note
Index
US Small
Cap
Index
US Large
Value
Index
Targeted
Value
Index
Model Portfolio 1 40% 60%
Model Portfolio 2 60% 40%
Model Portfolio 3 30% 40% 30%
Model Portfolio 4 15% 40% 15% 15% 15%
One-Year US Treasury Note Index
S&P 500 Index
US Small Cap Index
US Large Value Index
Targeted Value Index
56. A Fully Diversified Portfolio
Rebalanced annually. Barclays Capital data, formerly Lehman Brothers, provided by Barclays Bank PLC. The S&P data are provided by Standard & Poor’s Index Services Group. The Merrill Lynch
Indices are used with permission; copyright 2010 Merrill Lynch, Pierce, Fenner & Smith Incorporated; all rights reserved. Dimensional Index data compiled by Dimensional. Emerging Markets
Blended Index consists of 50% Fama/French Emerging Markets Index, 25% Fama/French Emerging Markets Small Cap Index, and 25% Fama/French Emerging Markets Value Index. Fama/French
Emerging Markets, Fama/French Emerging Markets Value and Fama/French Emerging Markets Small Cap Index weightings allocated evenly between Dimensional International Small Cap Index
and Fama/French International Value Index prior to January 1989 data inception. Dimensional International Small Cap Value Index weighting allocated to International Small Cap Index prior to
July 1981 data inception. International Value weighting allocated evenly between International Small Cap and MSCI World ex USA Index prior to January 1975 data inception. Indexes are not
available for direct investment. Their performance does not reflect the expenses associated with the management of an actual portfolio. Past performance is not a guarantee of future results.
Not to be construed as investment advice. Returns of model portfolios are based on back-tested model allocation mixes designed with the benefit of hindsight and do not represent actual
investment performance. See cover page for additional information.
Annualized
Compound
Return
Annualized
Standard
Deviation
Model Portfolio 1 9.41% 11.18%
Model Portfolio 2 8.82% 10.18%
Model Portfolio 3 9.63% 11.86%
Model Portfolio 4 10.60% 11.78%
Model Portfolio 5 11.64% 11.24%
Barclays US
Govt./Credit
Bond
Index
S&P
500
Index
Merrill Lynch
One-Year US
Treasury
Note Index
US
Small
Cap
Index
US
Large
Value
Index
Targeted
Value
Index
Intl.
Large
Index
Intl.
Small
Index
Intl.
Large
Value
Index
Intl.
Small
Value
Index
Emerging
Markets
Blended
Index
Model Portfolio 1 40% 60%
Model Portfolio 2 60% 40%
Model Portfolio 3 30% 40% 30%
Model Portfolio 4 15% 40% 15% 15% 15%
Model Portfolio 5 7.5% 40% 7.5% 7.5% 7.5% 6% 6% 6% 6% 6%
One-Year US Treasury Note Index
S&P 500 Index
US Small Cap Index
US Large Value Index
Targeted Value Index
International Large Index
International Small Index
International Large Value Index
International Small Value Index
Emerging Markets Blended Index
Quarterly: 1973-2013
58. Asset Allocation
Importance of a Rebalancing Strategy
TIME
100%
75%
50%
25%
TARGETALLOCATION
REBALANCING REQUIRED
TARGET
RANGE
Source: Sungard® Expert Solutions
59. Scenario Average Annual Return Standard Deviation End Value
Scenario One: Buy & Hold 11.53% 13.57% $8,874,742
Scenario Two: Periodic
Rebalancing – Rebalance at
the end of each quarter
11.85% 10.87% $9,391,171
Scenario Three: Threshold
Rebalancing – Rebalance
when the allocation
deviates beyond +/- 20% of
target
11.98% 12.14% $9,606,430
Source: Financial Planning Magazine, Dec 2005
Assume a hypothetical $1,000,000 Portfolio over 20 years,
Allocated as shown
Russell 1000
Growth
25%
Russell 1000 Value
25%
Russell
2000
10%
MSCI EAFE
10%
Barclays Municipal
30%
Why Rebalance?
60.
61. Monte Carlo Simulation
A large number of random trials are run.
Patterns in the trial’s outcomes show the most likely range and
concentration of results.
Please Note:
The following examples are for illustrative purposes only. The
results shown do not represent the returns of any particular
investment.
64. Monte Carlo Simulation
Example:
If you could choose from any of the following three
investments, which would you select?
#1 11.6 $299
#2 11.6 $299
#3 11.6 $299
INVESTMENT
CHOICE
TEN YEAR
RETURN
GROWTH
OF $100
65. Monte Carlo Simulation
You would think that they would all be the same…but…
0 1 2 3 4 5 6 7 8 9 10
$400
$350
$300
$250
$200
$150
$100
$50
YEAR
GROWTH OF $100
#1
#2
#3
You may want to understand the path you took to
achieve the ending goal
66. Monte Carlo Simulation
Instead of a single $100 investment, test the same choices
for different investors…
What if I were saving $10,000 a year?
Would they produce the same results?
67. Monte Carlo Simulation
One choice may produce over TWICE the amount of money
0 1 2 3 4 5 6 7 8 9 10
$300,000
$250,000
$200,000
$150,000
$100,000
$50,000
$0
GROWTH OF $10,000 INVESTED EACH YEAR
#1
#2
#3
Same returns…BIG difference in ending results… #2 Wins!
YEAR
68. Monte Carlo Simulation
What about a different investor?
If I had $100,000 and I needed $15,000 per year, would it last
10 years?
69. Monte Carlo Simulation
You would run out of money with #2!
0 1 2 3 4 5 6 7 8 9 10
$250,000
$200,000
$150,000
$100,000
$50,000
$0
-$50,000
-$100,000
VALUE OF $100,000 WITHDRAWING $15,000 ANNUALLY
#1
#2
#3
Same returns… big difference in ending results… #1 Wins!
YEAR
70. Monte Carlo Simulation
The ending results of our three choices
depend on YOUR plan…
They all produced an average of 11.6 % over
the 10 year period!
INVESTMENT 1INVESTOR INVESTMENT 2 INVESTMENT 3
Invest $100
Save
$10K/year
Invest $100K
Withdraw
$15K/year
$299 $299 $299
$119,117 $256,038 $171,909
$120,285 -$55,722 $41,097
73. Monte Carlo Simulation
Most plans assume you will achieve the average return each
year and ignore bull and bear markets.
Understand your Odds
With probability analysis, you project many results; including
both bull and bear markets
This chart shows the very basic rules that typically regard the risk/return characteristics of the three major asset classes. A blend of these three gives us the most basic forms of asset allocation.
Similar to the previous chart, this basically profiles the type of investor. Locating where an investor is on this chart will help to find out which investment, or combination of investments, is best to achieve the desired levels of risk and return.
The primary concern for most investors is the possibility of permanently losing their money. Such a loss can prevent them from reaching their financial goals.Whether investing to meet a long-term objective or taking retirement income from their investments, it’s critical that investors recognize the risks they face and try to manage them with the help of their financial adviser.Today I’d like to focus on understanding the impact of risk on retirement income. During retirement, when market volatility can be magnified and time to recover losses can be compressed, the margin for error narrows. That’s why it’s important for investors at this stage to seek retirement-income strategies that can be resilient when markets decline and can generate consistent streams of income.
Some common assumptions about investing during one’s saving years simply don’t apply to retirement planning. For example:Cash flow from investments typically is not an issue before retirement. On the other hand, cash flow during retirement is critical because it can have a profound impact on portfolios.Investors saving for retirement can generally determine the time horizon during which they intend to invest. The good news is that we are expected to live longer. However, because investors can’t precisely predict their life expectancy, they don’t know how long they will need income in their retirement years.I’ll talk a little more about that in a moment.One of the statistical measures often used in the industry to assess the risk of an investment is standard deviation. Standard deviation measures the spread of returns from the mean — essentially, the returns’ range of low to high relative to mean.Risk for retirees — regardless of how it’s measured— can mean losing capital and, ultimately, outliving their retirement savings.
Maintaining a grasp of the underlying goal is key to developing an investment strategy.
Risk questionnaires most commonly contain anywhere from 5-25 questions that help assess one’s risk. Examples include: How important to me is Capital Preservation? (Rate from 1-5, with 1 being not important and 5 being extremely important) How important is low volatility in my portfolio? How important is growth in my portfolio? How important is cash flow? Age and Time Horizon: How many more years will I work before I retire? Will I fully retire or continue to work part time? Given increased life expectancy tables, how long do I want to plan on living off of retirement assets?Assets and Savings Potential: How much can I contribute to
Here’s a sample portfolio for Doug, an investor in the accumulation phase. He and his wife, who have a newborn baby, plan to have another child in the near future. So, they anticipate moving out of their apartment and into a house in a few years.In order to meet this objective, Doug plans to invest for five years and then take a one-time distribution to use as a down payment for a new home.Doug’s portfolio comprises:10% growth-and-income funds10% equity-income/balanced funds80% bond funds
Here’s a sample portfolio for Janet, an investor in the accumulation phase.Janet has a 3-year-old son. And because she’s a single mother, one of her biggest concerns is how she’s going to pay for her toddler’s college education.So, Janet wants to start a college fund for her son as soon as possible. She has the next 15 years to invest, followed by four years during which she’ll need income to pay for tuition and other college expenses. Janet’s portfolio comprises:25% growth funds35% growth-and-income funds20% equity-income/balanced funds20% bond funds
Here’s a sample portfolio for Ricardo, an investor in the accumulation phase.Ricardo works as a computer support representative and has just started to invest in a 401(k) retirement plan sponsored by his employer. He plans to invest in his 401(k) for the next 20 years and anticipates taking income from his investment for more than 20 years.Ricardo’s portfolio comprises:45% growth funds40% growth-and-income funds15% equity-income/balanced funds
Here’s a sample portfolio for Tom, an investor in the distribution phase.Tom is a recent retiree. After more than 30 years of traveling from city to city selling medical supplies to hospitals, he’s looking forward to a more stable lifestyle — spending quality time with his wife, children and grandchildren.Now that he’s in retirement, Tom plans to live off his investment — withdrawing 6% from his account each year.Tom’s portfolio comprises:5% growth funds20% growth-and-income funds15% equity-income/balanced funds60% bond funds
Here’s a sample portfolio for Lori, an investor in the distribution phase.Lori is a teacher. And while her and her husband’s combined salary sufficiently supports their family, she wants to supplement her existing income in order to provide additional support to her widowed mother. So, Lori plans to withdraw 3% from her account each year in order to help her mom pay for some of her living and medical expenses.Lori’s portfolio comprises:15% growth funds25% growth-and-income funds20% equity-income/balanced funds40% bond funds
Even though you have a 100% return on the upside and only a -50% return on the downside, you still ended up with 0 return.
Here’s the example: if you commit, say, half of your capital and can take advantage
Talking Points:Although Portfolio 1 experiences a strong gain in the first year, this gain is more than eliminated in year two. Portfolio 2 experiences a much smaller gain and loss during the two-year period. The lower volatility of returns produces a higher compound return and preserves more portfolio value. Managing volatility is particularly crucial during a market downturn. After experiencing a loss, a portfolio must earn an even higher return in future periods to fully recover to its previous level.Investors should design portfolios to experience less fluctuation in returns. Lower volatility can result in a higher compound return and greater terminal wealth. The photo here shows an investor that on the red track who seems to be happy, while the person on the yellow track looks to be frightened. Which of these two investors do you think is most likely to experience the various points on the Behavioral Finance chart we talked about last week?
There’s no escaping the fact that the market will fluctuate — sometimes for the better, other times for the worse. That’s just the nature of investing. Of course, it’s the bad times we have the most difficulty with. I don’t know if this will help, but if you look back at the stock market’s history since 1900, you’ll see that declines happened and, yes, on a regular basis. They also varied widely in intensity, frequency and length. Routine declines of 5% or more have occurred about three times a year and have lasted an average of 47 days. In contrast, bear markets — when stocks fall 20% or more — have occurred about once every 3½ years and have lasted about 11 months, on average. This table provides a good overview of how often the Dow Jones Industrial Average has dropped since 1900. As you can see, declines are really just par for the course when it comes to investing.
Because market declines can erode principal, they can have a severe effect on portfolios designed to provide income. Let’s look at what history has taught us about some of those inevitable market declines. This is an illustration of the S&P 500 Index monthly returns from January 1, 1931, through December 31, 2011 —. There have been 14 US Recessions — lasting from days to months to years. These bars indicate the duration and severity of these declines, which have ranged from short and mild to long and severe.
Talking Points:This cartogram depicts the world not according to land mass, but by the size of each country’s stock market relative to the world’s total market value (free-float adjusted). Population, gross domestic product, exports, and other economic measures may influence where people invest. But the map offers a different way to view the universe of equity investment opportunities. If markets are efficient, global capital will migrate to destinations offering the most attractive risk-adjusted expected returns. Therefore, the relative size and growth of markets may help in assessing the political, economic, and financial forces at work in countries. The cartogram brings into sharp relief the investible opportunity of each country relative to the world. It avoids distortions that may be created or implied by attention to economic or fundamental statistics, such as population, consumption, trade balances, or GDP. By focusing on an investment metric rather than on economic reports, the chart further reinforces the need for a disciplined, strategic approach to global asset allocation. Of course, the investment world is in motion, and these proportions will change over time as capital flows to markets offering the most attractive returns.
When you think of the weather in San Francisco and Kansas City, do you think it’s the same? While the two cities have a similar average annual temperature of 57° and 54° respectively, they experience dramatically different ranges in temperature. This spread in temperature is the standard deviation. Generally, the weather in San Francisco varies 5° from the average (52° to 62°). However, there is a greater fluctuation in temperature for Kansas City, where the temperature can vary as much as 18° from the average (36° to 72°). Now, consider what this means if applied to your investment portfolio. Although two portfolios can have similar annualized returns, the ride along the way can be significantly different. One portfolio may have a higher standard deviation, reflecting more ups and downs while the other portfolio could have a lower standard deviation, indicating a smoother ride
The standard deviation of a fund measures this risk by measuring the degree to which the fund fluctuates in relation to its mean return, the average return of a fund over a period of time. Variance:A measure of the dispersion of a set of data points around their mean value. Variance is a mathematical expectation of the average squared deviations from the mean.
VUSTX LT Govt8.34%13.65%
Talking Points:The size and BtM effects appear in both US and international markets—strong evidence that the risk factors are systematic across the globe.This graph demonstrates the higher expected returns offered by small cap stocks and value (high-BtM) stocks in the US, non-US developed, and emerging markets. Note that the international and emerging markets data is for a shorter time frame.Small cap stocks are considered riskier than large cap stocks, and value stocks (as defined by a higher book-to-market ratio) are deemed riskier than growth stocks. These higher returns reflect compensation for bearing higher risk. A multifactor approach incorporates both size and value measures—and exposure to non-US markets—in an effort to increase expected returns and reduce portfolio volatility. An effective way to capture these effects is through portfolio structure.
This slide documents the frequency with which the value and size premiums have been positive over various time periods in the international (non-US) developed stock markets from 1975-2011. In the international markets, value stocks have outperformed growth stocks—and small cap stocks have outperformed large cap stocks—in a majority of all rolling return periods measured. The value premium has been strongly positive more often than the size premium. The time periods, which range from five to twenty-five years, are based on annualized returns for rolling 12-month periods (e.g., January-December, February-January, March-February, etc.). The total number of 12-month periods for each time frame is indicated in the footnotes. The set of available data for non-US developed markets is considerably shorter than US markets. As a result, the smaller set of observations can amplify the effect of sustained periods of negative or positive premiums. This may explain part of the frequency difference between the 20-year and 15-year periods for the international small cap premium.
This slide documents the frequency with which the value and size premiums have been positive over various time periods in the US stock market from 1926 to 2011. As the results illustrate, US value stocks have outperformed US growth stocks—and US small cap stocks have outperformed US large cap stocks—in a majority of all the rolling return periods measured. The US value premium has been positive more often than the size premium. The time periods, which range from five to twenty-five years, are based on annualized returns for rolling 12-month periods (e.g., January-December, February-January, March-February, etc.). The total number of 12-month periods for each time frame is indicated in the footnotes.
Thiscurve forms from a graph plotting return and risk indicated by volatility, which is represented by standard deviation. According to the modern portfolio theory, funds lying on the curve are yielding the maximum return possible given the amount of volatility.,
Talking Points:The slide shows the basic allocation of a two-component portfolio, which is named the “Basic Institutional Portfolio” (Model Portfolio 1) in this example. Between 1973 and 2009, Model Portfolio 1 produced an annualized compound return of 9.41% with annualized standard deviation of 11.18%.The next few slides will demonstrate a multifactor approach to portfolio design. The analysis will show how adding major risk measures in the US and non-US markets can increase expected returns and reduce volatility in the portfolio.
Talking Points:Model Portfolio 2 reflects a move from long-term to short-term fixed income. A simple reallocation to the one-year Treasury note index reduced annualized compound return and annualized standard deviation during this time period.This change does not offer a higher return benefit, but it can help advance the overall strategy for an investor who wants to pursue the higher expected returns of equities. This type of investor may be better served holding shorter-term government instruments, then “spending” the risk on greater exposure to equity risk factors (small cap or value), where the expected return premiums are potentially increased.
Talking Points:Model Portfolio 3 incorporates the size effect into the asset allocation by reducing the S&P 500 component from 60% to 30% of the portfolio and committing the difference to US small cap stocks, as represented by the US Small Cap index.This movement from large to small cap US stocks results in a boost to the portfolio’s annualized compound return—but also adds a potent amount of volatility to Model Portfolio 3 (standard deviation).An investor might conclude that this increase in annualized return may not justify a large jump in standard deviation. But this allocation is not yet complete. Acceptance of more risk from the BtM effect offers a compelling example of diversification’s potential.
Talking Points:Model Portfolio 4 shows the historical benefit of adding value stocks in both small and large cap measures to the portfolio allocation. This is achieved by reducing the US small cap component from 30% to 15%—and moving the allocation to 15% US Large Value and 15% Targeted Value Indexes.The portfolio now has more exposure to value, which boosts annualized return while reducing volatility. The reintroduction of larger company size (from small cap to large value) counteracts the higher volatility of small value stock exposure in the Targeted Value Index.Now compare Model Portfolio 4 to the original 60/40 balanced strategy in Model Portfolio 1. Adding higher weights of small cap and value risk dimensions raised the portfolio’s annualized compound return; however, this required acceptance of higher annualized standard deviation. There is one more step in this structured tradeoff example—and it is found outside the US.
Talking Points:Model Portfolio 5 completes this multifactor construction by diversifying outside the US. All four US asset classes are reduced by half, from 15% to 7.5% allocations, and the balance is apportioned equally to five non-US asset classes—international large, small, large value, and small value indexes, and emerging markets blended index.The portfolio’s 60% equity allocation is now evenly split between the US and international markets, with roughly equal exposures to size and BtM. The historical data for the performance period shows Model Portfolio 5 producing the highest annualized compound return of all the portfolios, without an increase in volatility. In fact, adding the global component reduces the variability in the portfolio’s return due to the lower correlation of international and US risk dimensions. Compared to the original 60/40 balanced strategy, Model Portfolio 5 offers higher annualized return with only slightly higher volatility. A globally diversified allocation harnesses the power of markets, manages the risk-return tradeoff, provides broad diversification, and offers calculated exposure to compensating risk factors through structured investing.
Talking Points:Equities can reward investors who maintain a long-term outlook. But inconsistent short-term performance may test one’s commitment to a long-term strategy. This slide reveals how such temptations may arise—and the dangers of yielding to them. Since 1926, the S&P 500 Index has offered an annualized compound return far above the return on one-month Treasury bills. This long-term effect confirms the higher returns offered by equities. During the seventeen-year sub-period between 1965 and 1981, T-bills slightly outperformed stocks, illustrating that the equity premium is not reliably positive.
These are actual results based off of a hypothetical 20 year portfolio of:30% Barclays Munis25% Russell 1000 Growth10% MSCI EAFE10% Russell 200025% Russell 1000 ValueNote that threshold rebalancing is the choice method of portfolio management. When the allocation to, say, large cap value deviates by 20% of the target allocation or, in this case, 20% of 25% is 5%, so if it is out of balance by 5% or more, then the portfolio is rebalanced. Systematic rebalancing, as in scenario 2, is better than no rebalancing at all, but will likely incur unnecessary trading costs. Perhaps the most significant benefit to rebalancing is the selling of overvalued asset classes as they have appreciated in the portfolio (causing a break through the 20% target on the upside, and the buying of undervalued assets on the 20% downside)
Talking Points: This slide shows performance of a balanced investment strategy following a few historical crises. Each crisis is labeled with the month and year that it occurred or peaked. The subsequent one-, three-, and five-year annualized returns start from the first day of the month following each crisis. Although a global investment strategy would have suffered losses immediately following most events, the financial markets recovered over time, as indicated by the positive three- and five-year annualized returns. Negative events such as these may tempt investors to flee the financial markets. But diversification and a long-term perspective can help investors apply discipline to ride out the storm.A quick note: as of today, the S&P 500 is up roughly 54% since september 29th 2008. Composition of the Normal Balanced Strategy:IndexPercentS&P 500 Index 12%Fama/French US Large Cap Value Index 12%Fama/French US Small Cap Index 6%Fama/French US Small Cap Value Index 6%Dow Jones Wilshire REIT Index 6%Fama/French International Value Index 6%International Small Cap Index 3%International Small Cap Value Index 3%MSCI Emerging Markets Index 1.8%Fama/French Emerging Markets Value Index 1.8%Fama/French Emerging Markets Small Cap Index 2.4%Merrill Lynch One-Year US Treasury Note Index 10%Citigroup World Government 10%Bond Index 1-3 Years (hedged) Lehman Brothers Treasury Bond Index 1-5 Years 10%Citigroup World Government 10%Bond Index 1-5 Years (hedged)
Severe declines such as the 2000-2002 bear market can deplete principal and seriously distort the amount of income withdrawn from a portfolio.A hypothetical initial investment of $100,000 in the S&P 500 Index on March 24, 2000, with monthly withdrawals totaling 5% annually and increasing 4% each year to account for inflation, would have fallen to $43,961 — less than half the original amount. Let’s look at what happened to the withdrawal rate during that time frame.[Note to presenter: Advance slide to show the rising withdrawal rate fever line.]By October 9, 2002, it would have increased to 12.3% — more than twice the initial withdrawal rate of 5%.[Note to presenter: The 12.3% withdrawal rate is calculated by dividing the total amount withdrawn in the third year, which was $5,408 ($5,000 increasing by 4% each year), by $43,961 (the ending value).]By the way, the total amount withdrawn over the entire period — from March 24, 2000, through October 9, 2002 — was $12,904. Clearly, this would not be a sustainable arrangement for most investors. As you can see from this illustration, the preservation of principal in declining markets — as well as growth of capital — is integral to retirement planning. Moreover, investors seeking a sustainable source of income might want to consider the potential benefits of professionally managed investments rather than investments in an index. I’ll discuss these benefits in a moment.Finally, investors at this stage should seek effective strategies that can provide downside resilience.
“We do not have, never have had, and never will have an opinion about where the stock market, interest rates, or business activity will be a year from now.”That’s not just my opinion; it’s the view of Warren Buffett, the nation’s most famous investor. Mr. Buffet included this statement in his 1988 letter to the shareholders of Berkshire Hathaway.We don’t know what will happen to the market either. But there are a few things on which we can all agree.
When investing in an uncertain market, here are some simple rules to remember:Set realistic expectationsYou may not be able to predict the market, but you can learn from history. As we’ve seen, financial markets can go up, go down or even stay flat. In addition, we’ve recognized that market declines are natural and have eventually ended. By looking at different types of investments and their historical averages, you can gain a better perspective in order to set realistic expectations and assess your tolerance for volatility.Stick to sound investment strategiesWe discussed three specific techniques — buy and hold, regular investing and diversification — and the various benefits they provide if practiced consistently. These strategies can help you effectively cope with market uncertainty and keep you focused on your long-term financial goals.Customize your portfolioDifferent investors have different needs, depending on their investment phase, financial goals and income requirements. If one portfolio doesn’t fit all investors, the same is true for your portfolio at different stages of your life. Whether you’re in the accumulation phase or the distribution phase, you can customize your portfolio to suit your investment objective.Invest for the long termDuring periods of market uncertainty, it’s critical that you stay committed to your long-term fundamentals. Be patient and ride out the waves. Bull and bear markets come and go. Successful investors stay the course.