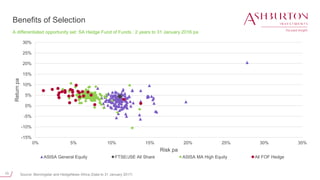
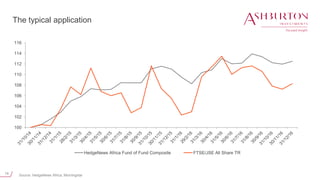
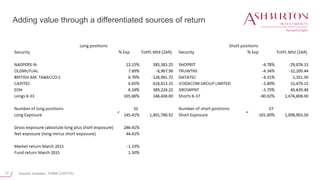
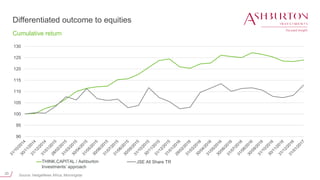
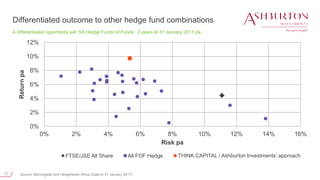
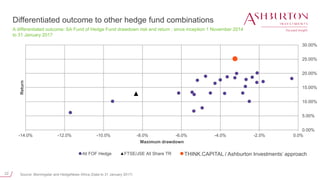
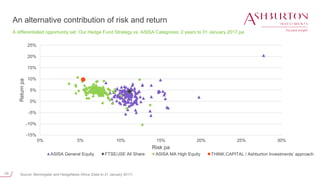
Ashburton Select
Retail Investor Hedge
Fund of Funds
Why investors want hedge funds
2
People
Ashburton teams to support through:
• Infrastructure
• Risk oversight
• Governance
Appointed Investment manager to Ashburton
Select Retail Investor Hedge Fund of Funds:
Elmien Wagenaar
THINK.CAPITAL Investment Management
Elmien has 16 years’ investment experience,
14 years of analysing and investing in hedge funds
locally and globally. During this time she gained
extensive knowledge of SA hedge fund industry /
landscape.
3
Portfolio manager actual track record (R2bn portfolio), Analyst from 2002-2004, co-manager 2005, portfolio manager 2006 - 2015
Jan Feb Mar Apr May Jun Jul Aug Sep Oct Nov Dec Year
2002 0.98% 0.98%
2003 0.98% 0.98% -0.14% 2.84% 6.22% 3.43% 6.50% 1.82% 1.24% 3.68% 3.18% 2.71% 38.77%
2004 1.30% 2.13% 3.11% -0.10% 0.54% 2.47% 1.68% 2.12% 3.32% 3.10% 3.43% 2.50% 28.74%
2005 1.58% 1.59% -0.60% -0.96% 2.54% 1.80% 4.19% 2.28% 1.74% -0.52% 3.23% 3.53% 22.23%
2006 5.91% 1.09% 2.21% 1.62% -0.67% -2.42% 1.58% 2.34% 0.79% 3.12% 3.32% 2.61% 23.45%
2007 3.39% 2.23% 3.18% 4.66% 3.53% -0.98% -0.17% 0.18% 2.93% 1.82% -0.65% 0.72% 22.70%
2008 -3.22% 1.93% -1.71% 0.33% 0.48% -3.57% -1.63% 2.02% -3.17% -3.50% -1.79% 0.24% -12.99%
2009 0.89% -1.90% 0.85% 1.16% 1.54% 1.73% 3.03% 0.78% 0.03% 0.71% -0.90% 1.91% 10.20%
2010 1.58% 0.55% 1.31% 0.65% -1.22% -0.68% 0.22% 0.29% 1.37% 1.31% 0.96% 0.74% 7.28%
2011 1.71% 0.67% 0.69% 0.56% 0.40% -0.10% 0.71% 0.08% 0.56% 1.25% 0.78% 1.68% 9.35%
2012 2.80% 0.92% 2.24% 0.11% 1.15% 0.41% 0.06% 0.93% 1.99% 2.25% 0.39% 0.99% 15.17%
2013 3.72% 0.00% 0.73% -1.19% 0.64% 0.93% 1.15% 1.91% 2.60% 1.66% 0.55% 1.90% 15.51%
2014 -0.32% 2.47% 0.81% 1.44% 1.75% 0.96% 1.86% -0.36% 0.63% 2.02% 0.90% 1.44% 14.42%
2015 1.28% 2.91% 2.35% 1.50% 0.94% -0.88% 8.33%
Fund manager’s track record
Source: Citadel Asset Management
Summary: 13 year track record Fund JSE ALBI
% Negative Months 17.90% 37.10% 29.10%
Maximum Drawdown -13.90% -40.40% -7.90%
Maximum Monthly Drawdown -3.60% -13.20% -4.60%
Volatility 5.80% 16.10% 6.70%
Annualised Return 15.60% 17.80% 9.60%
4
Fund manager’s track record
Source: Realfin Fund Services
RCIS THINK Growth QI Hedge Fund
Jan Feb Mar Apr May Jun Jul Aug Sep Oct Nov Dec Year
2014 0.29% 2.27% 2.56%
2015 1.34% 2.84% 3.07% 1.32% 0.66% 0.27% 2.64% 0.36% 1.75% 2.65% 2.55% 0.63% 21.96%
2016 -2.75% -0.51% 1.66% 0.36% 2.86% -0.39% -0.33% 1.79% -0.54% -0.88% -1.48% -0.17% -0.94%
Summary: 26 month track record Fund JSE
% Negative Months 30.80% 46.20%
Maximum Drawdown -3.25% -8.33%
Maximum Monthly Drawdown -2.675% -3.295%
Volatility 5.20% 10.40%
Annualised Return 10.11% 3.73%
5
The hedge fund industry
6
What is a hedge fund?
• “Hedging" roughly means managing risk, but it does not mean eliminating all risk
The verb 'to hedge' derives from the noun ‘hedge’, that is, a fence made from a row of bushes or trees. These hedges
were normally made from the spiny Hawthorn, which makes an impenetrable hedge when laid. To hedge a piece of
land was to limit it in terms of size and this gave rise to the 'secure, limited risk' meaning.
• Hedging is also known outside the fund industry
• Farmers who sell their crop ahead of time at a fixed price, to “hedge” against changing grain prices
• Airline companies buying oil futures to “hedge” against fuel increases
• In a fund, a money manager employs a particular hedging technique to mitigate a particular type of risk, but also
to express certain views.
• One must ascertain on a case by case basis therefore:
– what risks a fund hedges;
– how it hedges against this risk; and
– what portion it hedges.
• The above is crucial to understand a fund's performance.
7
Benefits of Hedge Funds
A differentiated opportunity set: SA Hedge Funds vs. ASISA Categories: 2 years to 31 January 2017 pa
Source: Morningstar and HedgeNews Africa (Data to 31 January 2017)
-15%
-10%
-5%
0%
5%
10%
15%
20%
25%
30%
0% 5% 10% 15% 20% 25% 30% 35%
Returnpa
Risk pa
ASISA General Equity FTSE/JSE All Share
8
Benefits of Hedge Funds
A differentiated opportunity set: SA Hedge Funds vs. ASISA Categories: 2 years to 31 January 2017 pa
Source: Morningstar and HedgeNews Africa (Data to 31 January 2017)
-15%
-10%
-5%
0%
5%
10%
15%
20%
25%
30%
0% 5% 10% 15% 20% 25% 30% 35%
Returnpa
Risk pa
ASISA General Equity FTSE/JSE All Share ASISA MA High Equity
9
Benefits of Hedge Funds
A differentiated opportunity set: SA Hedge Funds vs. ASISA Categories: 2 years to 31 January 2017 pa
Source: Morningstar and HedgeNews Africa (Data to 31 January 2017)
-15%
-10%
-5%
0%
5%
10%
15%
20%
25%
30%
0% 5% 10% 15% 20% 25% 30% 35%
Returnpa
Risk pa
ASISA General Equity FTSE/JSE All Share ASISA MA High Equity All ZAR Hedge Funds
10
Benefits of Selection
A differentiated opportunity set: SA Hedge Fund of Funds : 2 years to 31 January 2016 pa
Source: Morningstar and HedgeNews Africa (Data to 31 January 2017)
-15%
-10%
-5%
0%
5%
10%
15%
20%
25%
30%
0% 5% 10% 15% 20% 25% 30% 35%
Returnpa
Risk pa
ASISA General Equity FTSE/JSE All Share ASISA MA High Equity All FOF Hedge
11
The hedge fund industry
• Risk return characteristics of SA hedge funds are widely
dispersed
• One hedge fund does not span the entire opportunity set
• Different subsets of hedge funds can create more
predictable, yet different outcomes
The case for a niche multi manager offering
12
Offshore experience
For the period 2006 – 2015
Source: Morningstar & Lipper TASS database
13
0
200
400
600
800
1000
1200
1400
1600
30/9/04
31/12/04
31/3/05
30/6/05
30/9/05
31/12/05
31/3/06
30/6/06
30/9/06
31/12/06
31/3/07
30/6/07
30/9/07
31/12/07
31/3/08
30/6/08
30/9/08
31/12/08
31/3/09
30/6/09
30/9/09
31/12/09
31/3/10
30/6/10
30/9/10
31/12/10
31/3/11
30/6/11
30/9/11
31/12/11
31/3/12
30/6/12
30/9/12
31/12/12
31/3/13
30/6/13
30/9/13
31/12/13
31/3/14
30/6/14
30/9/14
31/12/14
31/3/15
30/6/15
30/9/15
31/12/15
31/3/16
30/6/16
30/9/16
L/S 1 L/S 2
Selection risk
Equity L/S example
Source: HedgeNews Africa (data from 30 September 2004 to 31 December 2016)
Risk
• Strategy Risk
• Concentration
• Correlation
• Liquidity and Leverage
• Complexity
• Conviction
14x money
back
7x
money
back
14
The typical application
Source: HedgeNews Africa, Morningstar
100
102
104
106
108
110
112
114
116
HedgeNews Africa Fund of Fund Composite FTSE/JSE All Share TR
15
Our differentiation
Source: HedgeNews Africa, Morningstar
100
105
110
115
120
125
130
HedgeNews Africa Fund of Fund Composite FTSE/JSE All Share TR RCIS THINK Growth QI Hedge FundTHINK.CAPITAL / Ashburton Investments’
approach
16
How are we different?
• Some investors with a higher tolerance for volatility may be reluctant to invest in hedge
funds over the long term
• An unintended consequence:
• risk exposure remains largely to the direction of equity markets and
• the investment portfolios cannot gain from any decline in the share prices of equities.
• Our strategy offers an exposure to hedge fund skills, but
• does not propose a different risk profile to equity investors,
• rather a differentiated risk exposure as an alternative source of return.
• Adding value through
• Including more equity opportunities
• Adjusting mandates
• Balanced compounding
17
Adding value through a differentiated sources of return
Source: Investec, THINK.CAPITAL
18
Adding value through mandate adjustments
Source: Morningstar and HedgeNews Africa (Data to 31 January 2017)
-3.00%
-2.50%
-2.00%
-1.50%
-1.00%
-0.50%
0.00%
0.50%
1.00%
1.50%
2.00%
2.50%
3.00%
3.50%
4.00%
4.50%
5.00%
5.50%
0
20
40
60
80
100
120
140
160
Existing (actual) monthly (RHS) New (actual) monthly (RHS) Existing fund (actual) New mandate (actual)
A differentiated opportunity set: 42.42% vs 33.9%
19
20.06%
45.90%
3.23%
-22.68%
-30.0%
-20.0%
-10.0%
0.0%
10.0%
20.0%
30.0%
40.0%
50.0%
RCIS THINK Growth QI Hedge
Fund (Actual)
FTSE/JSE All Share
Market Up Market Down
Adding value through balanced compounding
Upside versus downside
Realfin Fund Services, Morningstar, THINK.CAPITAL (data from 1 November 2014 to 31 January 2017)
THINK.CAPITAL / Ashburton
Investments’ approach
Downside protection analysis
THINK.CAPITAL/Ashburton approach (actual) vs FTSE/JSE
All Share
27 months
since
inception
Benchmark down  Benchmark up 
Return 3.23% 20.06%
Participation -14.24% 43.71%
Downside
Count 5 3
% Down 41.67% 20.00%
20
90
95
100
105
110
115
120
125
130
RCIS THINK Growth QI Hedge Fund JSE All Share TR
Differentiated outcome to equities
Cumulative return
THINK.CAPITAL / Ashburton
Investments’ approach
Source: HedgeNews Africa, Morningstar
21
0%
2%
4%
6%
8%
10%
12%
0% 2% 4% 6% 8% 10% 12% 14% 16%
Returnpa
Risk pa
FTSE/JSE All Share All FOF Hedge RCIS THINK Growth QI Hedge Fund
Differentiated outcome to other hedge fund combinations
A differentiated opportunity set: SA Hedge Funds of Funds : 2 years to 31 January 2017 pa
Source: Morningstar and HedgeNews Africa (Data to 31 January 2017)
THINK.CAPITAL / Ashburton Investments’ approach
22
0.00%
5.00%
10.00%
15.00%
20.00%
25.00%
30.00%
-14.0% -12.0% -10.0% -8.0% -6.0% -4.0% -2.0% 0.0%
Return
Maximum drawdown
All FOF Hedge FTSE/JSE All Share TR RCIS THINK Growth QI Hedge Fund
Differentiated outcome to other hedge fund combinations
A differentiated outcome: SA Fund of Hedge Fund drawdown risk and return : since inception 1 November 2014
to 31 January 2017
Source: Morningstar and HedgeNews Africa (Data to 31 January 2017)
THINK.CAPITAL / Ashburton Investments’ approach
23
Why this Fund?
Investor profile
The Fund is for investors looking:
• to add more growth potential to their portfolios, but are wary about extreme market swings
• for broader diversification into equity markets, including shorting
• for the benefit of effective compounding of returns.
By:
• foregoing the need for absolute returns all of the time,
• strategically adjusting specific mandates, and
• combining these for a specific outcome,
investors currently invested in equities can be accommodated in the Fund without changing their long term
risk/return profile.
24
An alternative contribution of risk and return
A differentiated opportunity set: Our Hedge Fund Strategy vs. ASISA Categories: 2 years to 31 January 2017 pa
Source: Morningstar and HedgeNews Africa (Data to 31 January 2017)
-15%
-10%
-5%
0%
5%
10%
15%
20%
25%
0% 5% 10% 15% 20% 25% 30%
Returnpa
Risk pa
ASISA General Equity FTSE/JSE All Share ASISA MA High Equity RCIS THINK Growth QI Hedge FundTHINK.CAPITAL / Ashburton Investments’ approach
25
Ashburton Select
Retail Investor Hedge
Fund of Funds
26
Fund information
Thank you
Disclaimer
Ashburton Fund Managers (Proprietary) Limited (Reg No 2002/013187/07) (“Ashburton”) is a licensed Financial Services Provider (“FSP”) in terms of
the Financial Advisory and Intermediary Services Act, 37 of 2002 (“FAIS Act”), with FSP number 40169, regulated by the Financial Services Board.
This document and any other information supplied in connection with the financial product (“product”) is not “advice” as defined and/or contemplated in
terms of the FAIS Act and investors are encouraged to obtain their own independent advice prior to investing in the product. Any investment is
speculative and involves significant risks and therefore, prior to investing, investors should fully understand the product and any risks associated with
the product.
Investments in securities are generally medium to long term investments. The value of the product may go down as well as up and past performance is
not necessarily a guide to the future.
Ashburton and its affiliates disclaims and assumes no liability for any loss or damage (direct, indirect or consequential) that may be suffered from using
or relying on the information contained herein.

Ashburton March 2017

  • 1.
    Ashburton Select Retail InvestorHedge Fund of Funds Why investors want hedge funds
  • 2.
    2 People Ashburton teams tosupport through: • Infrastructure • Risk oversight • Governance Appointed Investment manager to Ashburton Select Retail Investor Hedge Fund of Funds: Elmien Wagenaar THINK.CAPITAL Investment Management Elmien has 16 years’ investment experience, 14 years of analysing and investing in hedge funds locally and globally. During this time she gained extensive knowledge of SA hedge fund industry / landscape.
  • 3.
    3 Portfolio manager actualtrack record (R2bn portfolio), Analyst from 2002-2004, co-manager 2005, portfolio manager 2006 - 2015 Jan Feb Mar Apr May Jun Jul Aug Sep Oct Nov Dec Year 2002 0.98% 0.98% 2003 0.98% 0.98% -0.14% 2.84% 6.22% 3.43% 6.50% 1.82% 1.24% 3.68% 3.18% 2.71% 38.77% 2004 1.30% 2.13% 3.11% -0.10% 0.54% 2.47% 1.68% 2.12% 3.32% 3.10% 3.43% 2.50% 28.74% 2005 1.58% 1.59% -0.60% -0.96% 2.54% 1.80% 4.19% 2.28% 1.74% -0.52% 3.23% 3.53% 22.23% 2006 5.91% 1.09% 2.21% 1.62% -0.67% -2.42% 1.58% 2.34% 0.79% 3.12% 3.32% 2.61% 23.45% 2007 3.39% 2.23% 3.18% 4.66% 3.53% -0.98% -0.17% 0.18% 2.93% 1.82% -0.65% 0.72% 22.70% 2008 -3.22% 1.93% -1.71% 0.33% 0.48% -3.57% -1.63% 2.02% -3.17% -3.50% -1.79% 0.24% -12.99% 2009 0.89% -1.90% 0.85% 1.16% 1.54% 1.73% 3.03% 0.78% 0.03% 0.71% -0.90% 1.91% 10.20% 2010 1.58% 0.55% 1.31% 0.65% -1.22% -0.68% 0.22% 0.29% 1.37% 1.31% 0.96% 0.74% 7.28% 2011 1.71% 0.67% 0.69% 0.56% 0.40% -0.10% 0.71% 0.08% 0.56% 1.25% 0.78% 1.68% 9.35% 2012 2.80% 0.92% 2.24% 0.11% 1.15% 0.41% 0.06% 0.93% 1.99% 2.25% 0.39% 0.99% 15.17% 2013 3.72% 0.00% 0.73% -1.19% 0.64% 0.93% 1.15% 1.91% 2.60% 1.66% 0.55% 1.90% 15.51% 2014 -0.32% 2.47% 0.81% 1.44% 1.75% 0.96% 1.86% -0.36% 0.63% 2.02% 0.90% 1.44% 14.42% 2015 1.28% 2.91% 2.35% 1.50% 0.94% -0.88% 8.33% Fund manager’s track record Source: Citadel Asset Management Summary: 13 year track record Fund JSE ALBI % Negative Months 17.90% 37.10% 29.10% Maximum Drawdown -13.90% -40.40% -7.90% Maximum Monthly Drawdown -3.60% -13.20% -4.60% Volatility 5.80% 16.10% 6.70% Annualised Return 15.60% 17.80% 9.60%
  • 4.
    4 Fund manager’s trackrecord Source: Realfin Fund Services RCIS THINK Growth QI Hedge Fund Jan Feb Mar Apr May Jun Jul Aug Sep Oct Nov Dec Year 2014 0.29% 2.27% 2.56% 2015 1.34% 2.84% 3.07% 1.32% 0.66% 0.27% 2.64% 0.36% 1.75% 2.65% 2.55% 0.63% 21.96% 2016 -2.75% -0.51% 1.66% 0.36% 2.86% -0.39% -0.33% 1.79% -0.54% -0.88% -1.48% -0.17% -0.94% Summary: 26 month track record Fund JSE % Negative Months 30.80% 46.20% Maximum Drawdown -3.25% -8.33% Maximum Monthly Drawdown -2.675% -3.295% Volatility 5.20% 10.40% Annualised Return 10.11% 3.73%
  • 5.
  • 6.
    6 What is ahedge fund? • “Hedging" roughly means managing risk, but it does not mean eliminating all risk The verb 'to hedge' derives from the noun ‘hedge’, that is, a fence made from a row of bushes or trees. These hedges were normally made from the spiny Hawthorn, which makes an impenetrable hedge when laid. To hedge a piece of land was to limit it in terms of size and this gave rise to the 'secure, limited risk' meaning. • Hedging is also known outside the fund industry • Farmers who sell their crop ahead of time at a fixed price, to “hedge” against changing grain prices • Airline companies buying oil futures to “hedge” against fuel increases • In a fund, a money manager employs a particular hedging technique to mitigate a particular type of risk, but also to express certain views. • One must ascertain on a case by case basis therefore: – what risks a fund hedges; – how it hedges against this risk; and – what portion it hedges. • The above is crucial to understand a fund's performance.
  • 7.
    7 Benefits of HedgeFunds A differentiated opportunity set: SA Hedge Funds vs. ASISA Categories: 2 years to 31 January 2017 pa Source: Morningstar and HedgeNews Africa (Data to 31 January 2017) -15% -10% -5% 0% 5% 10% 15% 20% 25% 30% 0% 5% 10% 15% 20% 25% 30% 35% Returnpa Risk pa ASISA General Equity FTSE/JSE All Share
  • 8.
    8 Benefits of HedgeFunds A differentiated opportunity set: SA Hedge Funds vs. ASISA Categories: 2 years to 31 January 2017 pa Source: Morningstar and HedgeNews Africa (Data to 31 January 2017) -15% -10% -5% 0% 5% 10% 15% 20% 25% 30% 0% 5% 10% 15% 20% 25% 30% 35% Returnpa Risk pa ASISA General Equity FTSE/JSE All Share ASISA MA High Equity
  • 9.
    9 Benefits of HedgeFunds A differentiated opportunity set: SA Hedge Funds vs. ASISA Categories: 2 years to 31 January 2017 pa Source: Morningstar and HedgeNews Africa (Data to 31 January 2017) -15% -10% -5% 0% 5% 10% 15% 20% 25% 30% 0% 5% 10% 15% 20% 25% 30% 35% Returnpa Risk pa ASISA General Equity FTSE/JSE All Share ASISA MA High Equity All ZAR Hedge Funds
  • 10.
    10 Benefits of Selection Adifferentiated opportunity set: SA Hedge Fund of Funds : 2 years to 31 January 2016 pa Source: Morningstar and HedgeNews Africa (Data to 31 January 2017) -15% -10% -5% 0% 5% 10% 15% 20% 25% 30% 0% 5% 10% 15% 20% 25% 30% 35% Returnpa Risk pa ASISA General Equity FTSE/JSE All Share ASISA MA High Equity All FOF Hedge
  • 11.
    11 The hedge fundindustry • Risk return characteristics of SA hedge funds are widely dispersed • One hedge fund does not span the entire opportunity set • Different subsets of hedge funds can create more predictable, yet different outcomes The case for a niche multi manager offering
  • 12.
    12 Offshore experience For theperiod 2006 – 2015 Source: Morningstar & Lipper TASS database
  • 13.
  • 14.
    14 The typical application Source:HedgeNews Africa, Morningstar 100 102 104 106 108 110 112 114 116 HedgeNews Africa Fund of Fund Composite FTSE/JSE All Share TR
  • 15.
    15 Our differentiation Source: HedgeNewsAfrica, Morningstar 100 105 110 115 120 125 130 HedgeNews Africa Fund of Fund Composite FTSE/JSE All Share TR RCIS THINK Growth QI Hedge FundTHINK.CAPITAL / Ashburton Investments’ approach
  • 16.
    16 How are wedifferent? • Some investors with a higher tolerance for volatility may be reluctant to invest in hedge funds over the long term • An unintended consequence: • risk exposure remains largely to the direction of equity markets and • the investment portfolios cannot gain from any decline in the share prices of equities. • Our strategy offers an exposure to hedge fund skills, but • does not propose a different risk profile to equity investors, • rather a differentiated risk exposure as an alternative source of return. • Adding value through • Including more equity opportunities • Adjusting mandates • Balanced compounding
  • 17.
    17 Adding value througha differentiated sources of return Source: Investec, THINK.CAPITAL
  • 18.
    18 Adding value throughmandate adjustments Source: Morningstar and HedgeNews Africa (Data to 31 January 2017) -3.00% -2.50% -2.00% -1.50% -1.00% -0.50% 0.00% 0.50% 1.00% 1.50% 2.00% 2.50% 3.00% 3.50% 4.00% 4.50% 5.00% 5.50% 0 20 40 60 80 100 120 140 160 Existing (actual) monthly (RHS) New (actual) monthly (RHS) Existing fund (actual) New mandate (actual) A differentiated opportunity set: 42.42% vs 33.9%
  • 19.
    19 20.06% 45.90% 3.23% -22.68% -30.0% -20.0% -10.0% 0.0% 10.0% 20.0% 30.0% 40.0% 50.0% RCIS THINK GrowthQI Hedge Fund (Actual) FTSE/JSE All Share Market Up Market Down Adding value through balanced compounding Upside versus downside Realfin Fund Services, Morningstar, THINK.CAPITAL (data from 1 November 2014 to 31 January 2017) THINK.CAPITAL / Ashburton Investments’ approach Downside protection analysis THINK.CAPITAL/Ashburton approach (actual) vs FTSE/JSE All Share 27 months since inception Benchmark down  Benchmark up  Return 3.23% 20.06% Participation -14.24% 43.71% Downside Count 5 3 % Down 41.67% 20.00%
  • 20.
    20 90 95 100 105 110 115 120 125 130 RCIS THINK GrowthQI Hedge Fund JSE All Share TR Differentiated outcome to equities Cumulative return THINK.CAPITAL / Ashburton Investments’ approach Source: HedgeNews Africa, Morningstar
  • 21.
    21 0% 2% 4% 6% 8% 10% 12% 0% 2% 4%6% 8% 10% 12% 14% 16% Returnpa Risk pa FTSE/JSE All Share All FOF Hedge RCIS THINK Growth QI Hedge Fund Differentiated outcome to other hedge fund combinations A differentiated opportunity set: SA Hedge Funds of Funds : 2 years to 31 January 2017 pa Source: Morningstar and HedgeNews Africa (Data to 31 January 2017) THINK.CAPITAL / Ashburton Investments’ approach
  • 22.
    22 0.00% 5.00% 10.00% 15.00% 20.00% 25.00% 30.00% -14.0% -12.0% -10.0%-8.0% -6.0% -4.0% -2.0% 0.0% Return Maximum drawdown All FOF Hedge FTSE/JSE All Share TR RCIS THINK Growth QI Hedge Fund Differentiated outcome to other hedge fund combinations A differentiated outcome: SA Fund of Hedge Fund drawdown risk and return : since inception 1 November 2014 to 31 January 2017 Source: Morningstar and HedgeNews Africa (Data to 31 January 2017) THINK.CAPITAL / Ashburton Investments’ approach
  • 23.
    23 Why this Fund? Investorprofile The Fund is for investors looking: • to add more growth potential to their portfolios, but are wary about extreme market swings • for broader diversification into equity markets, including shorting • for the benefit of effective compounding of returns. By: • foregoing the need for absolute returns all of the time, • strategically adjusting specific mandates, and • combining these for a specific outcome, investors currently invested in equities can be accommodated in the Fund without changing their long term risk/return profile.
  • 24.
    24 An alternative contributionof risk and return A differentiated opportunity set: Our Hedge Fund Strategy vs. ASISA Categories: 2 years to 31 January 2017 pa Source: Morningstar and HedgeNews Africa (Data to 31 January 2017) -15% -10% -5% 0% 5% 10% 15% 20% 25% 0% 5% 10% 15% 20% 25% 30% Returnpa Risk pa ASISA General Equity FTSE/JSE All Share ASISA MA High Equity RCIS THINK Growth QI Hedge FundTHINK.CAPITAL / Ashburton Investments’ approach
  • 25.
  • 26.
  • 27.
  • 28.
    Disclaimer Ashburton Fund Managers(Proprietary) Limited (Reg No 2002/013187/07) (“Ashburton”) is a licensed Financial Services Provider (“FSP”) in terms of the Financial Advisory and Intermediary Services Act, 37 of 2002 (“FAIS Act”), with FSP number 40169, regulated by the Financial Services Board. This document and any other information supplied in connection with the financial product (“product”) is not “advice” as defined and/or contemplated in terms of the FAIS Act and investors are encouraged to obtain their own independent advice prior to investing in the product. Any investment is speculative and involves significant risks and therefore, prior to investing, investors should fully understand the product and any risks associated with the product. Investments in securities are generally medium to long term investments. The value of the product may go down as well as up and past performance is not necessarily a guide to the future. Ashburton and its affiliates disclaims and assumes no liability for any loss or damage (direct, indirect or consequential) that may be suffered from using or relying on the information contained herein.