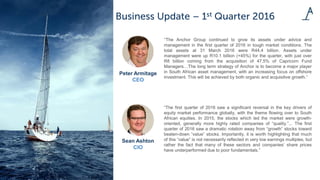
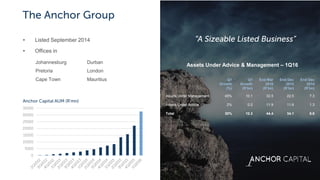
The Anchor Group continued to grow its assets under management in the first quarter of 2016 despite tough market conditions. Total assets reached R44.4 billion, with assets under management up R10.1 billion (+45%) due to the acquisition of Capricorn Fund Managers. Anchor's long term strategy is to become a major player in South African and offshore asset management through both organic and acquisitive growth. [END SUMMARY]
Netwealth portfolio construction series - Discover cost effective investment ...netwealthInvest
Part of Netwealth's portfolio construction webinar series - Tracey McNaughton, Head of Investment at UBS presented to an audience on 26th October 2016 about an evolved strategy for today's investment climate.
Certitude Global Investing Insights - May 2013certitudeglobal
The Certitude Global Insights is produced each quarter, and provides a summary of key global investment themes over the last quarter coupled with investment insights from our fund managers. Highlights this quarter include: 10 Reasons for Global Equity Income, Breaking the Bad News Cycle, Watch Capital Flows for the Central Bank’s Next Move & Easy Eurozone Trades are Running Out of Road.
Hong Kong Stock Research. What Drives Hong Kong Stock Price Out Performance. ...lvxresearch
What Drives Company Stock Price Out Performance in Hong Kong? What Fundamental Stock Investment Strategies Have Been Working Consistently in Hong Kong? What Ranked Metrics Have Historically Signalled Stock Prices Will Outperform?
Our Paid Monthly Research Service on the Australian (ASX) and Hong Kong Markets (HSE) Answers all these Questions in a Digestible way for all levels of Investors: www.lvxresearch.com
Sign up for our free market update on the drivers that have historically signalled a change in stock market direction.
Subscribe to our Monthly research at www.lvxresearch.com
Get Loan against property for your personal, commercial or business needs from JM Financial, one of the leading IPO, ESOP and Mutual fund providing company in India. https://jmfl.com/What-We-Do/Fund-Based-Activities
JM Financial's loan against shares enables you to borrow funds against listed securities such as mutual funds, shares, insurance and bonds to meet your current financial needs. Visit for more info: https://jmfl.com/what-we-do/fund-based-activities
Get Loan against property for your personal, commercial or business needs from JM Financial, one of the leading IPO, ESOP and Mutual fund providing company in India. https://jmfl.com/What-We-Do/Fund-Based-Activities
A review of Q4 2015 corporate earnings reveals a significant slowdown in revenue and earnings growth. While these developments have been affected by the sharp decline in commodity prices,they may reveal early signs of recessionary conditions.
The Deloitte CFO Survey 2014 Q2 results - Risk appetite at new highDeloitte UK
Find out more at http://www.deloitte.co.uk/cfosurvey
Risk appetite among the chief financial officers (CFOs) of the UK’s largest companies has reached a seven year high.
- CFO risk appetite hits a seven year high despite economic and financial uncertainties.
- CFOs more positive on government policies and give strong vote of confidence to Bank of England.
- Worries over UK political risks eclipse economic risks for CFOs.
- Credit cheaper and more available than any time in seven years.
This is the 29th quarterly survey of chief financial officers and group finance directors of major companies in the UK.
The Q3 2014 survey took place between 8th and 22nd September.
118 CFOs participated, including the CFOs of 28 FTSE 100 and 40 FTSE 250 companies. The rest were CFOs of other UK-listed companies, large private companies and UK subsidiaries of major companies listed overseas. The combined market value of the 79 UK-listed companies surveyed is £462 billion, or approximately 20% of the UK quoted equity market.
The Deloitte CFO Survey is the only survey of major corporate users of capital that gauges attitudes to valuations, risk and financing.
ASX Share Research What Drives Australian Share Out Performance? LVXResearch.comlvxresearch
What Drives Company Stock Price Out Performance? What Fundamental Stock Investment Strategies Have Been Working Consistently? What Ranked Metrics Have Historically Signalled Stock Prices Will Outperform?
Our Paid Monthly Research Service on the Australian (ASX) and Hong Kong Markets (HSE) Answers all these Questions in a Digestible way for all levels of Investors: www.lvxresearch.com
Sign up for our free market update on the drivers that have historically signalled a change in stock market direction.
Subscribe to our Monthly research at www.lvxresearch.com
Economic Outlook for South Australian Business presentation to Ceda (SA) Darryl Gobbett
Darryl Gobbett, Chief Economist at Baillieu Holst, presents to the Committee for Economic Development of Australia (SA), his economic outlook for South Australia and what that means for local business.
Turin Startup Ecosystem 2024 - Ricerca sulle Startup e il Sistema dell'Innov...Quotidiano Piemontese
Turin Startup Ecosystem 2024
Una ricerca de il Club degli Investitori, in collaborazione con ToTeM Torino Tech Map e con il supporto della ESCP Business School e di Growth Capital
Empowering the Unbanked: The Vital Role of NBFCs in Promoting Financial Inclu...Vighnesh Shashtri
In India, financial inclusion remains a critical challenge, with a significant portion of the population still unbanked. Non-Banking Financial Companies (NBFCs) have emerged as key players in bridging this gap by providing financial services to those often overlooked by traditional banking institutions. This article delves into how NBFCs are fostering financial inclusion and empowering the unbanked.
The Evolution of Non-Banking Financial Companies (NBFCs) in India: Challenges...beulahfernandes8
Role in Financial System
NBFCs are critical in bridging the financial inclusion gap.
They provide specialized financial services that cater to segments often neglected by traditional banks.
Economic Impact
NBFCs contribute significantly to India's GDP.
They support sectors like micro, small, and medium enterprises (MSMEs), housing finance, and personal loans.
Poonawalla Fincorp and IndusInd Bank Introduce New Co-Branded Credit Cardnickysharmasucks
The unveiling of the IndusInd Bank Poonawalla Fincorp eLITE RuPay Platinum Credit Card marks a notable milestone in the Indian financial landscape, showcasing a successful partnership between two leading institutions, Poonawalla Fincorp and IndusInd Bank. This co-branded credit card not only offers users a plethora of benefits but also reflects a commitment to innovation and adaptation. With a focus on providing value-driven and customer-centric solutions, this launch represents more than just a new product—it signifies a step towards redefining the banking experience for millions. Promising convenience, rewards, and a touch of luxury in everyday financial transactions, this collaboration aims to cater to the evolving needs of customers and set new standards in the industry.
how to sell pi coins on Bitmart crypto exchangeDOT TECH
Yes. Pi network coins can be exchanged but not on bitmart exchange. Because pi network is still in the enclosed mainnet. The only way pioneers are able to trade pi coins is by reselling the pi coins to pi verified merchants.
A verified merchant is someone who buys pi network coins and resell it to exchanges looking forward to hold till mainnet launch.
I will leave the telegram contact of my personal pi merchant to trade with.
@Pi_vendor_247
Currently pi network is not tradable on binance or any other exchange because we are still in the enclosed mainnet.
Right now the only way to sell pi coins is by trading with a verified merchant.
What is a pi merchant?
A pi merchant is someone verified by pi network team and allowed to barter pi coins for goods and services.
Since pi network is not doing any pre-sale The only way exchanges like binance/huobi or crypto whales can get pi is by buying from miners. And a merchant stands in between the exchanges and the miners.
I will leave the telegram contact of my personal pi merchant. I and my friends has traded more than 6000pi coins successfully
Tele-gram
@Pi_vendor_247
Even tho Pi network is not listed on any exchange yet.
Buying/Selling or investing in pi network coins is highly possible through the help of vendors. You can buy from vendors[ buy directly from the pi network miners and resell it]. I will leave the telegram contact of my personal vendor.
@Pi_vendor_247
how to sell pi coins in all Africa Countries.DOT TECH
Yes. You can sell your pi network for other cryptocurrencies like Bitcoin, usdt , Ethereum and other currencies And this is done easily with the help from a pi merchant.
What is a pi merchant ?
Since pi is not launched yet in any exchange. The only way you can sell right now is through merchants.
A verified Pi merchant is someone who buys pi network coins from miners and resell them to investors looking forward to hold massive quantities of pi coins before mainnet launch in 2026.
I will leave the telegram contact of my personal pi merchant to trade with.
@Pi_vendor_247
how to swap pi coins to foreign currency withdrawable.DOT TECH
As of my last update, Pi is still in the testing phase and is not tradable on any exchanges.
However, Pi Network has announced plans to launch its Testnet and Mainnet in the future, which may include listing Pi on exchanges.
The current method for selling pi coins involves exchanging them with a pi vendor who purchases pi coins for investment reasons.
If you want to sell your pi coins, reach out to a pi vendor and sell them to anyone looking to sell pi coins from any country around the globe.
Below is the contact information for my personal pi vendor.
Telegram: @Pi_vendor_247
how to sell pi coins in South Korea profitably.DOT TECH
Yes. You can sell your pi network coins in South Korea or any other country, by finding a verified pi merchant
What is a verified pi merchant?
Since pi network is not launched yet on any exchange, the only way you can sell pi coins is by selling to a verified pi merchant, and this is because pi network is not launched yet on any exchange and no pre-sale or ico offerings Is done on pi.
Since there is no pre-sale, the only way exchanges can get pi is by buying from miners. So a pi merchant facilitates these transactions by acting as a bridge for both transactions.
How can i find a pi vendor/merchant?
Well for those who haven't traded with a pi merchant or who don't already have one. I will leave the telegram id of my personal pi merchant who i trade pi with.
Tele gram: @Pi_vendor_247
#pi #sell #nigeria #pinetwork #picoins #sellpi #Nigerian #tradepi #pinetworkcoins #sellmypi
Exploring Abhay Bhutada’s Views After Poonawalla Fincorp’s Collaboration With...beulahfernandes8
The financial landscape in India has witnessed a significant development with the recent collaboration between Poonawalla Fincorp and IndusInd Bank.
The launch of the co-branded credit card, the IndusInd Bank Poonawalla Fincorp eLITE RuPay Platinum Credit Card, marks a major milestone for both entities.
This strategic move aims to redefine and elevate the banking experience for customers.
2. “The Anchor Group continued to grow its assets under advice and
management in the first quarter of 2016 in tough market conditions. The
total assets at 31 March 2016 were R44.4 billion. Assets under
management were up R10.1 billion (+45%) for the quarter, with just over
R8 billion coming from the acquisition of 47.5% of Capricorn Fund
Managers…The long term strategy of Anchor is to become a major player
in South African asset management, with an increasing focus on offshore
investment. This will be achieved by both organic and acquisitive growth.”
“The first quarter of 2016 saw a significant reversal in the key drivers of
equity market performance globally, with the theme flowing over to South
African equities. In 2015, the stocks which led the market were growth-
oriented, generally more highly rated companies of “quality.”... The first
quarter of 2016 saw a dramatic rotation away from “growth” stocks toward
beaten-down “value” stocks. Importantly, it is worth highlighting that much
of this “value” is not necessarily reflected in very low earnings multiples, but
rather the fact that many of these sectors and companies’ share prices
have underperformed due to poor fundamentals.”
Peter Armitage
CEO
Sean Ashton
CIO
3. Top investment
team and
process
Businesses built
to deal with
financial advisors
Access to fund
managers and
top
management
Entrepreneurial
result-driven
approach
Top performing
asset manager
Value-based,
transparent fee
model
Access to special
opportunities
1 2 3 4 5 6 7
4. Anchor is structurally equivalent to a large asset
manager:
• Size, skill and quality of team
• Governance and oversight
• Flagship fund has a 3 year track record
(Anchor BCI Equity Fund)
BUT
can deliver performance normally associated with a
boutique manager 100.00
110.00
120.00
130.00
140.00
150.00
160.00
170.00
180.00
190.00
200.00
210.00
BENCHMARK
FUND
THE ANCHOR BCI EQUITY FUND
PERFORMANCE SINCE INCEPTION
SOURCE: Morningstar; Anchor Capital
Past performance is not necessarily an indication of future performance.
6. Q1
Growth
(%)
Q1
Growth
(R’bn)
End Mar
2016
(R’bn)
End Dec
2015
(R’bn)
End Dec
2014
(R’bn)
Assets Under Management 45% 10.1 32.5 22.5 7.3
Assets Under Advice 2% 0.2 11.9 11.6 1.3
Total 30% 10.3 44.4 34.1 8.6
Assets Under Advice & Management – 1Q16
• Listed September 2014
• Offices in
Johannesburg Durban
Pretoria London
Cape Town Mauritius
7.
8. Global strategy
(London)
Local asset
allocation
Analysts give
bottom-up view
Model portfolio
created
Personalised to
your fund
Fund manager
operates fund
• Global macro strategy, supplemented by bottom up research
• Collective input but single decision making responsibility - no management by committee
• Nimble and able to reposition quickly
9. CIO & Fund Manager
Sean Ashton leads a team of over 20
investment professionals
A dynamic investment process led by high quality,
experienced investment professionals
• Fully fledged team across all asset classes
• Fund managers take ultimate responsibility, with
input from the team
• Weekly formal investment process meetings
• Informal daily investment meetings
• Close proximity working environment facilitating
communication and decision making
10. Nolan Wapenaar
Head: Fixed Interest
Peter Armitage
Balanced
Glen Baker
Head: Alternatives
David Gibb
Offshore
Nick Dennis
Offshore
Peter Little
Offshore
Sean Ashton
CIO and manger of the
Anchor BCI Equity Fund
A full range of investment funds across asset classes
and geographies
Local Offshore
Unitised
• Equity funds
• Income funds
• Regulation 28 fund
• Flexible funds
• Property funds
• Feeder funds
Unitised
• Equity funds
• Income funds
• Flexible funds
Segregated mandates
• Equity
• Balanced
• Yield
• Property
Segregated mandates
• Equity
• Balanced
• Yield
11. We’re valuation-centric but are happy to
pay premium ratings for premium
businesses - where growth outlook,
return metrics and cash flows warrant
this
…and these concepts cannot
be separated
…and a lack thereof deserves a
discount
Entrepreneurial teams are serial
value creators and this often cannot
be captured easily in a
spreadsheet, e.g. Discovery
Concentrated index leads to investments
in mostly poor quality companies rather
than good businesses experiencing
temporary trouble
We don’t put ourselves in one
philosophical box…we’re
neither value or growth
specific investors
12.
13. 133-Jun-16 Anchor Capital
Systematic
Risk
Specific
Risk
Analytics Path
- First step for Scenario
and Sensitivity
analysis
- Important piece for a
macro-based asset
allocation framework
- Crucial starting point
for a risk analysis/
monitoring tool Analysis will focus on the
behavior SA Bonds and
Currency under defined
Global scenarios
14.
15. • The US is growing at a diminishing
rate
• However, since Q4 2015, inflation has
been slowly rising
• Major risk is having the Fed rapidly
rising interest rates to curb inflation in
a no growth environment
Anchor Capital 153-Jun-16
-2
-1
0
1
2
3
4
5
Mar-13 Sep-13 Mar-14 Sep-14 Mar-15 Sep-15 Mar-16
USA Quarterly GDP
-0.5
0
0.5
1
1.5
2
2.5
USA Inflation
Data Source: Thomson Reuters
Inflation Build-up
Data Source: Thomson Reuters
16. GDP = C + I + G + Net Exports
- C: Private Consumption
- I : Private Investments
- G: Government Expenditure
Private investment has been relatively flat the
beginning of 2015 while Government
expenditure has been flat for the period
Biggest drag to USA GDP has been the fall in
private consumption and net exports
163-Jun-16 Anchor Capital
0
0.5
1
1.5
2
Jan-13 Jul-13 Jan-14 Jul-14 Jan-15 Jul-15 Jan-16
USA YoY Private Consumption
Data Source: Thomson Reuters
2.3E+12
2.4E+12
2.5E+12
2.6E+12
2.7E+12
2.8E+12
2.9E+12
3E+12
USA Private Investment and Government Consumption
For the past 3-years
Government Expanditure Private Investments
Data Source: Thomson Reuters
-560
-540
-520
-500
-480
-460
-440
-420
USA Net EXPORTS
Data Source: Thomson Reuters
Still low
17. The US Economy: Labor Market
US labor markets has tightened
significantly
Falling unemployment, low energy
prices and rising hourly wages will
increase consumer purchasing power
Increasing wage costs are not showing
up yet in overall inflation because of the
countervailing impact of oil prices and
import prices
Thus, lower oil prices make it difficult to
judge when wage pressures will
become inflationary
This adds to the upside inflation risk on
the US economy
Anchor Capital 173-Jun-16
0
2
4
6
8
10
12
9.8
10
10.2
10.4
10.6
10.8
Jan-11 Jul-11 Jan-12 Jul-12 Jan-13 Jul-13 Jan-14 Jul-14 Jan-15 Jul-15
US Unemployment Rate vs Real Hourly Wages
Real Hourly Wages US Unemployment Rate
Data Source: Thomson Reuters
0
0.2
0.4
0.6
0.8
1
US Employment Cost Index
Data Source: Thomson Reuters
18. Decline in oil prices has exacerbated deflationary
pressures in the US
Core CPI has been flat with a small up tick towards
the end of 2015
The dollar appreciation relative to its trading partners
has lowered import costs
Competitive pressure on US domestic firms to
reduce prices
This further dampens the headline inflation
Anchor Capital 183-Jun-16
0
50
100
150
-4
-2
0
2
4
6
Mar-06
Sep-06
Mar-07
Sep-07
Mar-08
Sep-08
Mar-09
Sep-09
Mar-10
Sep-10
Mar-11
Sep-11
Mar-12
Sep-12
Mar-13
Sep-13
Mar-14
Sep-14
Mar-15
Sep-15
Effect of oil prices on US Inflation
Crude Oil Spot US Headline Inflation US Core Inflation
Data Source: Thomson Reuters
90
110
130
150
170
0
50
100
150
Feb-06
Aug-06
Feb-07
Aug-07
Feb-08
Aug-08
Feb-09
Aug-09
Feb-10
Aug-10
Feb-11
Aug-11
Feb-12
Aug-12
Feb-13
Aug-13
Feb-14
Aug-14
Feb-15
Aug-15
Feb-16
Impact of Oil Prices on US imports and TWI
Crude Spot US Trade Weighted Currency Index US Import Prices
Data Source: Thomson Reuters
95
100
105
110
115
120
125
Feb-06
Aug-06
Feb-07
Aug-07
Feb-08
Aug-08
Feb-09
Aug-09
Feb-10
Aug-10
Feb-11
Aug-11
Feb-12
Aug-12
Feb-13
Aug-13
Feb-14
Aug-14
Feb-15
Aug-15
US Import Price Index excluding Fuel
Data Source: Thomson Reuters
19.
20. The Euro Zone Economy: GDP Components
Euro Zone GDP components have all been on a gradual rise
This implies that the observed GDP growth as been a result
of a combined positive contribution of the broad economic
components
This provides a strength signal for the general economy
Anchor Capital 203-Jun-16
4.95E+11
5E+11
5.05E+11
5.1E+11
5.15E+11
5.2E+11
5.25E+11
Euro Zone Government Expanditure
Data Source: Thomson Reuters
6E+11
6.1E+11
6.2E+11
6.3E+11
6.4E+11
6.5E+11
6.6E+11
6.7E+11
Euro Zone Investments
Data Source: Thomson Reuters
1260
1280
1300
1320
1340
1360
1380
Euro Zone Private Consumption
Data Source: Thomson Reuters
21. Analysis from the Philips Curve
- Relates an economies inflation to its
output gap
- At full employment, the model assumes
stable inflation
- Disequilibrium generates inflationary or
disinflationary pressures
Euro area is still recovering from the 2008/2009
recessionary shock
Still in the process of reducing the output gap
created in the 2008/2009
Degree of underutilization might still be higher
relative to pre-recession period
This provides some insight on the current
“dialectical” theme that underpins the Euro area
Anchor Capital 213-Jun-16
0
0.5
1
1.5
2
2.5
3
YoY Euro Zone Labor Costs
Data Source: Thomson Reuters
7
8
9
10
11
12
Jan-13 May-13 Sep-13 Jan-14 May-14 Sep-14 Jan-15 May-15 Sep-15 Jan-16
Euro Zone Unemployment
Data Source: Thomson Reuters
22. Euro area has been experiencing strong
disinflationary pressures up to 2014
Lack of demand has not been the ultimate cause
of disinflation
Both low demand and low inflation are joint
manifestation of an underlying disequilibrium in
asset markets leading to the observed disinflation
Anchor Capital 223-Jun-16
-1
0
1
2
3
4
5
Euro Zone Inflation
Data Source: Thomson Reuters
0.8
1
1.2
1.4
1.6
1.8
2
Jan-13 Jul-13 Jan-14 Jul-14 Jan-15 Jul-15 Jan-16
Euro Zone Services Inflation
Data Source: Thomson Reuters
-10 -8 -6 -4 -2 0 2
Energy
Processed food, alcoho & tobacco
Non-energy industrial goods
Unprocessed food
Services
Contribution to the Euro Zone annual inflation (%)
Feb March
Data Source: Thomson Reuters
Disinflation Post
disinflationary
cycle
23.
24. The Chinese Economy: GDP
China growth rate has been on a downwards spiral since
late 2012
The export led capital investment growth model that
underpins Chinese economy came under immense pressure
due to decline in exports as a percentage of GDP
The strengthening of the Yuan that was fueled by the dollar
strength since 2012 left its export industry under pressure
Anchor Capital 243-Jun-16
6
6.5
7
7.5
8
8.5
Mar-12
May-12
Jul-12
Sep-12
Nov-12
Jan-13
Mar-13
May-13
Jul-13
Sep-13
Nov-13
Jan-14
Mar-14
May-14
Jul-14
Sep-14
Nov-14
Jan-15
Mar-15
May-15
Jul-15
Sep-15
Nov-15
Jan-16
Mar-16
China GDP Y/Y
Data Source: Thomson Reuters
20
22
24
26
28
Q1
2012
Q2
2012
Q3
2012
Q4
2012
Q1
2013
Q2
2013
Q3
2013
Q4
2013
Q1
2014
Q2
2014
Q3
2014
Q4
2014
Q1
2015
Q2
2015
Q3
2015
Q4
2015
Q1
2016
Q2
2016
China exports (%GDP)Data Source: Thomson Reuters
Cyclicality?
4
5
6
7
8
9
60
80
100
120
Yuan/Dollar vs US Trade Weighted Dollar
USA Trade Weighted Index Yuen/USD
Data Source: Thomson Reuters
Yuan
Disparity
25. The Chinese Economy: A Glance at GDP Components
We currently have no conviction that China’s
growth model has been gravitating towards
consumption nor services driven
China growth will still depend on its exports
particularly in response to global
infrastructure development which is showing
positive momentum
Anchor Capital 253-Jun-16
6.5
7
7.5
8
8.5
9
Q1
2013
Q2
2013
Q3
2013
Q4
2013
Q1
2014
Q2
2014
Q3
2014
Q4
2014
Q1
2015
Q2
2015
Q3
2015
Q4
2015
Q1
2016
Q2
2016
China Private Consumption (%GDP)
Data Source: Thomson Reuters
46
48
50
52
54
56
China Services Sector
Data Source: Thomson Reuters
34
36
38
40
42
44
46
Feb-13
Apr-13
Jun-13
Aug-13
Oct-13
Dec-13
Feb-14
Apr-14
Jun-14
Aug-14
Oct-14
Dec-14
Feb-15
Apr-15
Jun-15
Aug-15
Oct-15
Dec-15
Feb-16
Apr-16
iShare Global Infrastructure ETF
Data Source: Thomson Reuters
False Signals!Potential
Anchor
26. The Chinese Economy: Risk Factors
Dialectical phenomenon driven by a theme of “Appearance vs Reality”
- China’s foreign reserves have fell drastically, but to what
level will this start to raise true alarm bells
- What are Chinese actual reserves together with their
dollar assets
Banks - A ticking bomb that might not explode
- Loan creation by banks has been rising at the back on an
increasing number on non-performing loans
- The banking sector credit risk has been increasing
significantly since 2013
Major risk is that under current conditions of concentrated risk, it would take
one default to drive the economy into a downwards spiral
Anchor Capital 263-Jun-16
2.8E+12
3E+12
3.2E+12
3.4E+12
3.6E+12
3.8E+12
4E+12
4.2E+12
China Foreign Reserves
Data Source: Thomson Reuters
0
0.2
0.4
0.6
0.8
1
1.2
China Commercial Bank Credit Risk
Indicator
Data Source: Thomson Reuters
0
5E+12
1E+13
1.5E+13
0
2000
4000
6000
8000
2006 2007 2008 2009 2010 2011 2012 2013 2014 2015
China Non-Performing Loans and New Loan Issues
China's Non-performing Loans China's New Loan Growth
Data Source: Thomson Reuters
27.
28. Growth vs Real Exchange Rate
• Growth in SA has deteriorated
significantly
• The decline rate has increased between
2014 to 2016
• Growth for 2016 was revised down from
1.3 to 0.7
• Gross National income has been on a
decreasing trend since 2012
3-Jun-16 Anchor Capital 28
0
1
2
3
4
2006 2007 2008 2009 2010 2011 2012 2013 2014 2015 2016
SA GDP Growth Rate
Data Source: Thomson Reuters
200
2200
4200
6200
8200
2006 2007 2008 2009 2010 2011 2012 2013 2014 2015
Gross National Income
Data Source: Thomson Reuters
55
70
85
100
SA Real Effective Exchange Rate
Data Source: Thomson Reuters
29. Growing Sectors as a % of GDP
• Finance, Real Estate and Bus services has been the most
stable growth sector over the past
• Wholesale, retail and motor trade has shown an upward
cyclical growth trend
• General government has recently started ticking upwards
after a gradual decline from 1993 to 2009
• Overall, these sectors have been an anchor for SA growth
in recent years
Anchor Capital 293-Jun-16
0
5
10
15
20
25
May-93
May-94
May-95
May-96
May-97
May-98
May-99
May-00
May-01
May-02
May-03
May-04
May-05
May-06
May-07
May-08
May-09
May-10
May-11
May-12
May-13
May-14
May-15
GENERAL GOVERNMENT SERVICES
Data Source: Thomson Reuters
0
5
10
15
20
25
May-93
May-94
May-95
May-96
May-97
May-98
May-99
May-00
May-01
May-02
May-03
May-04
May-05
May-06
May-07
May-08
May-09
May-10
May-11
May-12
May-13
May-14
May-15
FINANCE,REAL ESTATE & BUS.SERVICES
Data Source: Thomson Reuters
12
12.5
13
13.5
14
14.5
15
15.5
May-93
May-94
May-95
May-96
May-97
May-98
May-99
May-00
May-01
May-02
May-03
May-04
May-05
May-06
May-07
May-08
May-09
May-10
May-11
May-12
May-13
May-14
May-15
WHOLESALE, RETAIL & MOTOR TRADE
Data Source: Thomson Reuters
30. Foreign Flows
• Foreigners were net buyers of SA
bonds during 2016
• Levels of net purchases for Jan
2016 look similar to those
observed in Jan 2015
• Foreign net purchases appears
to have been cyclical over the
past 4 years
-4000
-2000
0
2000
4000
6000
8000
Net Purchases of SA Bonds by Foreigners
Purchases Sales
Data Source: Thomson Reuters
-4000
0
4000
8000
12000
16000
20000
Feb-09
Aug-09
Feb-10
Aug-10
Feb-11
Aug-11
Feb-12
Aug-12
Feb-13
Aug-13
Feb-14
Aug-14
Feb-15
Aug-15
Feb-16
Cumulative Net Purchases of SA Bonds by
Foreigners
Data Source: Thomson Reuters
Anchor Capital 303-Jun-16
31. Fundamental Analysis: Relative to other EM Currencies
• The Rand remains one of the top
worst performing currency relative
to the dollar on our selected EM
currencies
• The rand has improved from
being the worst performing
currency last month to being the
second worst performer
0 10 20 30 40 50 60 70
INDONESIAN_RUPIAH
NORWEGIAN KRONER
Indian_Rpees
TURKISH_LIRA
THAI BAHT
PERUVIAN_NUEVO
CHILEAN_PESO
BRAZILIAN_REAL
MEXICAN_PESO
RUSSIAN_ROUBLE
SA_ZAR
ARGENTINE_PESOS
Annual Depreciation of selected EM
Currencies
Data Source: Thomson Reuters
3-Jun-16 Anchor Capital 31
33. What have we seen?
• Heightened market uncertainty
• Unconventional monetary policies assumed by major central
banks which have altered the investment landscape
• Since Q2 2014 5 central banks have embarked on negative
rates (Denmark, Euro Area, Japan, Sweden and
Switzerland)
• In Q1 2016, 14 central banks cut their interest rate
• Negative interest rates reduces the opportunity cost of holding
gold
• Given negative interest rates and increasing market
uncertainty, demand for gold increases
• More importantly, falling and negative rates are generally
linked to high gold prices, yet, rising rates are not necessary
linked to low gold prices
Anchor Capital 333-Jun-16
-1.50
-1.00
-0.50
0.00
0.50
1.00
1.50
2.00
2.50
3.00
3m 1y 2y 3y 5y 10y 30y
Nominal Yield Curves of various Advanced
Economies
USA UK France
Germany Japan Switzerland
Data Source: Thomson Reuters
34. Yield Curve Movements
• Yield Curves and Interest Rates
pushing further into negative territory
• Gold Price Implications
• Emerging Market implications
• Stabilization of oil price implications
Anchor Capital 343-Jun-16
-1
0
1
2
3m 1y 2y 3y 5y 10y 30y
Germany Yield Curve movement since 2012
2012 2014 2016
Data Source: Thomson Reuters
-1
0
1
2
3m 1y 2y 3y 5y 10y 30y
Japan Yield Curve movement since 2013
2013 2014 2015 2016
Data Source: Thomson Reuters
35. Fundamental Bond vs Actual SA Bond
• Our Fundamental model suggest that current
bond yields are over valued
• Spot valuation from the fundamental model
values SA 10-year yields at 10.06% while
actual yields are at 9.50%
• The fundamental valuation model has largely
been driven by rising credit spreads since
Sep 2015
0
3
6
9
12
15
Oct-08
Feb-09
Jun-09
Oct-09
Feb-10
Jun-10
Oct-10
Feb-11
Jun-11
Oct-11
Feb-12
Jun-12
Oct-12
Feb-13
Jun-13
Oct-13
Feb-14
Jun-14
Oct-14
Feb-15
Jun-15
Oct-15
Feb-16
Jun-16
SA 10yr Fundamental Bond
US 10yr Bond SA Sovereign Spread Inflation Differential SA 10yr Fair Value
Data
Data Source: Thomson Reuters
-6
-3
0
3
6
9
12
15
Oct-08 Oct-09 Oct-10 Oct-11 Oct-12 Oct-13 Oct-14 Oct-15 Oct-16
SA_10yr vs Fundamental 10yr
SA 10yr Fair Value Actual SA_10yr Implied RP
Model Spot : 10.06
Data Source: Thomson Reuters
Anchor Capital 353-Jun-16
36. Z-Score Bond Valuation
• SA Bonds have change
direction and are becoming
more attractive
• The 10yr bond appears to be
have moved more than the 5-
year bond
Anchor Capital 363-Jun-16
-3.5
-2.0
-0.5
1.0
2.5
4.0
5.5
SA_5yr Z-Score
Cheap
Rich
Data Source: Thomson Reuters
-3.5
-2.0
-0.5
1.0
2.5
4.0
5.5
SA_10yr Z-Score
Rich
Cheap
Data Source: Thomson Reuters
37. Rate Hiking Probabilities
• SA FRA’s are pricing in a strong
probability of a hike in July, possibly
more than 25bp
• The US FRA’s on the other hand are
currently pricing in a 70% probability of a
hike in the June meeting
Anchor Capital 373-Jun-16
0
20
40
60
80
100
ProbabilityofRateHikes
Probabilities of Rate Hikes at MPC Meetings
Implied by 3 month FRA's
1st Hike 2nd Hike 3rd Hike 4th Hike
Data Source: Thomson Reuters
0
20
40
60
80
100
Jun-16 Jul-16 Sep-16 Nov-16 Dec-16
Probabilities of Rate Hikes at FOMC Meetings
Implied by US 3M FRA's
1st Hike 2nd Hike Data Source: Thomson Reuters