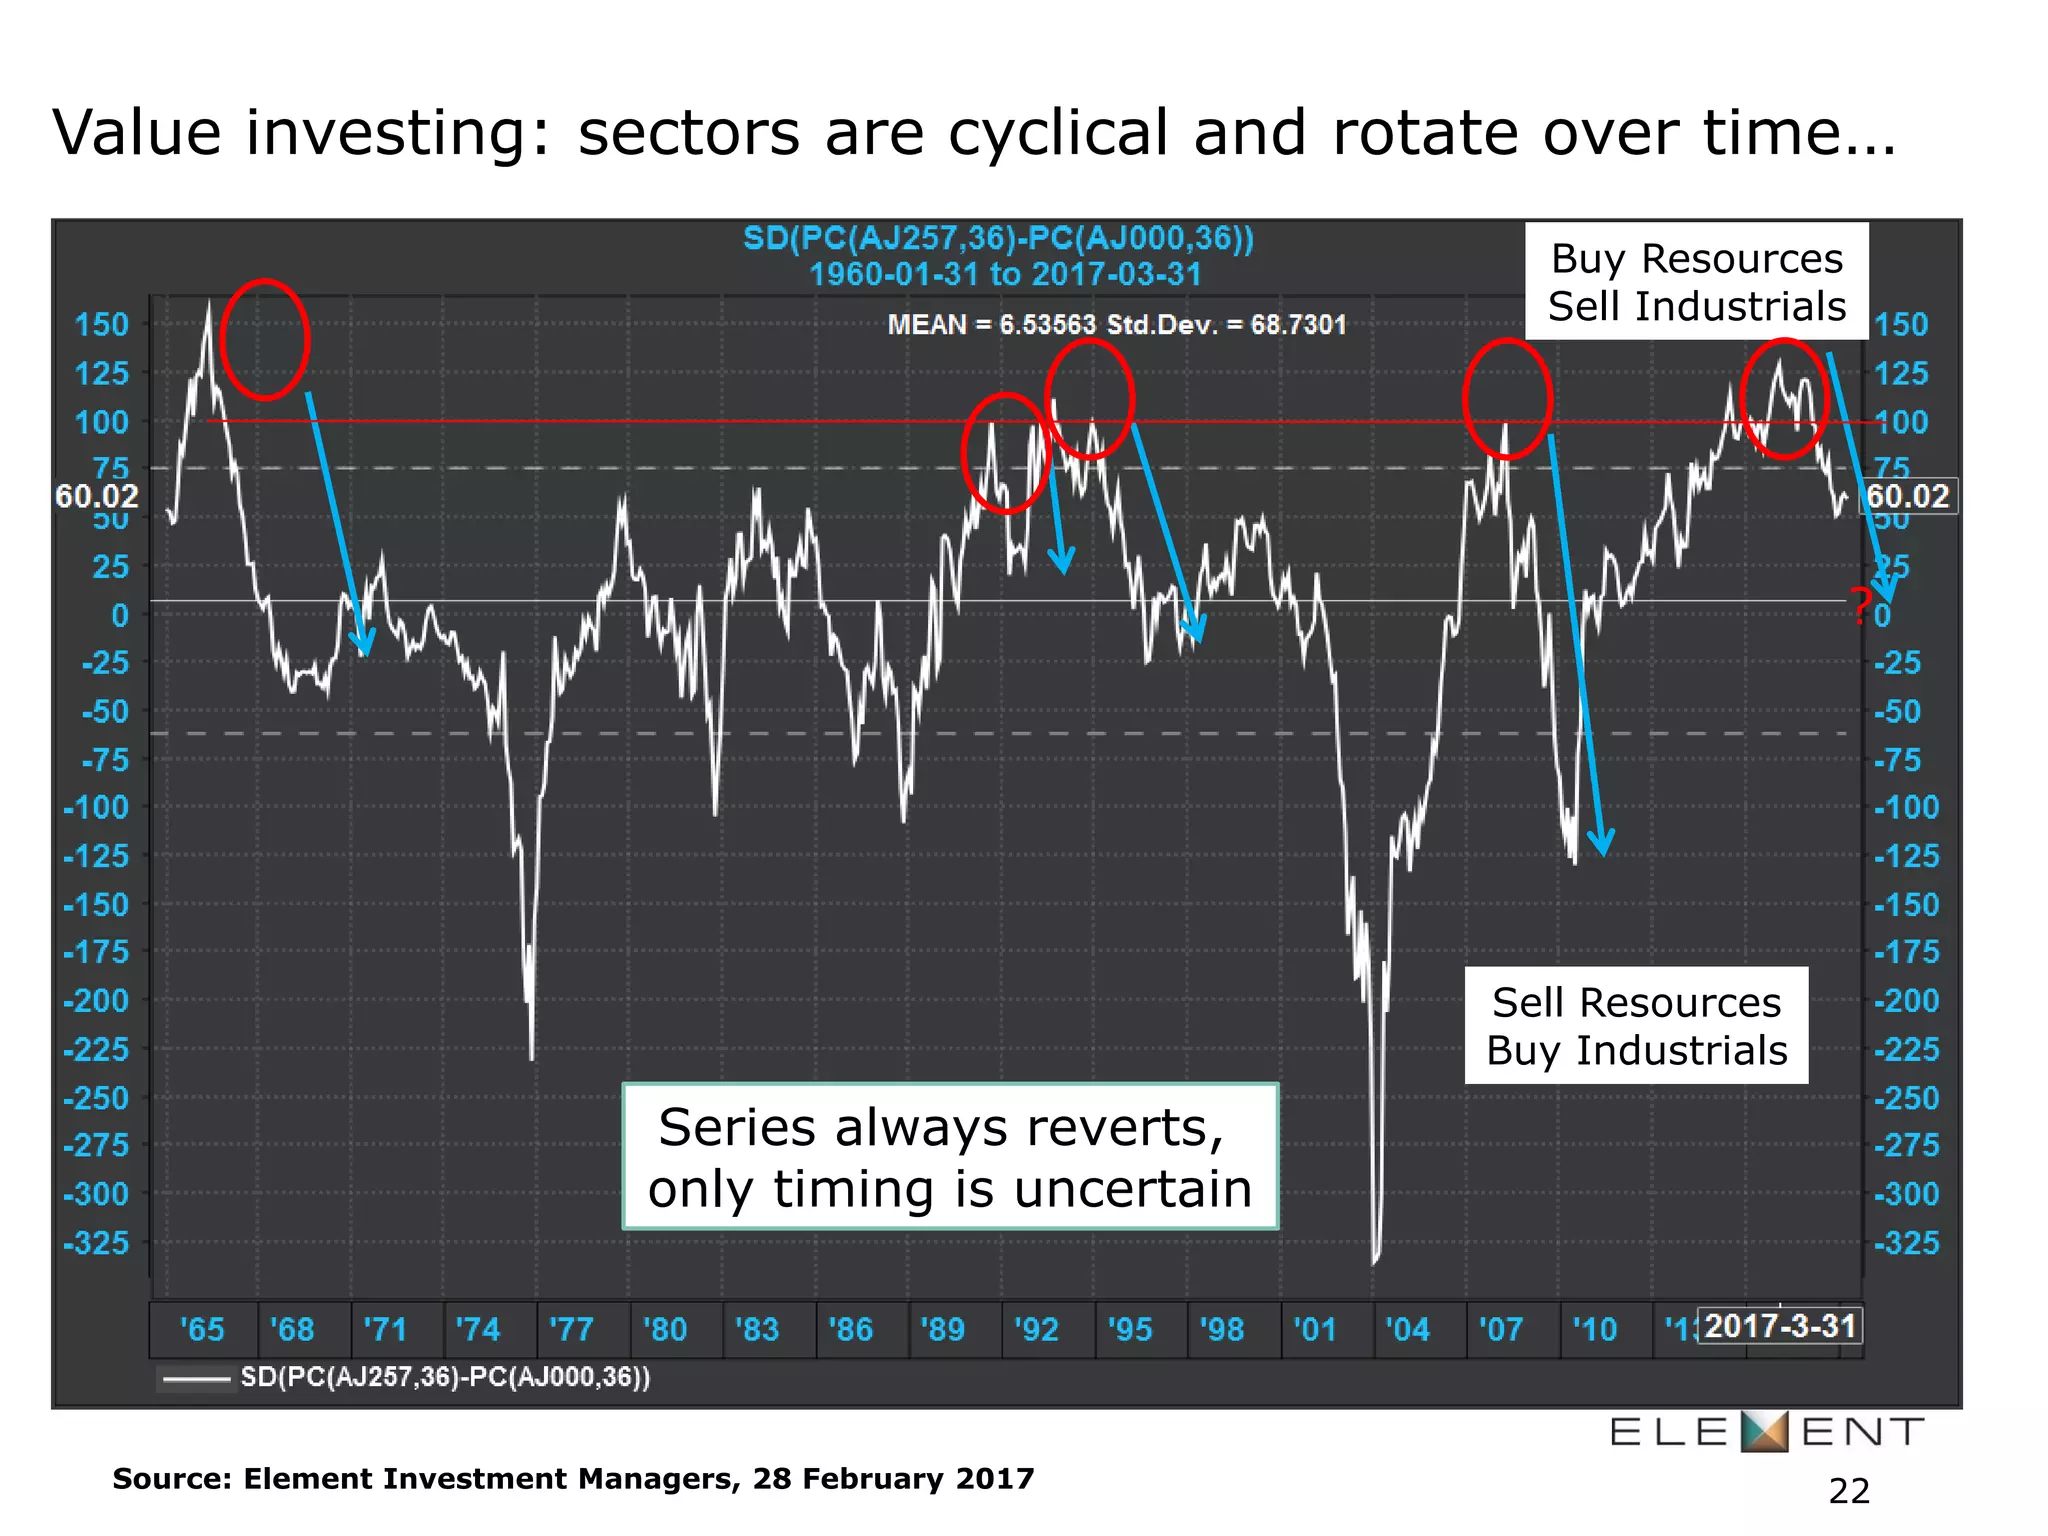
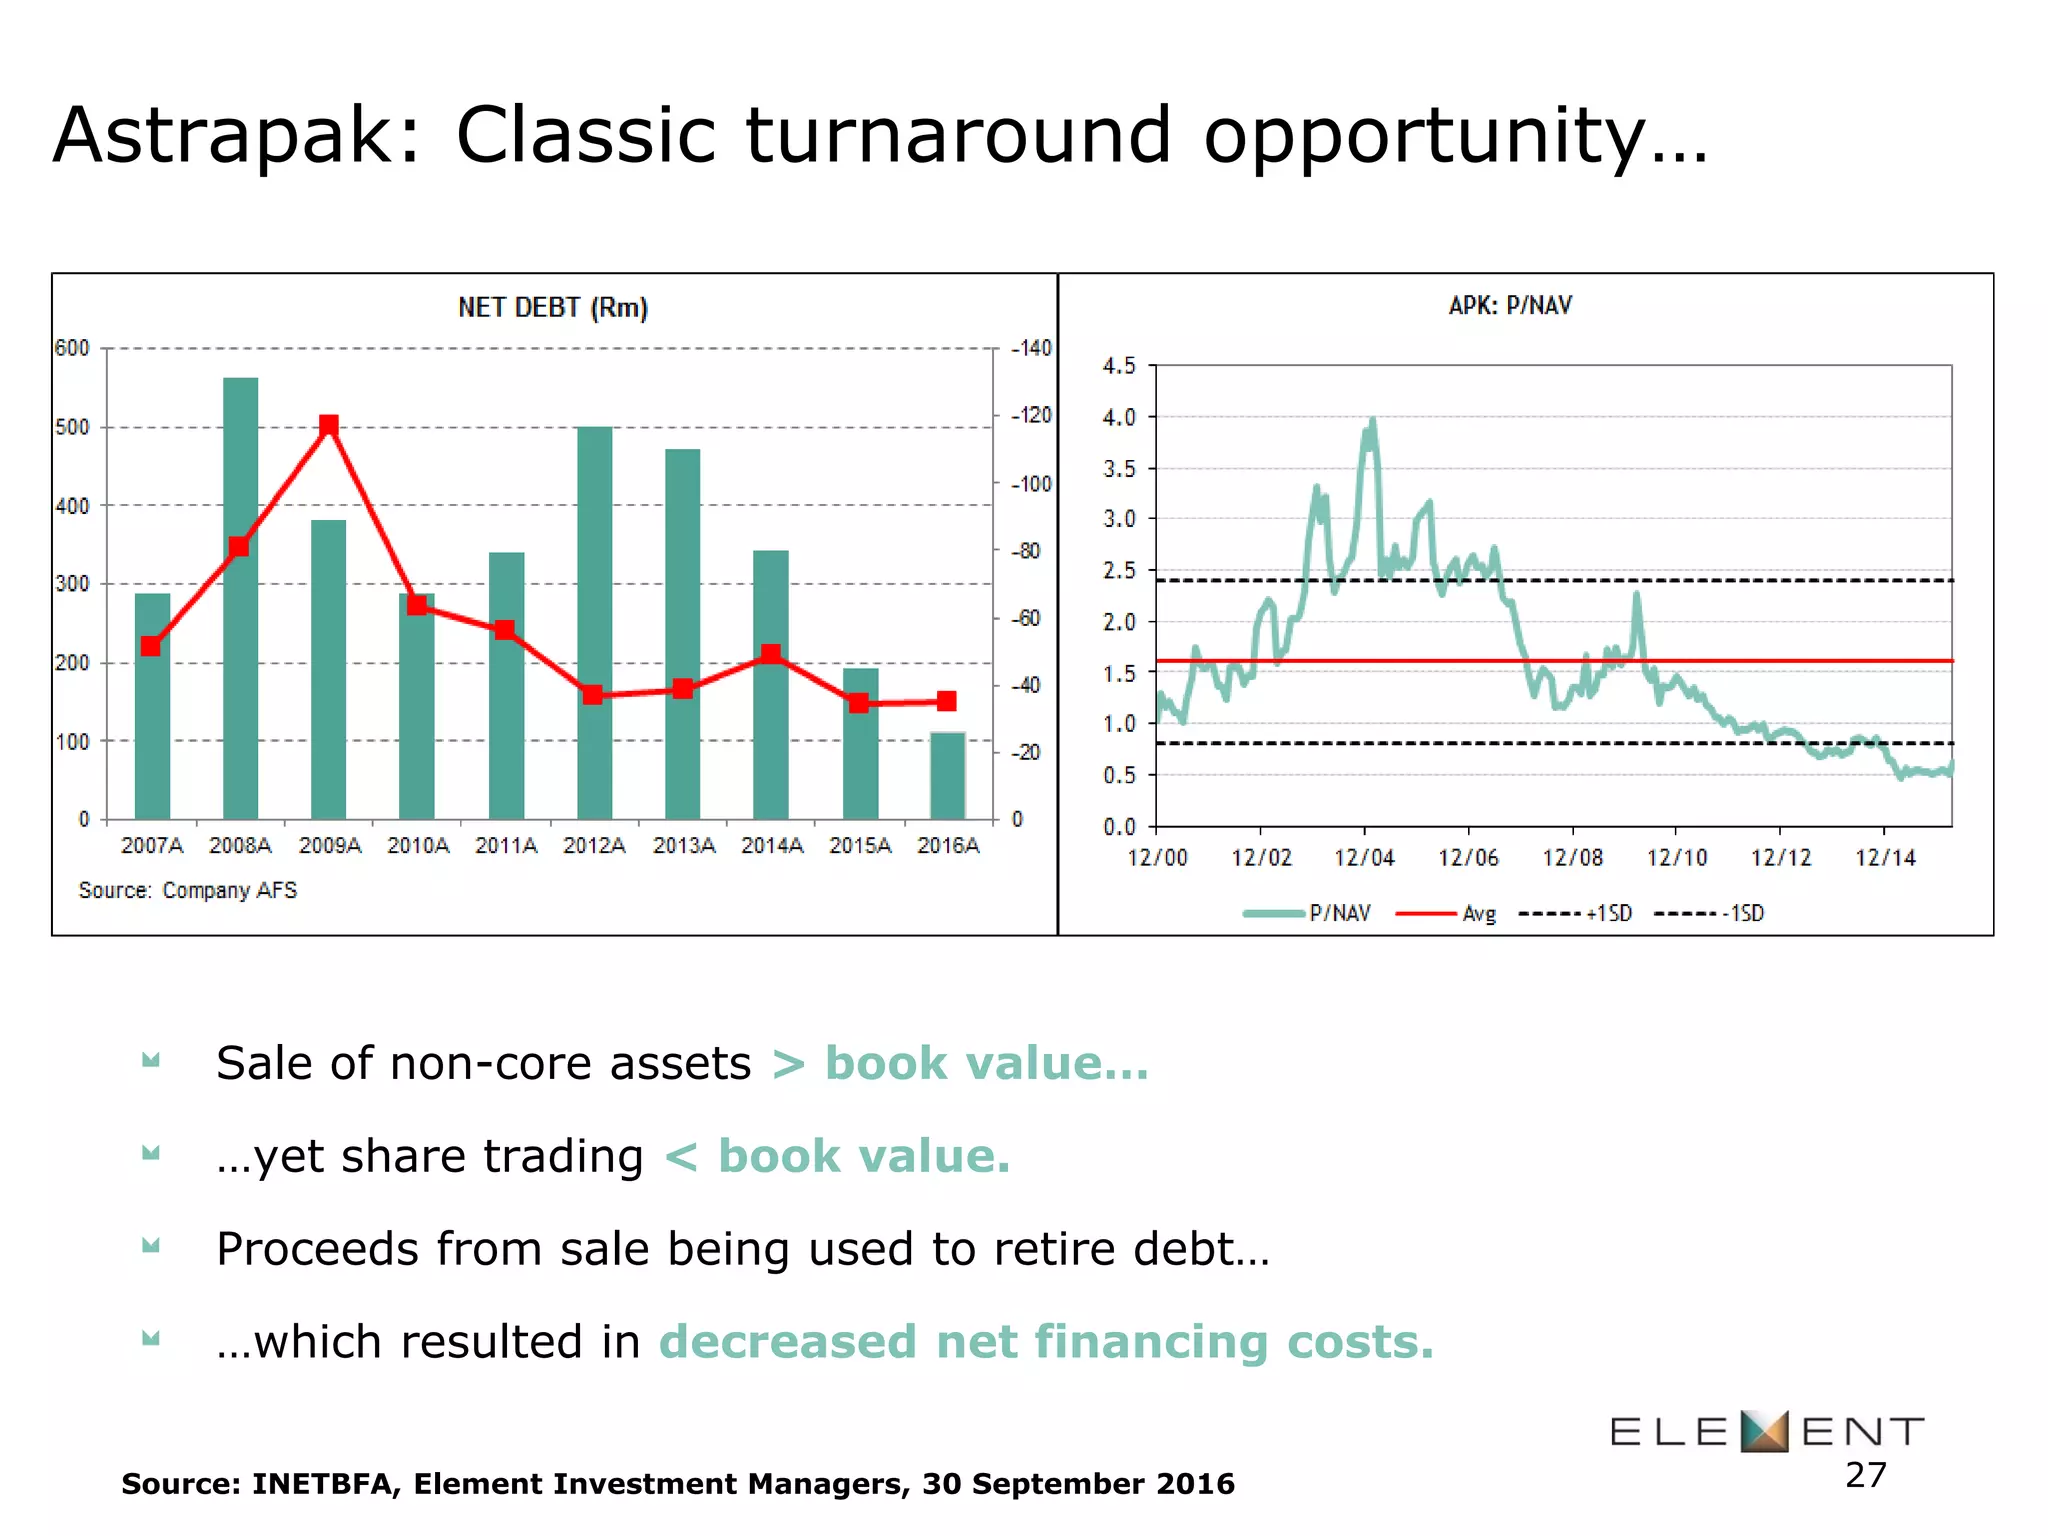
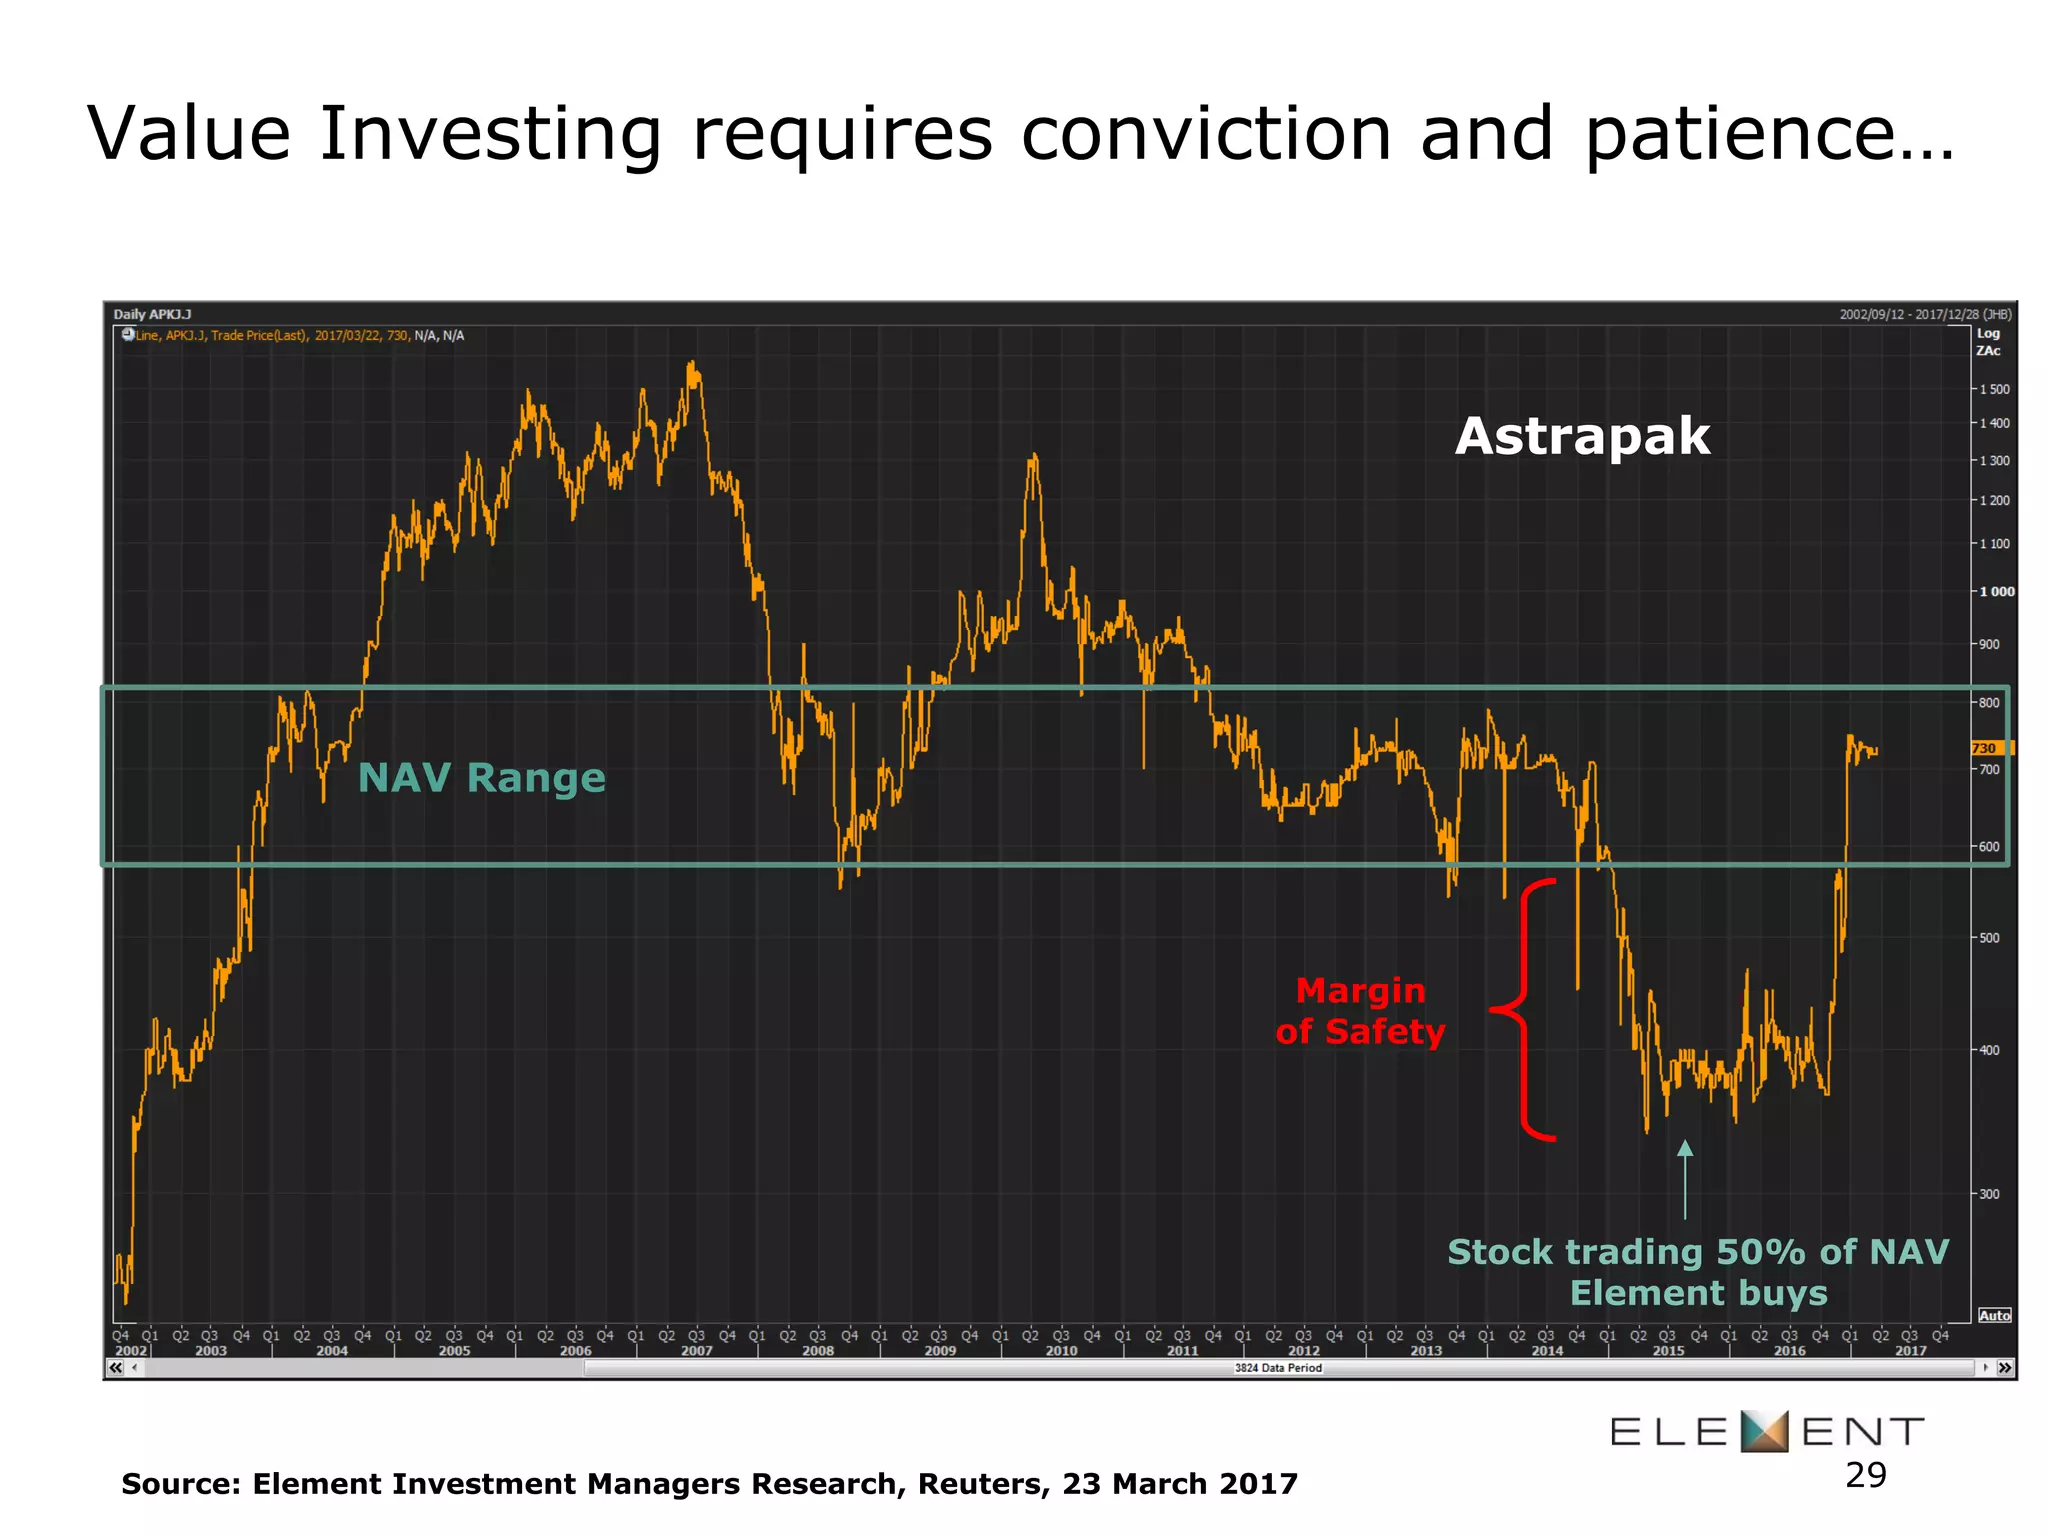
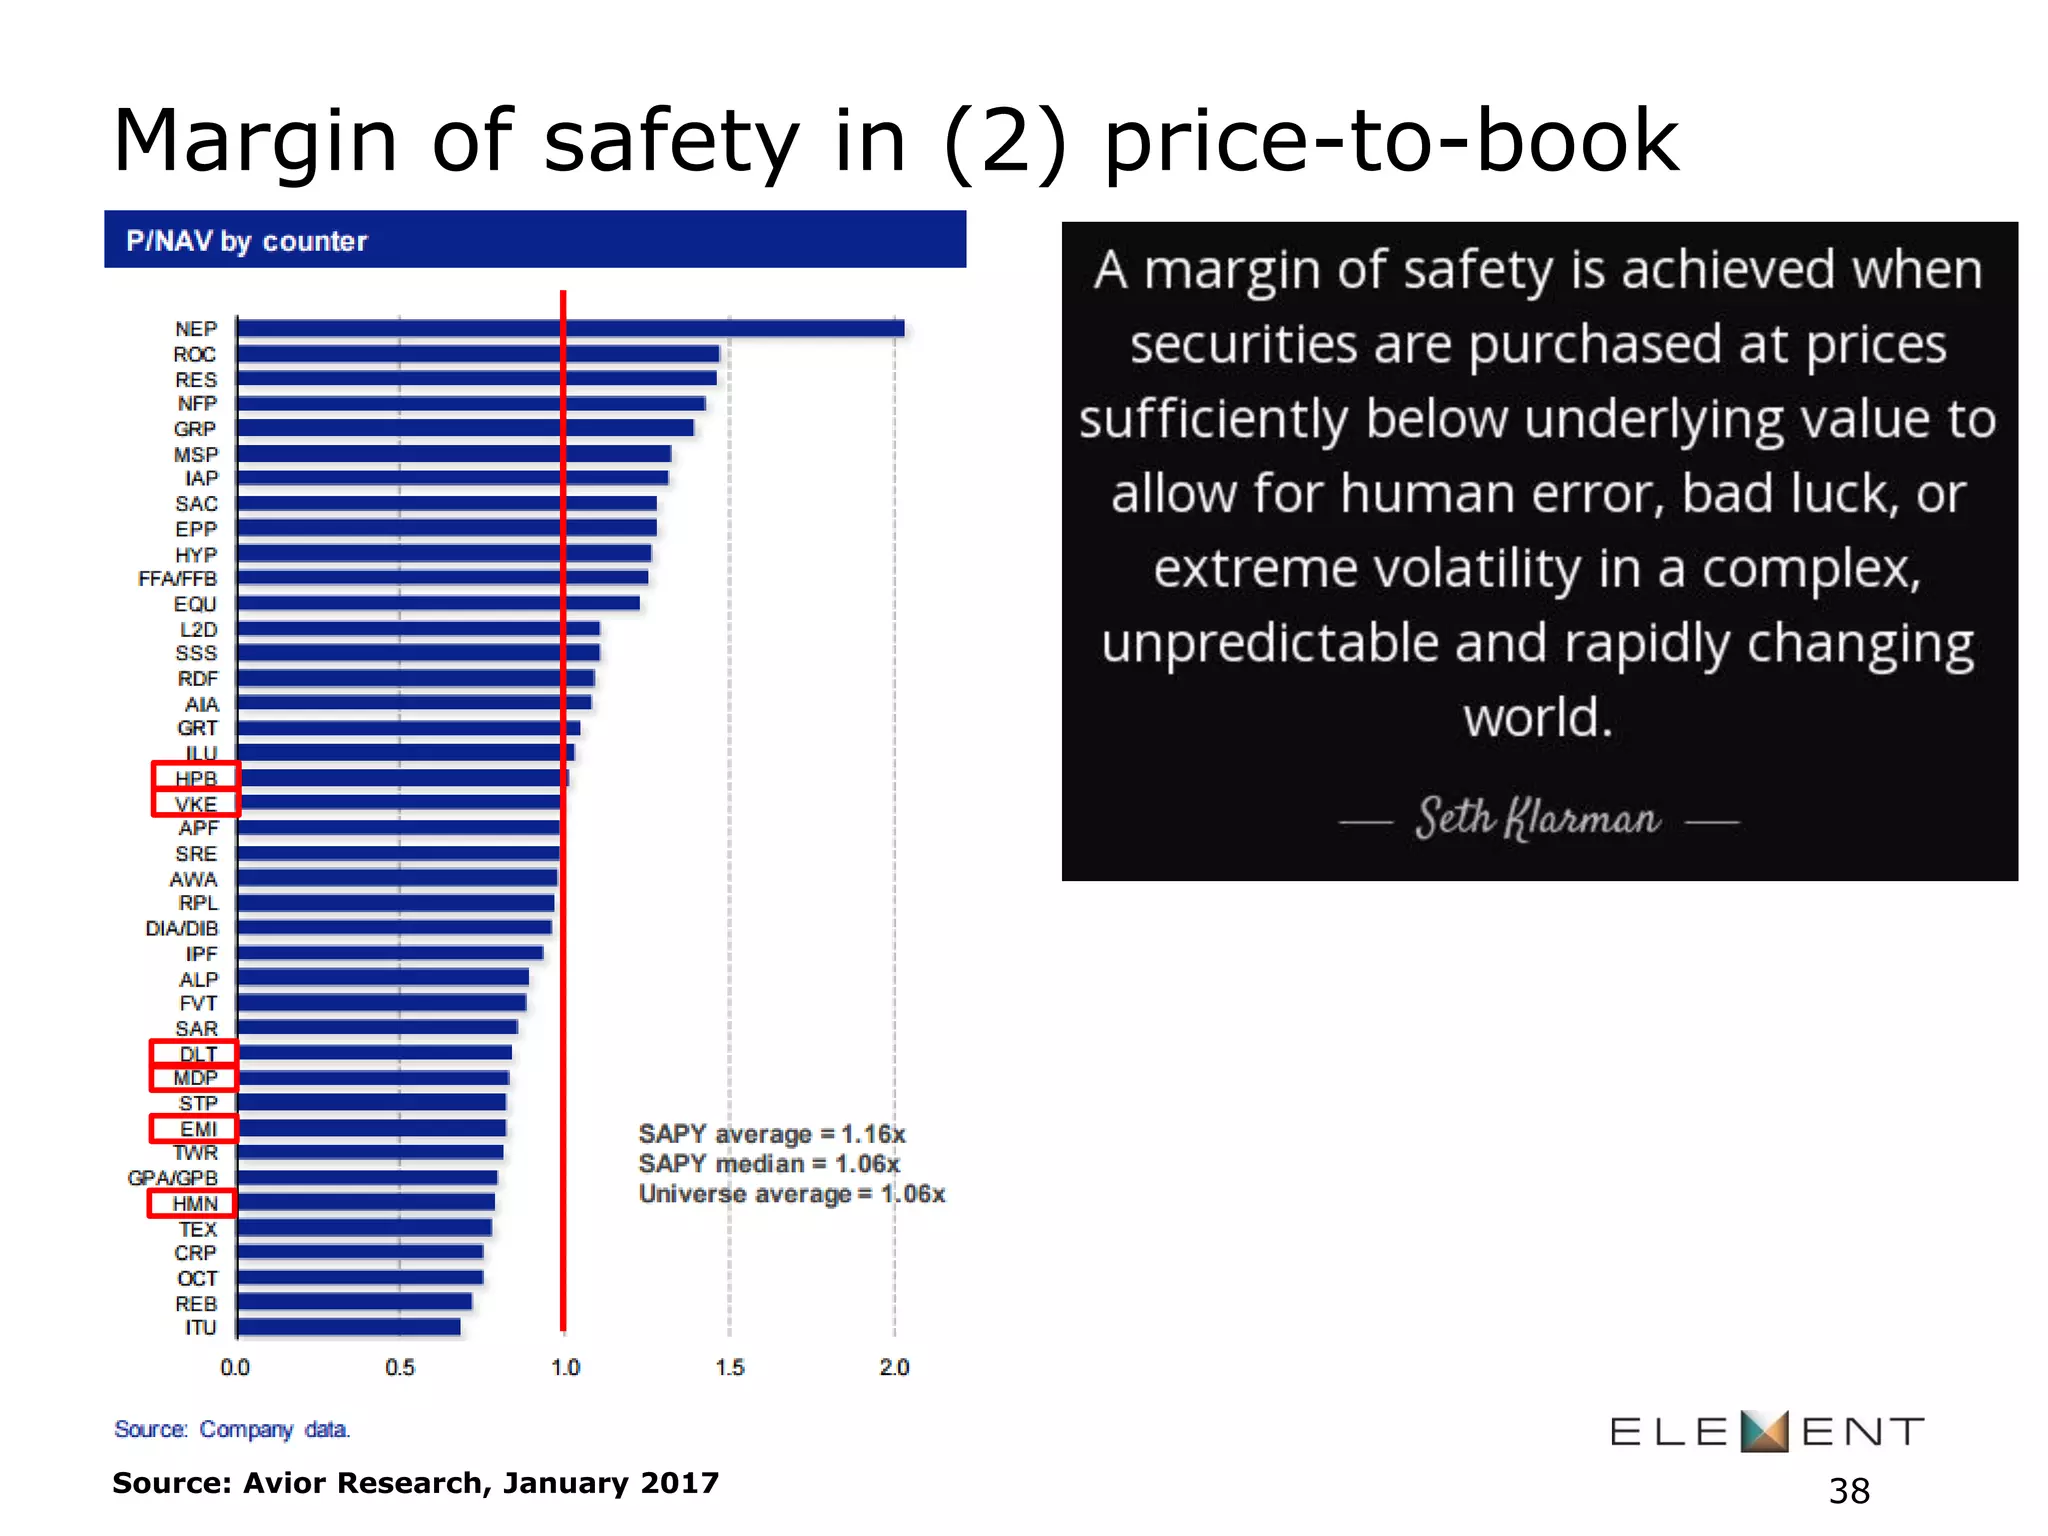
Senate Group
23 March 2017
Terence Craig - Chief Investment Officer
Jeleze Hattingh – Portfolio Manager
A Return to Value
2
Value investing is the art of buying stocks which trade
at a significant discount to their intrinsic value
(providing an adequate margin of safety).
Value investors achieve this by looking for companies on
cheap valuation metrics, typically low multiples of
their profits or assets, for reasons which are not
justified over the longer term.
This approach requires a contrarian mindset and a
long term investment horizon.
What is the definition of “Value investing”?
3
Source: Schroders Plc
“Under-valuations caused by neglect or
prejudice may persist for an inconveniently
long time, and the same applies to inflated
prices caused by over-enthusiasm or
artificial stimulants”
~ Benjamin Graham
4
“In the past 18 months the
price has fallen by 75%, from
$110 a barrel to below $27.
Yet this time the benefits
are less certain.”
“The world is drowning in oil.”
“Collapsing revenues could
bring political instability to
fragile parts of the world,
such as Venezuela and the
Gulf, and fuel rivalries in the
Middle East.”
“In fact, the world could yet
be laid low by an oil monster
on the prowl.”
Low oil - with calls for it even lower…
23 January 2016
5
“An unprecedented combination
of excess supply and weak
demand has created just such
rough seas in the past year.”
“The chairman of Royal
Dutch/Shell…three months ago
unveiled a five-year plan that
assumed a price of $14 a
barrel.”
A new report by Arthur Andersen,
an accounting firm, and CERA, an
energy consultancy, argues that
the present price collapse is
fundamentally different from
the previous one…”
“Yet here is a thought: $10 might
actually be too optimistic. We
may be heading for $5.”
Low oil - with calls for it even lower…
6 March 1999
$40
Ernst & Young
$20
$10.”
6
It’s always doom & gloom close to the bottom!
Economist Articles
1226% (31.9% p.a.)
Source: Element Investment Managers, INET, 23 March 2017
7
41%
MSCI Value vs MSCI Growth - rotation started
Source: www.Schroders.com, Reuters, 31 December 2016 8
Early days in Value cycle recovery…
9
US Equities
Early days in Value cycle outperformance…
10
Cumulative outperformance of Deep Value from start of cycle in US
P/B Valuation spreads show further opportunity …
US
Europe Japan
PE Valuation spreads show further opportunity…
12
Deep value strategies require a long-term horizon…
13
2009
2016
Source: Alexander Forbes, Annual Retirement Fund Survey 2014 (17 March 2015)
Finding value in expensive equity
markets
14
ECB and BOJ taking over QE from FED
15
Source: Yardeni Research, Haver Analytics, 28 February 2017
Central bank balance sheets continue to grow
16
Source: Yardeni Research, Haver Analytics, 28 February 2017
“I would venture a guess that without QE from the ECB and BOJ that 10-
year U.S. Treasuries would rather quickly rise to 3.5% and the U.S.
economy would sink into recession.”
~ Bill Gross
Central banks went from buying bonds to equities
17
Source: Grant Williams TTMYGH, Wall Street Journal, February 2017
S&P 500 flat for >9 years without QE…
18
Source: Grant Williams TTMYGH, Bloomberg, February 2017
QE - growth driver for global equity markets…
19
Source: Grant Williams TTMYGH, Bloomberg, February 2017
S&P 500: A very expensive entry point…
20
3rd
2nd
2nd
US Equities: PE ratios likely to contract…
21
Equity PEs expanded materially on QE (last 5 years)
With reflation PEs are likely to contract (last 29 years)
Source: Epoch IP, 26 January 2017 (Data to 31 December 2016)
Buy Resources
Sell Industrials
Sell Resources
Buy Industrials
Series always reverts,
only timing is uncertain
?
Value investing: sectors are cyclical and rotate over time…
22Source: Element Investment Managers, 28 February 2017
Resources – still overweight, but less so…
We hold companies:
Strong balance sheets
Raised capital when necessary
Aggressive deleveraging
Material cost-cutting opportunities
Could withstand another down leg in commodity prices
Dividends likely to be resumed
Running yield with optionality on recovery
Material upside and strong cash flow at spot prices
Diversifieds:
Hold: BHPBilliton, South 32, Glencore
Gold:
Hold: AngloGold, Sibanye (under review)
23
South 32
Strong balance sheet
Net cash (zero debt)
Could withstand another down leg in commodity prices
Dividends resumed
Running yield with optionality on recovery
Potential for special dividend
Material upside and strong cash flow at spot prices
24
AngloGold: Strong Free Cash Flow
Ave Gold Price = $1249/oz
All In Costs (AIC) = $980 - $1010/oz
Free Cash Flow = $254/oz (using mid guidance AIC)
Gold Production = 3.6 – 3.65Moz
Free Cash Flow = 3.6Moz x $254/oz = $914m
ZAR Free CF = $914m x R12.56/$1 = R11.5bn
ANG Market Cap = cR57bn @ R141
Price/Free CF = 5.0x (reasonable range: 5-10 times)
ANG has reduced outstanding debt by > 1/3rd
25
Trading statement for 12 months ended December 2016,
Share price, ZAR – 22 March 2017 close
Earth Equity Top 20 CTAR vs ALSI
26
Positions taken
Benchmark ALSI
CTAR Contribution to Active Return
Element Earth Equity Fund: Average relative weights of the latest
12 months ending 28 February 17
Prefs
Sale of non-core assets > book value…
…yet share trading < book value.
Proceeds from sale being used to retire debt…
…which resulted in decreased net financing costs.
27
Astrapak: Classic turnaround opportunity…
Source: INETBFA, Element Investment Managers, 30 September 2016
…that led to a buy-out* of Astrapak
RPC Group Plc announced a buyout of Astrapak in December 2016 for R 1.37 billion.
= R7.65 cash per share
Premium of +42% to pre-announcement closing price of R5.40
+ Dividend in specie for unbundled Flexible businesses (NAV of R247m)
= R2.04 per share
This implies a Price to Book Ratio of 1x.
28
1.9
1.2
0.9
1.2
1.0
0.8
0.7 0.7
0.6
0.5
1.0
0.0
0.2
0.4
0.6
0.8
1.0
1.2
1.4
1.6
1.8
2.0
2007A
2008A
2009A
2010A
2011A
2012A
2013A
2014A
2015A
2016A
Current
APK: Price-to-Book ratio
Source: INETBFA, Element Investment Managers, 30 September 2016
Value Investing requires conviction and patience…
29
NAV Range
Margin
of Safety
Stock trading 50% of NAV
Element buys
Astrapak
Source: Element Investment Managers Research, Reuters, 23 March 2017
Value Investing
in non-equity asset classes
30
Asset Allocation – Specialist Income Fund
31Source: Element Investment Managers Research, 28 February 2017
Specialist Income Fund
% of
Fund
Cash + Call, MMkt and FRNs 60.8%
Cash + Call 3.2%
MMkt 45.4%
FRNs 12.2%
Fixed Rate Bonds 12.9%
ILBs 0.9%
Prefs 9.5%
Equity (cash arb) 0.4%
Property 15.5%
Local Property 12.1%
Foreign Property (in ZAR) 2.5%
Foreign Property (not in ZAR) 0.8%
Foreign Bonds 0.0%
Total Fund 100.0%
Prepared to take
conviction calls on asset
classes based on perceived
market opportunities
Not index hugging
Investing in a range of
different asset classes
across different geographies
Cross-pollination between
debt and equity analysts
Specialist Income Fund’s CTAR
32
Positions taken
CTAR Contribution to Active Return
Element Specialist Income Fund: Average absolute weights of the
latest 12 months ending 28 February 17
% of
Fund
TRR if
weighted
to 100%
CTAR
Property & Prefs 25.4% 32.3% 8.2%
Other Income Classes 74.6% 9.4% 7.0%
Total Fund 100.0% 15.2%
Pref Shares: High yield along with capital upside
33Source: Reuters, Element Investment Managers, 14 March 2017
Name
Fwd
DivYield
Upside
to Par
Grinrod Pref 11.9% 29%
Invicta Pref 11.5% 8%
PSG Pref 11.1% 27%
Imperial Pref 11.0% 27%
Steinhoff Pref 10.8% 25%
INPR (Investec Ltd) 10.4% 28%
Netcare Pref 10.1% 16%
Discovery Pref 10.0% 2%
INLP (Investec Bank local) 9.8% 12%
Capitec 9.7% 11%
Firstrand 9.6% 21%
Standardbank Pref 9.4% 16%
Nedbank 9.4% 7%
Absa Pref 9.3% 27%
Astrapak Pref 9.2% -1%
African Phoenix 0.0% 139%
Prefs bought back at
par in the last 12
months:
Brait Pref
Investec Pref (x2)
Astrapak Pref*
Why will the Banks buy back their Prefs?
34Source: Reuters, Element Investment Managers, 20 March 2017
APKP – price and yield move from Dec’16
35Source: Reuters, Element Investment Managers, 28 February 2017
36Source: Avior Research, 9 January 2017
Drivers of property returns are two-fold
Total Return = Capital Return + Income Return
Capital Return = Share re-rating + Earnings Growth
37Source: Avior Research, Element Investment Managers, 17 March 2017
Margin of safety in (1) dividend yield
DY FY2 Dividend Yield
Growth 4.0% 5.0% 6.0% 7.0% 8.0% 9.0% 10.0% 11.0% 12.0%
0% 4.0% 5.0% 6.0% 7.0% 8.0% 9.0% 10.0% 11.0% 12.0%
2% 4.1% 5.1% 6.1% 7.1% 8.2% 9.2% 10.2% 11.2% 12.2%
4% 4.2% 5.2% 6.2% 7.3% 8.3% 9.4% 10.4% 11.4% 12.5%
6% 4.2% 5.3% 6.4% 7.4% 8.5% 9.5% 10.6% 11.7% 12.7%
8% 4.3% 5.4% 6.5% 7.6% 8.6% 9.7% 10.8% 11.9% 13.0%
10% 4.4% 5.5% 6.6% 7.7% 8.8% 9.9% 11.0% 12.1% 13.2%
12% 4.5% 5.6% 6.7% 7.8% 9.0% 10.1% 11.2% 12.3% 13.4%
14% 4.6% 5.7% 6.8% 8.0% 9.1% 10.3% 11.4% 12.5% 13.7%
16% 4.6% 5.8% 7.0% 8.1% 9.3% 10.4% 11.6% 12.8% 13.9%
18% 4.7% 5.9% 7.1% 8.3% 9.4% 10.6% 11.8% 13.0% 14.2%
20% 4.8% 6.0% 7.2% 8.4% 9.6% 10.8% 12.0% 13.2% 14.4%
Property stocks pay out close
to 100% of their income:
Property PE = 1 / DY
High distribution growth off a
low base does not necessarily
add to an adequate margin of
safety, similar to high growth &
high PE shares
38Source: Avior Research, January 2017
Margin of safety in (2) price-to-book
HPB: removal of hurdles weighing on price
Source: Element Investment Managers, Reuters, 28 February 2017
First set of results post Tsogo transaction:
Trading at 28% discount to NAV of R19.75
Normalised dividend yield of 12% (= PE of 8.3x )
Business (and share price) under
pressure due to:
• Fundamentals: Drop in demand for
conference centres, over supply, high
gearing
• Banks demanding excessive short term
funding spreads
Leading to:
• Heavily discounted rights issue
• Different expectations from the two
classes of shareholders
Specialist Income – Property Holdings
40
Holdings as per Element Specialist Income Fund, 22 March 2017
Weight
Forward
Dividend
Yield
Premium/
Discount
to NAV
Exposure Type
Hospitality Property 4.4% 11.1% -28% Hospitality
Delta 3.2% 12.8% -16% Gov Offices
Fortress A 2.1% 8.1% 9% Inflation Replica
Vukile 2.0% 8.6% 5% Diversified / UK Logistics
Mara Delta 1.8% 9.3% -15% Africa Diversified
Hammerson 1.3% 4.4% -20% UK and EU Retail
Growthpoint 0.5% 7.7% 7% Diversified / AUS
Emira 0.5% 10.8% -15% Diversified / AUS
SAPY 7.1% 19%
Underlying holdings with adequate margin of safety, as displayed through:
High starting forward dividend yield
Significant discount to NAV
Conclusion
41
Element performance hurdles that have historically indicated a sustainable turnaround:
Material (>10%) outperformance in a short period of time (≤12 months)
Earth Equity Fund relative performance in 2016 of +16.3% vs ALSI
Element Equity outperformance for 1 month ranking in Top 10 since inception
Feb 2016 relative performance of +6.9% vs ALSI and +7.5% vs SWIX
Element funds moving up materially in the performance ranking tables
All Element’s SA Unit Trusts - Top Quartile over rolling 12 months
Value style in general:
Other Value managers showing similar outperformance - YES
Material rotation of outperformance of investment styles - YES
Why Element’s recovery may be sustainable
42Source: Moneymate, December 2016
Global Equity Earth Equity Flexible Balanced*
Real
Income*
Specialist
Income*
Inception Date Feb-11 Oct-01 Oct-01 Nov-09 Oct-02 Dec-13
ASISA Category
Global - Equity
General
South African - Equity
General
Multi Asset - Flexible
Multi Asset - High
Equity
Multi Asset - Low
Equity
Multi Asset -Income
Maximum Equity 100% 100% 100% 75% 40% 10%
Benchmark
MSCI World Index in
ZAR
ALSI CPI + 5%
Average of Multi Asset
– High Equity Group
CPI + 3% 110% STeFi
Current Fund Size R58 million R54 million R162 million R5 million R150 million R122 million
Performance as at
28 February 2017
Fund
Bench-
mark
Fund
Bench-
mark
Fund ¹
Bench-
mark
Fund ¹
Bench-
mark
Fund ¹
Bench-
mark
Fund ¹
Bench-
mark
Annualised since
Inception
16.6% 18.8% 13.3% 15.8% 13.0% 11.0% 8.0% 10.0% 10.6% 8.5% 7.3% 7.4%
Ann. 10 Year 4.4% 10.2% 6.7% 11.4% 7.6% 9.4%
Ann. 5 Year 18.8% 22.3% 2.2% 11.6% 7.5% 10.9% 9.1% 9.8% 9.1% 8.9%
Ann. 3 Year 8.4% 12.1% 0.3% 5.7% 4.3% 10.8% 6.9% 5.9% 6.2% 8.8% 7.2% 7.4%
Ann. 2 Year 4.4% 9.8% 1.0% 0.8% 6.2% 11.8% 10.0% 2.6% 8.3% 9.8% 11.3% 7.8%
1 Year -8.6% -0.5% 15.8% 6.3% 14.7% 11.6% 23.5% 4.2% 13.1% 9.6% 15.2% 8.3%
YTD -0.8% -2.2% 5.6% 1.1% 6.6% 2.7% 17.6% 1.0% 4.9% 2.4% 4.1% 1.3%
ABIL Impact Fund
Bench-
mark
Fund
Bench-
mark
Fund
Bench-
mark
Fund
Bench-
mark
Fund
Bench-
mark
Fund
Bench-
mark
ABIL Total Impact
August 2014
-3.3% -7.7% -7.3% -7.1% -8.4%
AXL/AXLP relisting
1 Feb 2017
2.3% 5.1% 16.9% 3.3% 2.2%
* Regulation 28 Compliant
1 Weighted average performance including ABIL Retention Funds
Performance is reported net of fees.
Element: Unit Trust Performance
43
Element Unit Trust: Peer Rankings
Source: MoneyMate, 28 February 2017 44
Performance Start 2016/02/29 1Year
Performance End 2017/02/28 Rank # Funds Target % % Rank
Earth Equity 15.9% 14 227 5.7% 6%
Flexible 14.5% 6 106 4.8% 6%
Balanced 23.3% 1 220 3.8% 0%
Real Income 12.6% 4 167 4.6% 2%
Specialist Income 14.4% 2 89 8.6% 2%
Rank # Funds Avg Perf Rel Perf
Islamic Equity 14.6% 2 6 5.4% 9.2%
Islamic Balanced 12.9% 1 4 5.7% 7.2%
Performance End 2017/02/28 Rank # Funds Target % % Rank
Global Equity -8.6% 58 66 -2.1% 88%
Islamic Global Equity -9.9% 62 66 -2.1% 94%
All Element’s SA Unit Trusts - Top Quartile over 12 months
The outperformance, although short-term, is material
>16%* in 2016
Normally indicative of the start of a turnaround
Owner-managed and independent Value Manager
Element remains true to Value philosophy
Many boutiques have sold material stakes to listed entities
No longer independent
Long-term track record of over 19 years
Shareholding and Manco restructure – business sustainability
Materially incentivised Investment Team
Why use Element as a Value Manager?
* SA Equity
45
Disclaimer
Figures quoted are from Element Investment Managers (Pty) Limited, for the period
ended February 2017, for a lump sum investment, using NAV-NAV with income
distributions reinvested.
Element Investment Managers claims compliance with the Global Investment
Performance Standards (GIPS®). The firm includes all portfolios managed by Element
Investment Managers. Element Investment Managers is an independent, owner-
managed company. It provides discretionary investment management services to
retail and institutional clients.
Element Investment Managers has been verified for the period:
1 January 2003 to 31 December 2015
Copies of our verification reports are available on request.
A complete list and description of our composites is available by contacting
Sharifa Jaffer at:
+27 21 426 1313 or at sharifa@elementim.co.za
46
Collective Investment Schemes in Securities (CIS) are generally medium to long term
investments. The value of participatory interests may go down as well as up and past
performance is not necessarily a guide to the future. CIS prices are calculated on a net
asset value (NAV) basis which is the total value of all assets in the fund, including any
income accrual and less all permissible deductions from the portfolio. CIS are traded at
ruling prices and can engage in borrowing and scrip lending. Different classes of
participatory interests apply to the funds and are subject to different fees and charges.
A schedule of fees and charges and maximum commissions is available on request from
the company/scheme. Commission and incentives may be paid and if so, would be
included in the overall costs. Fluctuations or movements in exchange rates may cause
the value of underlying international investments to go up or down. The funds are
valued daily at 15h00 and forward pricing is used. The funds may be closed to new
investments at any time in order to be managed in accordance with its mandate. Past
performance is not indicative of future performance.
Disclaimer
47
Thank you
www.elementim.co.za
CONTACT DETAILS:
terence@elementim.co.za
jeleze@elementim.co.za

Element Investment Managers

  • 1.
    Senate Group 23 March2017 Terence Craig - Chief Investment Officer Jeleze Hattingh – Portfolio Manager
  • 2.
    A Return toValue 2
  • 3.
    Value investing isthe art of buying stocks which trade at a significant discount to their intrinsic value (providing an adequate margin of safety). Value investors achieve this by looking for companies on cheap valuation metrics, typically low multiples of their profits or assets, for reasons which are not justified over the longer term. This approach requires a contrarian mindset and a long term investment horizon. What is the definition of “Value investing”? 3 Source: Schroders Plc
  • 4.
    “Under-valuations caused byneglect or prejudice may persist for an inconveniently long time, and the same applies to inflated prices caused by over-enthusiasm or artificial stimulants” ~ Benjamin Graham 4
  • 5.
    “In the past18 months the price has fallen by 75%, from $110 a barrel to below $27. Yet this time the benefits are less certain.” “The world is drowning in oil.” “Collapsing revenues could bring political instability to fragile parts of the world, such as Venezuela and the Gulf, and fuel rivalries in the Middle East.” “In fact, the world could yet be laid low by an oil monster on the prowl.” Low oil - with calls for it even lower… 23 January 2016 5
  • 6.
    “An unprecedented combination ofexcess supply and weak demand has created just such rough seas in the past year.” “The chairman of Royal Dutch/Shell…three months ago unveiled a five-year plan that assumed a price of $14 a barrel.” A new report by Arthur Andersen, an accounting firm, and CERA, an energy consultancy, argues that the present price collapse is fundamentally different from the previous one…” “Yet here is a thought: $10 might actually be too optimistic. We may be heading for $5.” Low oil - with calls for it even lower… 6 March 1999 $40 Ernst & Young $20 $10.” 6
  • 7.
    It’s always doom& gloom close to the bottom! Economist Articles 1226% (31.9% p.a.) Source: Element Investment Managers, INET, 23 March 2017 7 41%
  • 8.
    MSCI Value vsMSCI Growth - rotation started Source: www.Schroders.com, Reuters, 31 December 2016 8
  • 9.
    Early days inValue cycle recovery… 9 US Equities
  • 10.
    Early days inValue cycle outperformance… 10 Cumulative outperformance of Deep Value from start of cycle in US
  • 11.
    P/B Valuation spreadsshow further opportunity … US Europe Japan
  • 12.
    PE Valuation spreadsshow further opportunity… 12
  • 13.
    Deep value strategiesrequire a long-term horizon… 13 2009 2016 Source: Alexander Forbes, Annual Retirement Fund Survey 2014 (17 March 2015)
  • 14.
    Finding value inexpensive equity markets 14
  • 15.
    ECB and BOJtaking over QE from FED 15 Source: Yardeni Research, Haver Analytics, 28 February 2017
  • 16.
    Central bank balancesheets continue to grow 16 Source: Yardeni Research, Haver Analytics, 28 February 2017 “I would venture a guess that without QE from the ECB and BOJ that 10- year U.S. Treasuries would rather quickly rise to 3.5% and the U.S. economy would sink into recession.” ~ Bill Gross
  • 17.
    Central banks wentfrom buying bonds to equities 17 Source: Grant Williams TTMYGH, Wall Street Journal, February 2017
  • 18.
    S&P 500 flatfor >9 years without QE… 18 Source: Grant Williams TTMYGH, Bloomberg, February 2017
  • 19.
    QE - growthdriver for global equity markets… 19 Source: Grant Williams TTMYGH, Bloomberg, February 2017
  • 20.
    S&P 500: Avery expensive entry point… 20 3rd 2nd 2nd
  • 21.
    US Equities: PEratios likely to contract… 21 Equity PEs expanded materially on QE (last 5 years) With reflation PEs are likely to contract (last 29 years) Source: Epoch IP, 26 January 2017 (Data to 31 December 2016)
  • 22.
    Buy Resources Sell Industrials SellResources Buy Industrials Series always reverts, only timing is uncertain ? Value investing: sectors are cyclical and rotate over time… 22Source: Element Investment Managers, 28 February 2017
  • 23.
    Resources – stilloverweight, but less so… We hold companies: Strong balance sheets Raised capital when necessary Aggressive deleveraging Material cost-cutting opportunities Could withstand another down leg in commodity prices Dividends likely to be resumed Running yield with optionality on recovery Material upside and strong cash flow at spot prices Diversifieds: Hold: BHPBilliton, South 32, Glencore Gold: Hold: AngloGold, Sibanye (under review) 23
  • 24.
    South 32 Strong balancesheet Net cash (zero debt) Could withstand another down leg in commodity prices Dividends resumed Running yield with optionality on recovery Potential for special dividend Material upside and strong cash flow at spot prices 24
  • 25.
    AngloGold: Strong FreeCash Flow Ave Gold Price = $1249/oz All In Costs (AIC) = $980 - $1010/oz Free Cash Flow = $254/oz (using mid guidance AIC) Gold Production = 3.6 – 3.65Moz Free Cash Flow = 3.6Moz x $254/oz = $914m ZAR Free CF = $914m x R12.56/$1 = R11.5bn ANG Market Cap = cR57bn @ R141 Price/Free CF = 5.0x (reasonable range: 5-10 times) ANG has reduced outstanding debt by > 1/3rd 25 Trading statement for 12 months ended December 2016, Share price, ZAR – 22 March 2017 close
  • 26.
    Earth Equity Top20 CTAR vs ALSI 26 Positions taken Benchmark ALSI CTAR Contribution to Active Return Element Earth Equity Fund: Average relative weights of the latest 12 months ending 28 February 17 Prefs
  • 27.
    Sale of non-coreassets > book value… …yet share trading < book value. Proceeds from sale being used to retire debt… …which resulted in decreased net financing costs. 27 Astrapak: Classic turnaround opportunity… Source: INETBFA, Element Investment Managers, 30 September 2016
  • 28.
    …that led toa buy-out* of Astrapak RPC Group Plc announced a buyout of Astrapak in December 2016 for R 1.37 billion. = R7.65 cash per share Premium of +42% to pre-announcement closing price of R5.40 + Dividend in specie for unbundled Flexible businesses (NAV of R247m) = R2.04 per share This implies a Price to Book Ratio of 1x. 28 1.9 1.2 0.9 1.2 1.0 0.8 0.7 0.7 0.6 0.5 1.0 0.0 0.2 0.4 0.6 0.8 1.0 1.2 1.4 1.6 1.8 2.0 2007A 2008A 2009A 2010A 2011A 2012A 2013A 2014A 2015A 2016A Current APK: Price-to-Book ratio Source: INETBFA, Element Investment Managers, 30 September 2016
  • 29.
    Value Investing requiresconviction and patience… 29 NAV Range Margin of Safety Stock trading 50% of NAV Element buys Astrapak Source: Element Investment Managers Research, Reuters, 23 March 2017
  • 30.
  • 31.
    Asset Allocation –Specialist Income Fund 31Source: Element Investment Managers Research, 28 February 2017 Specialist Income Fund % of Fund Cash + Call, MMkt and FRNs 60.8% Cash + Call 3.2% MMkt 45.4% FRNs 12.2% Fixed Rate Bonds 12.9% ILBs 0.9% Prefs 9.5% Equity (cash arb) 0.4% Property 15.5% Local Property 12.1% Foreign Property (in ZAR) 2.5% Foreign Property (not in ZAR) 0.8% Foreign Bonds 0.0% Total Fund 100.0% Prepared to take conviction calls on asset classes based on perceived market opportunities Not index hugging Investing in a range of different asset classes across different geographies Cross-pollination between debt and equity analysts
  • 32.
    Specialist Income Fund’sCTAR 32 Positions taken CTAR Contribution to Active Return Element Specialist Income Fund: Average absolute weights of the latest 12 months ending 28 February 17 % of Fund TRR if weighted to 100% CTAR Property & Prefs 25.4% 32.3% 8.2% Other Income Classes 74.6% 9.4% 7.0% Total Fund 100.0% 15.2%
  • 33.
    Pref Shares: Highyield along with capital upside 33Source: Reuters, Element Investment Managers, 14 March 2017 Name Fwd DivYield Upside to Par Grinrod Pref 11.9% 29% Invicta Pref 11.5% 8% PSG Pref 11.1% 27% Imperial Pref 11.0% 27% Steinhoff Pref 10.8% 25% INPR (Investec Ltd) 10.4% 28% Netcare Pref 10.1% 16% Discovery Pref 10.0% 2% INLP (Investec Bank local) 9.8% 12% Capitec 9.7% 11% Firstrand 9.6% 21% Standardbank Pref 9.4% 16% Nedbank 9.4% 7% Absa Pref 9.3% 27% Astrapak Pref 9.2% -1% African Phoenix 0.0% 139% Prefs bought back at par in the last 12 months: Brait Pref Investec Pref (x2) Astrapak Pref*
  • 34.
    Why will theBanks buy back their Prefs? 34Source: Reuters, Element Investment Managers, 20 March 2017
  • 35.
    APKP – priceand yield move from Dec’16 35Source: Reuters, Element Investment Managers, 28 February 2017
  • 36.
    36Source: Avior Research,9 January 2017 Drivers of property returns are two-fold Total Return = Capital Return + Income Return Capital Return = Share re-rating + Earnings Growth
  • 37.
    37Source: Avior Research,Element Investment Managers, 17 March 2017 Margin of safety in (1) dividend yield DY FY2 Dividend Yield Growth 4.0% 5.0% 6.0% 7.0% 8.0% 9.0% 10.0% 11.0% 12.0% 0% 4.0% 5.0% 6.0% 7.0% 8.0% 9.0% 10.0% 11.0% 12.0% 2% 4.1% 5.1% 6.1% 7.1% 8.2% 9.2% 10.2% 11.2% 12.2% 4% 4.2% 5.2% 6.2% 7.3% 8.3% 9.4% 10.4% 11.4% 12.5% 6% 4.2% 5.3% 6.4% 7.4% 8.5% 9.5% 10.6% 11.7% 12.7% 8% 4.3% 5.4% 6.5% 7.6% 8.6% 9.7% 10.8% 11.9% 13.0% 10% 4.4% 5.5% 6.6% 7.7% 8.8% 9.9% 11.0% 12.1% 13.2% 12% 4.5% 5.6% 6.7% 7.8% 9.0% 10.1% 11.2% 12.3% 13.4% 14% 4.6% 5.7% 6.8% 8.0% 9.1% 10.3% 11.4% 12.5% 13.7% 16% 4.6% 5.8% 7.0% 8.1% 9.3% 10.4% 11.6% 12.8% 13.9% 18% 4.7% 5.9% 7.1% 8.3% 9.4% 10.6% 11.8% 13.0% 14.2% 20% 4.8% 6.0% 7.2% 8.4% 9.6% 10.8% 12.0% 13.2% 14.4% Property stocks pay out close to 100% of their income: Property PE = 1 / DY High distribution growth off a low base does not necessarily add to an adequate margin of safety, similar to high growth & high PE shares
  • 38.
    38Source: Avior Research,January 2017 Margin of safety in (2) price-to-book
  • 39.
    HPB: removal ofhurdles weighing on price Source: Element Investment Managers, Reuters, 28 February 2017 First set of results post Tsogo transaction: Trading at 28% discount to NAV of R19.75 Normalised dividend yield of 12% (= PE of 8.3x ) Business (and share price) under pressure due to: • Fundamentals: Drop in demand for conference centres, over supply, high gearing • Banks demanding excessive short term funding spreads Leading to: • Heavily discounted rights issue • Different expectations from the two classes of shareholders
  • 40.
    Specialist Income –Property Holdings 40 Holdings as per Element Specialist Income Fund, 22 March 2017 Weight Forward Dividend Yield Premium/ Discount to NAV Exposure Type Hospitality Property 4.4% 11.1% -28% Hospitality Delta 3.2% 12.8% -16% Gov Offices Fortress A 2.1% 8.1% 9% Inflation Replica Vukile 2.0% 8.6% 5% Diversified / UK Logistics Mara Delta 1.8% 9.3% -15% Africa Diversified Hammerson 1.3% 4.4% -20% UK and EU Retail Growthpoint 0.5% 7.7% 7% Diversified / AUS Emira 0.5% 10.8% -15% Diversified / AUS SAPY 7.1% 19% Underlying holdings with adequate margin of safety, as displayed through: High starting forward dividend yield Significant discount to NAV
  • 41.
  • 42.
    Element performance hurdlesthat have historically indicated a sustainable turnaround: Material (>10%) outperformance in a short period of time (≤12 months) Earth Equity Fund relative performance in 2016 of +16.3% vs ALSI Element Equity outperformance for 1 month ranking in Top 10 since inception Feb 2016 relative performance of +6.9% vs ALSI and +7.5% vs SWIX Element funds moving up materially in the performance ranking tables All Element’s SA Unit Trusts - Top Quartile over rolling 12 months Value style in general: Other Value managers showing similar outperformance - YES Material rotation of outperformance of investment styles - YES Why Element’s recovery may be sustainable 42Source: Moneymate, December 2016
  • 43.
    Global Equity EarthEquity Flexible Balanced* Real Income* Specialist Income* Inception Date Feb-11 Oct-01 Oct-01 Nov-09 Oct-02 Dec-13 ASISA Category Global - Equity General South African - Equity General Multi Asset - Flexible Multi Asset - High Equity Multi Asset - Low Equity Multi Asset -Income Maximum Equity 100% 100% 100% 75% 40% 10% Benchmark MSCI World Index in ZAR ALSI CPI + 5% Average of Multi Asset – High Equity Group CPI + 3% 110% STeFi Current Fund Size R58 million R54 million R162 million R5 million R150 million R122 million Performance as at 28 February 2017 Fund Bench- mark Fund Bench- mark Fund ¹ Bench- mark Fund ¹ Bench- mark Fund ¹ Bench- mark Fund ¹ Bench- mark Annualised since Inception 16.6% 18.8% 13.3% 15.8% 13.0% 11.0% 8.0% 10.0% 10.6% 8.5% 7.3% 7.4% Ann. 10 Year 4.4% 10.2% 6.7% 11.4% 7.6% 9.4% Ann. 5 Year 18.8% 22.3% 2.2% 11.6% 7.5% 10.9% 9.1% 9.8% 9.1% 8.9% Ann. 3 Year 8.4% 12.1% 0.3% 5.7% 4.3% 10.8% 6.9% 5.9% 6.2% 8.8% 7.2% 7.4% Ann. 2 Year 4.4% 9.8% 1.0% 0.8% 6.2% 11.8% 10.0% 2.6% 8.3% 9.8% 11.3% 7.8% 1 Year -8.6% -0.5% 15.8% 6.3% 14.7% 11.6% 23.5% 4.2% 13.1% 9.6% 15.2% 8.3% YTD -0.8% -2.2% 5.6% 1.1% 6.6% 2.7% 17.6% 1.0% 4.9% 2.4% 4.1% 1.3% ABIL Impact Fund Bench- mark Fund Bench- mark Fund Bench- mark Fund Bench- mark Fund Bench- mark Fund Bench- mark ABIL Total Impact August 2014 -3.3% -7.7% -7.3% -7.1% -8.4% AXL/AXLP relisting 1 Feb 2017 2.3% 5.1% 16.9% 3.3% 2.2% * Regulation 28 Compliant 1 Weighted average performance including ABIL Retention Funds Performance is reported net of fees. Element: Unit Trust Performance 43
  • 44.
    Element Unit Trust:Peer Rankings Source: MoneyMate, 28 February 2017 44 Performance Start 2016/02/29 1Year Performance End 2017/02/28 Rank # Funds Target % % Rank Earth Equity 15.9% 14 227 5.7% 6% Flexible 14.5% 6 106 4.8% 6% Balanced 23.3% 1 220 3.8% 0% Real Income 12.6% 4 167 4.6% 2% Specialist Income 14.4% 2 89 8.6% 2% Rank # Funds Avg Perf Rel Perf Islamic Equity 14.6% 2 6 5.4% 9.2% Islamic Balanced 12.9% 1 4 5.7% 7.2% Performance End 2017/02/28 Rank # Funds Target % % Rank Global Equity -8.6% 58 66 -2.1% 88% Islamic Global Equity -9.9% 62 66 -2.1% 94%
  • 45.
    All Element’s SAUnit Trusts - Top Quartile over 12 months The outperformance, although short-term, is material >16%* in 2016 Normally indicative of the start of a turnaround Owner-managed and independent Value Manager Element remains true to Value philosophy Many boutiques have sold material stakes to listed entities No longer independent Long-term track record of over 19 years Shareholding and Manco restructure – business sustainability Materially incentivised Investment Team Why use Element as a Value Manager? * SA Equity 45
  • 46.
    Disclaimer Figures quoted arefrom Element Investment Managers (Pty) Limited, for the period ended February 2017, for a lump sum investment, using NAV-NAV with income distributions reinvested. Element Investment Managers claims compliance with the Global Investment Performance Standards (GIPS®). The firm includes all portfolios managed by Element Investment Managers. Element Investment Managers is an independent, owner- managed company. It provides discretionary investment management services to retail and institutional clients. Element Investment Managers has been verified for the period: 1 January 2003 to 31 December 2015 Copies of our verification reports are available on request. A complete list and description of our composites is available by contacting Sharifa Jaffer at: +27 21 426 1313 or at sharifa@elementim.co.za 46
  • 47.
    Collective Investment Schemesin Securities (CIS) are generally medium to long term investments. The value of participatory interests may go down as well as up and past performance is not necessarily a guide to the future. CIS prices are calculated on a net asset value (NAV) basis which is the total value of all assets in the fund, including any income accrual and less all permissible deductions from the portfolio. CIS are traded at ruling prices and can engage in borrowing and scrip lending. Different classes of participatory interests apply to the funds and are subject to different fees and charges. A schedule of fees and charges and maximum commissions is available on request from the company/scheme. Commission and incentives may be paid and if so, would be included in the overall costs. Fluctuations or movements in exchange rates may cause the value of underlying international investments to go up or down. The funds are valued daily at 15h00 and forward pricing is used. The funds may be closed to new investments at any time in order to be managed in accordance with its mandate. Past performance is not indicative of future performance. Disclaimer 47
  • 48.