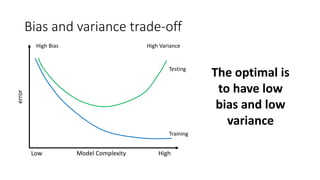
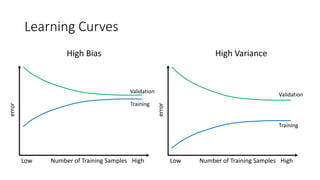
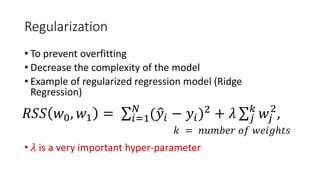
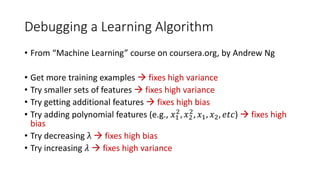
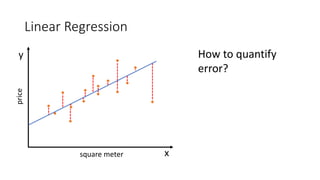
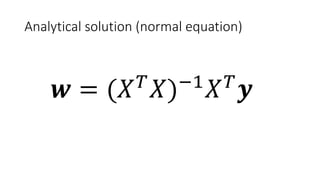
This document provides an overview of regression analysis and linear regression. It explains that regression analysis estimates relationships among variables to predict continuous outcomes. Linear regression finds the best fitting line through minimizing error. It describes modeling with multiple features, representing data in vector and matrix form, and using gradient descent optimization to learn the weights through iterative updates. The goal is to minimize a cost function measuring error between predictions and true values.


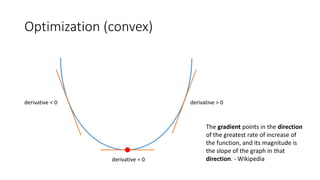
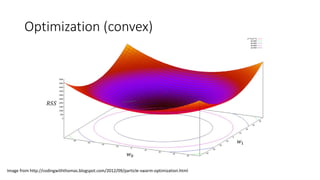
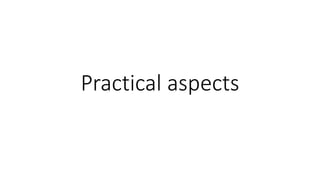
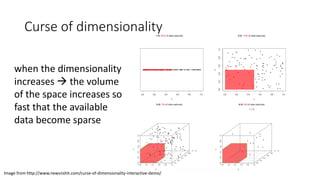
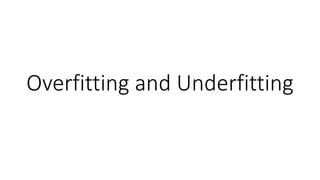
![Optimization (convex)
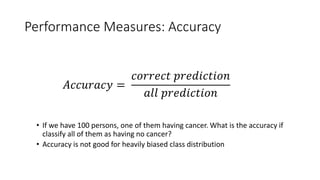
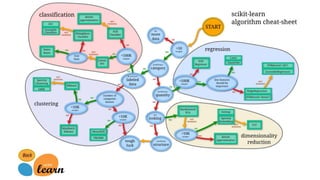
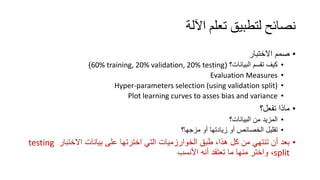
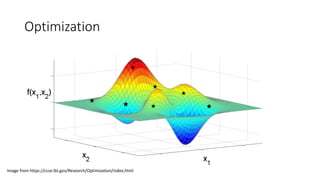
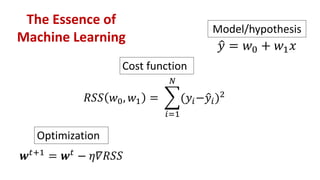
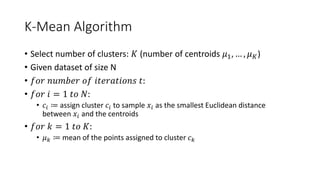
• First, lets compute the gradient of our cost function
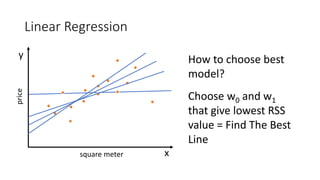
• To find best lines, there are two ways:
• Analytical (normal equation)
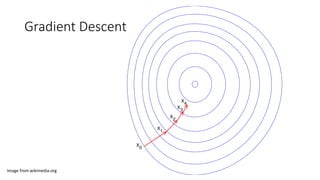
• Iterative (gradient descent)
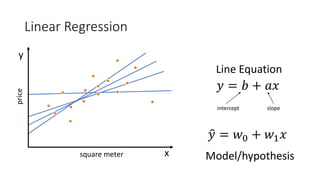
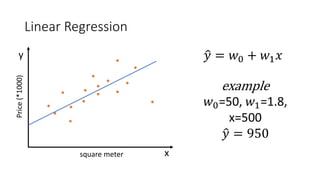
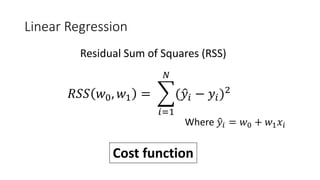
Where �𝑦𝑦𝑖𝑖 = 𝑤𝑤0 + 𝑤𝑤1 𝑥𝑥𝑖𝑖
𝛻𝛻𝑅𝑅𝑅𝑅𝑅𝑅(𝑤𝑤0, 𝑤𝑤1) =
−2 ∑𝑖𝑖=1
𝑁𝑁
[�𝑦𝑦𝑖𝑖 − 𝑦𝑦𝑖𝑖]
−2 ∑𝑖𝑖=1
𝑁𝑁
[�𝑦𝑦𝑖𝑖 − 𝑦𝑦𝑖𝑖]𝑥𝑥𝑖𝑖](https://image.slidesharecdn.com/random-170319105652/85/slide-16-320.jpg)
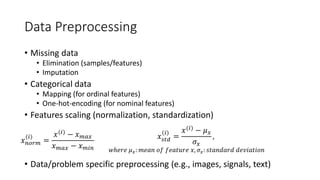
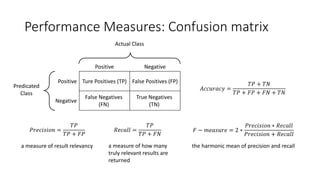
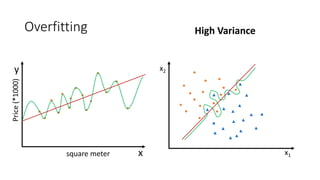
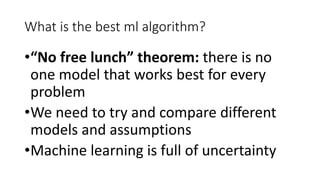
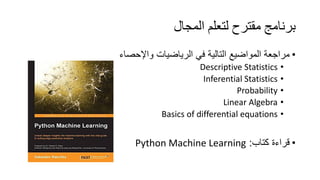
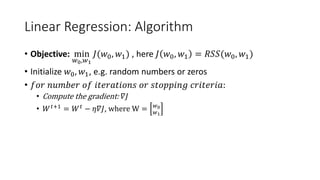
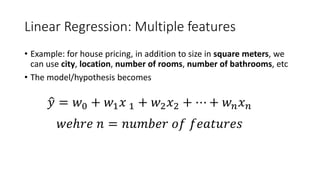
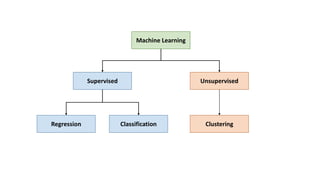
![Gradient Descent
𝒘𝒘𝑡𝑡+1
= 𝒘𝒘𝑡𝑡
− 𝜂𝜂𝜂𝜂𝜂𝜂𝜂𝜂𝜂𝜂
𝑤𝑤0
𝑡𝑡+1
𝑤𝑤1
𝑡𝑡+1 =
𝑤𝑤0
𝑡𝑡
𝑤𝑤1
𝑡𝑡 − 𝜂𝜂
−2 ∑𝑖𝑖=1
𝑁𝑁
[�𝑦𝑦𝑖𝑖 − 𝑦𝑦𝑖𝑖]
−2 ∑𝑖𝑖=1
𝑁𝑁
[�𝑦𝑦𝑖𝑖 − 𝑦𝑦𝑖𝑖]𝑥𝑥𝑖𝑖
Update the weights to minimize the cost function
𝜂𝜂 is the step size (important hyper-parameter)](https://image.slidesharecdn.com/random-170319105652/85/slide-17-320.jpg)
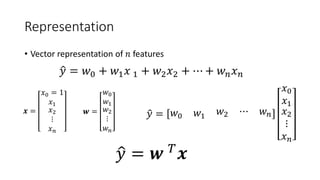
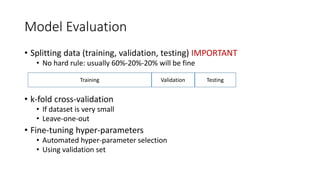
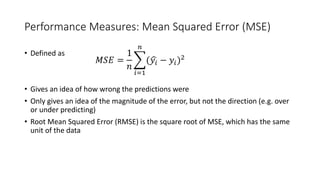
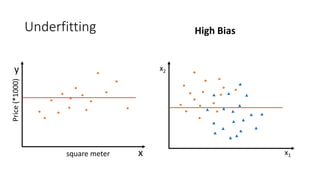
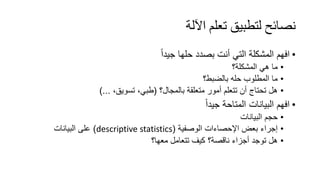
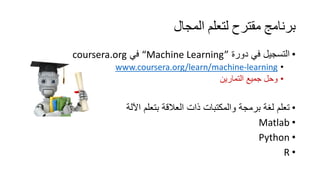
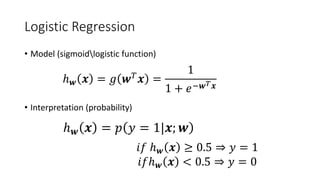
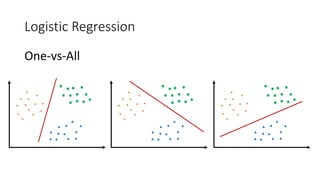
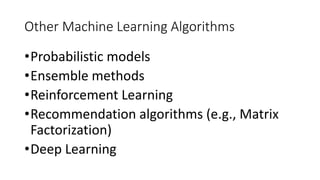
![Logistic Regression
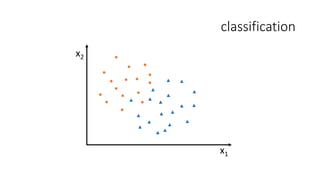
• How to turn regression problem into classification one?
• y = 0 or 1
• Map values to [0 1] range
𝑔𝑔 𝑥𝑥 =
1
1 + 𝑒𝑒−𝑥𝑥
Sigmoid/Logistic Function](https://image.slidesharecdn.com/random-170319105652/85/slide-30-320.jpg)

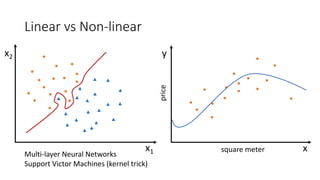
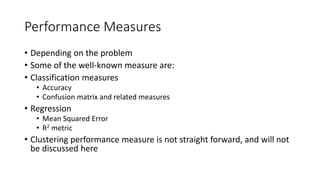
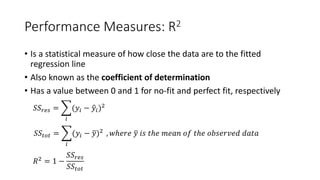
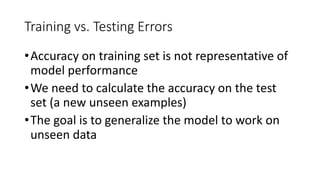
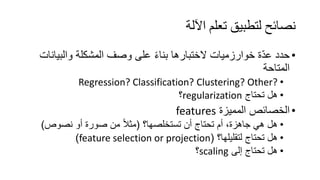
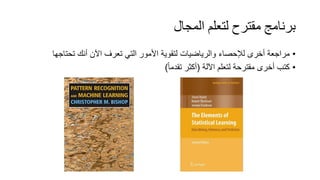
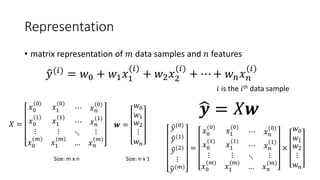
![Kernel Trick 𝐾𝐾 𝑥𝑥1, 𝑥𝑥2 = [𝑥𝑥1, 𝑥𝑥2, 𝑥𝑥1
2
+ 𝑥𝑥2
2
]
Image from http://www.eric-kim.net/eric-kim-net/posts/1/kernel_trick.html](https://image.slidesharecdn.com/random-170319105652/85/slide-62-320.jpg)