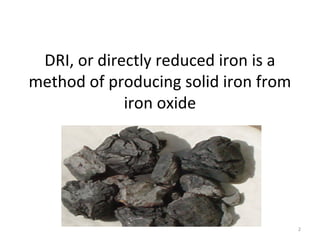
Pollution in Coal Based
          DRI
  Summer Internship Project, 2012
          Supervised by
    Susmita Dasgupta, ERU, JPC


                                    1
DRI, or directly reduced iron is a
method of producing solid iron from
             iron oxide


                                      2
Prepared by Nilopher Khan and Garima Sharma, Teri University
Supervised by Dr Susmita Dasgupta

PRESENTED TO ECONOMIC
RESEARCH UNIT, JOINT PLANT
COMMITTEE, JULY 2012
                                                               3
Iron from iron ore can be
• In solid form               • Or in molten form
In solid form, iron ore can   In molten form iron can
   be                            be produced in the
1. DRI produced in coal       1. Blast Furnace, needs
   based kilns                   coking coal.
2. HBI produced in gas        2. Corex , can use
   based kiln.                   significant quantities of
3. DRI does not need             non coking coal but
   coking coal at all.           cannot do away with it
                                 totally.

                                                             4
DRI is preferred in India because of
1.Small scale of production.
2.Access to iron ore.
3.Paucity of coking coal in India.
 Between 2004-05 and 2009-10, the DRI
  production in India has increased by 24% as
  compared to only 8% for steel per annum. For
  steel produced through the coking coal route,
  the production growth is only 5.5%.
• Source: JPC ,2011.
                                              5
In India, 27% of all steel is produced
           through coal DRI
       And 7% of all steel is produced through Gas DRI
            And 20% is through the scrap route.

                     Source: JPC,2012


                                                         6
This means that the DRI segment is a vital constituency of the steel
industry.

54% OF INDIAN STEEL IS THROUGH THE
NON BLAST FURNACE ROUTE.
SOURCE: JPC, 2012.
                                                                       7
India is the world’s largest producer
               of DRI
   India produced 28 million tonnes of DRI in 2010
         as against 57 million tonnes of global
                      production.

             Source: World Steel Association, 2012.


                                                      8
DRI is
  produced
  and consumed
locally; being unstable
  in composition, DRI
  cannot be exported
   out or transported
  over long distances.
 Factories are located
 close to raw material
         sources

                          9
No wonder then most DRI
  plants are located in Odisha,
    Jharkhand, Chhattisgarh,
  West Bengal and Karnataka


Since they are rich
  in iron ore and
        coal.


Source: CSE, 2012.


                                  10
Raw            DRI Process
             materials,
             partly coal,
              iron ore,                                                        After Burn
                                                 Flue gas                      Chamber
            fluxes enter
           the rotary kiln

                                                            The remainder
                    Rotary kiln                                 coal in
                                = 2.5% Slo
                     and 0.47 rp            pe              powdered form
                                  m sp e e d                 and hot air is
                                                               charged

 Preheating                               Solid iron and
    zone or                               unburnt char,
combustion zone                           lime is
  where coal is
    heated                                discharged


                                                            Cooler discharge
                                                              and product
                                                               separator
                                                                                            11
12
Paths of Iron and Gas
DRI Route              Reactant Gas route
1. Raw material yard   1. Rotary kiln discharge or
2. Crusher, screener      combustion end.
3. Rotary kiln         2. Gas Conditioning tower
4. Recuperator         3. After Burn Chamber
5. Cooler discharge    4. Gas cleaning plant
6. Product separator   5. Dust settling chamber
7. Stock house
                       6. Waste Heat Recovery
8. Loading points         Boiler
9. Trucks
                       7. Stack

                                                     13
Input Output In DRI Plants
                                     per tonne of DRI


Matter             Input                                   Output
Solids             Iron Ore 6-20 mm : 1500 kg              Sponge Iron +3 mm: 790 kg
                   Coal 0-3 mm : 300 kg                    Sponge Iron 1-3 mm: 210 kgs
                   Coal 3-15 mm: 700 kg                    Sponge Iron -1 mm: 50 kg
                   Limestone: 0-3 mm: 75 kg                Char +3mm :30 kg
                                                           Char 1-3mm: 75 kg
                                                           Char -1mm:195 kg

Air                6000 Nm3                                5000 Nm3
Energy in Gcal     Coal = 6                                Char = 1.15
= 10 (9)                                                   Cooling 0.3
                                                           Sponge Iron =1.7
                                                           Waste Heat Recovered = 2.25
                                                           Unaccounted radioactive = 0.5
Source: http://www.newagepublishers.com/samplechapter/001741.pdf                           14
Unfortunately,
DRI is a polluting
    industry
      Air, water, solid
     wastes containing
   mainly PM, SO2, NOX
    and CO abound the
          ambient
       environment.
     Source: CPCB,2008


                          15
Garbage Factor for a tonne of sponge
              iron unit.
INPUT (in Tonnes)                  OUTPUT (in Tonnes)
1.6-1.75 Iron Ore                  1.8-2 Carbon Dioxide
1.2-1.5 Coal                       0.25 Dust
0.035-0. 5 Dolomite                0.29 Coal Char
1.5-2 Water                        0.02 Kiln accretions
                                   0.2 Sulfur Dioxide with water vapour
                                   Water vapour
Source: Down to Earth, September 16,2006.


                                                                          16
Sources of Air Pollution
Process                           Fugitive
1. Combustion of coal in the      1. Raw material handling and
   preheating zone, kiln
2. Oxidation of iron ore in the
                                     feeding area.
   process zone, kiln             2. Recuperator (in lieu of
3. Flue gas from the kiln            WHRB)
   through the upper end.
4. Dust of char, unburnt lime,    3. Discharge end and cooler
   sulphur, alumina and others       discharge.
   through the discharge end.
                                  4. Product separator.
5. Flue gas through the cap of
   the After Burn Chamber.        5. Work area of plant.
6. Particulate matter from ESP


                                                             17
Dust Collection Centers
                                    Source: CSE 2008

Location                                               Nomenclature

Raw material storage yard                              Stock house

Coal is crushed for charging as powder                 Coal Crusher

Iron ore is crushed to fit 5 to 16 mm size             Iron crusher

Raw materials sent to plants                           Transfer points

Sponge iron is cooled by spraying water                Cooler discharge

Sponge iron rests before screening and separation      Intermediate bin

Sponge iron is separated from char                     Product separation

Product is stocked                                     Product house
                                                                            18
Norms of Air Pollution
                      Source: CPCB, 2010.


Process                          Fugitive
• 100 mg/Nm3 for CPCB.           • 2 mg/Nm3
• Lower at 86 mg/Nm3 for
  Karnataka, 69mg/Nm3 for
  Chhattisgarh.


                                              19
Sources of water consumption and
               pollution
Water consumption                Water pollution
1. Rotary kiln cooler.           1. Cooler discharge contains
2. Cooler discharge.                solid waste particle.
                                 2. Gas coolers also contain solid
3. Gas Cooling                      particles.
 Water is circulating water     3. Some sulphides are mixed
   in the sense the water           irretrievably into water.
   which is used to cool the     4. Water is sprayed on dust
   kilns is again used to cool      while disposing it off in
   the coolers of solid             trucks.
   discharge and flue gas.       5. Water in gas scrubbing may
   Make up water is kept in         contain PAH compounds.
   reserve.
                                                                 20
Water Requirement in m3/tonne DRI
Purpose             Water in m3/tonne DRI   Nature of water


Cooling             1.32                    Circulating and non contact

ABC                 0.48                    Direct and contact
Dust suppression    0.30                    Direct and contact

Wet Scrubber        0.78                    Direct and contact

Total Contact       1.54                    To be recycled
Total Circulating   1.32                    To be made up
Total Water         2.88

Source: CSE, 2008


                                                                     21
707 kgs/ tonne of DRI is solid waste.
              Source: CSE,2012


                                        22
Solid waste
from DRI is wet
   dust in the
 form of sludge

  And is mostly
allowed to drain
 out into rivers,
  ponds, fields.


                    23
Solid waste in DRI Plants
                              Source CSE, June 2012
Dust               Due to                          Source                            Percentage
                                                                                     of Total Dust

Char Dust          Incomplete combustion.          Rotary kiln, Recuperator          42%
                   Gangue and stony elements.

ESP Dust           Ash in coal, incomplete waste   Stack connected to ESP            24%
                   recovery and gas cleaning.
Dust Settling      Impurities in raw materials,    Stack connected to Gas Cleaning   3%
Chamber            incomplete combustion of        Plant, sometimes the Waste
                   coal, poor oxidation of ore.    Heat Recovery Boiler.

Cooler Discharge   Due to physical fall of         Ambient spillage, bag filter      15%
and Product        material
Separating area
ABC Dust           Poor waste heat recovery        ABC Cap                           5%


Kiln accretions    Poor quality coal, non          Stack connected to kiln           11%
                   preheated material, over
                   oxidation of iron ore due to
                   presence of sulphur.
                                                                                           24
Standard Norms for discharged effluents.
            Source: CPCB, 2008.
PARAMETER                   PERMISSIBLE LIMIT
pH                          6.5 ~ 8.5
COD (mg/L)                  250
BOD (mg/L)                  30
O & G (mg/L)                10
Flouride (mg/L)             5
Hexavalent Chromium         0.1
(mg/L)
Iron (mg/L)                 3
Total Chromium (mg/L)       2
Manganese                   2
(mg/L)
TSS (mg/L)                  100
Cyanide (mg/L)              0.2
Phenolic Compounds (mg/L)   1
Sulphide (mg/L)             2                   25
Pollution from the sponge iron
  industries is the core reason why
communities rise in arms against this
               industry.


                                        26
Various CSE Reports of 2008 inform us

1. In Odisha, women from the Bonai Vana Suraksha Committee
   marched up to the District Collector with samples of soil,
   water and grain to protest against sponge iron plants.
2. Similar protests in Keonjhar and Sundargarh.
3. In Chhattisgarh, popular protests led to closure of offending
   units and discovery of illegal operators.
4. Public protests in Chhatisgarh were around a sudden
   increase in respiratory diseases and skin allergies.
5. In Andhra Pradesh people filed cases in courts and obtained
   compensation for lost kharif crops.
6. In Karnataka, there is an ongoing protest in Bellary against
   sponge iron industries.

                                                               27
Blast Furnace vs. DRI
                        Source: CSE,2012.
BF must be taken together with
Coke Ovens and Sinter Plants     Coal based DRI
• Raw material consumption       • Raw material consumption
  in tonnes per tonne of iron      in tonnes per tonne of iron
  = 3.5                            = 5.08
• Thermal Energy
  Consumption = 0.4 ( C0)        • Thermal Energy
  +0.5 (Sinter/Pellet) + 4.5       Consumption = 7.5Gcal/
  (BF) = 5.4 Gcal/ tonne of        tonne
  iron
                                 • Pollution Norms = 100
• Pollution Norms = 50 ( CO) +
  100 (Sinter/Pellet) + 150        mg/Nm3
  (BF) = 300 mg/Nm3


                                                                 28
Blast furnaces have higher stack
 heights due to larger volume
  DRI have lower stack due to smaller
  volumes and hence pollution impact
              is higher.
                                        29
Interestingly, Coal DRI is one third as much polluting as
the Blast Furnace
Raising the stack height might actually help.


                                                            30
WEST BENGAL CASE
     STUDY
                   31
Features of sample
1. Nearly 95% of sponge iron units in West Bengal have
   been considered.
2. All plants are declared as red hot.
3. Plants occur in clusters like Durgapur, Jamuria and
   others in Burdwan; in Bankura, Purulia, Haldia in East
   Midnapore and in West Midnapore.
4. All plants had run for 720 hours from the last
   measurement.
5. All plants are coal based DRI, using SL/RN Process.
6. Sampling was done for 25 to 30 minutes.

                                                        32
Data reveals
1.   Size is not related to flouting of norms. Lower stack heights are not
     related to pollution.
2.   Commonest source of pollution is the kiln area due to combustion and
     carbonization faults. This is due to poor quality of raw materials.
3.   Due to poor combustion, thermal efficiency is low and heat exchange is
     also low.
4.   The existence of pollution control equipment does not guarantee clean
     operations. Poor raw material quality may not permit the proper
     running of facilities.
5.   Sulphides lead to higher temperature of flue gas.
6.   High CO2 interferes in nitrogen cycle leading to high Nox in emissions.
7.   Sludge is not controlled because of poor commercial reuse value.
8.   Char is generated due to low quality of coal.

                                                                               33
CSE Study, West Bengal Sponge Iron
      Industry Clusters November 2011
1.   WBPCB fails to control pollution. Irregular monitoring. No
     enforcement.
2.   Factories are repeat and habitual offenders.
3.   92% of inspection reports show abnormally high emissions from
     the kilns.
4.   52% fail to meet emission standards.
5.   Solid waste management is pathetic.
6.   Open storage of raw materials a major issue.
7.   Sponge Iron units do not use the pollution control equipment.

Source: WBPCB,2011.


                                                                     34
West Midnapore, CSE Report
• People’s movement very strong against the
  sponge iron industry especially Rashmi Cement/
  Ispat in 2009, in West Midnapore.
• Maoist politics emerged solely due to pollution
  from sponge iron plants in West Midnapore.
• Pollution Control Board found gross violation on
  water, air and solid waste disposal.
• Nagarik Mancha led campaign against Rashmi
  Ispat.
                                                     35
Jamuria, Burdwan
• Poor water quality.
• Cattle has stopped grazing.
• Fish inedible.
• Units release pollutants at night from the ABC
  cap to avoid inspection.
• Due to water shortage in Jamuria, water is not
  used as dust suppressant.

                                               36
West Bengal Pollution Control Board
• Romita Dutta in Live mint reports that WBPCB
  has issued closure notice to 50-60 units out of
  the 250 units in West Bengal.
• More than 40% of the units in West Bengal
  violate the environment.
• WBPCB claims that night inspection in West
  Midnapore was stalled because of Maoists.
• According to WBPCB, air pollution has been
  the main problem.
                                                37
CSE Recommendations
• Kilns with capacity less than 300 tpd should be
  phased out.
• Only integrated plants should be allowed in
  the future.
• Mandatory standards for material handling,
  storage and transportation must be enacted.
• New cluster based standards should be
  imposed.
• Stricter enforcement.
                                                38
Pollution Control Mechanisms (CSE &
       CPCB Recommendations)
1. Concrete floor in the work area as well as in the material
   handling area.
2. Use of covered trucks and enclosed hoppers to transport
   dust and ash.
3. To put a WHRB after the ABC so that the GCC is avoided.
4. Use of ESP instead of the DSC attached to ABC and GCC.
5. Use of magnetic separator at the discharge end.
6. Use of suction hood, bag filter and ESP to cooler
   discharge.
7. Use of raw material i.e. coal preheating to reduce energy
   consumption and char.
8. Use of pellets.

                                                                39
Our recommendations for waste
            Utilization in DRI
• Char is used as fuel in thermal power plants, industries
  and domestic purposes. Coal fines can be mixed with
  char fines for fuel.
• Dust and fly ash can be made into bricks.
• Kiln accretions and slag can be used as landfills and road
  making.
• Product circuit dust can be used as activated carbon in
  edible oil refineries.
• Dolchar and char can be used in cement making.
• Waste Heat is recovered in captive power plants.
• Waste water recycled as make-up water.
                                                               40
Our Recommendations ( Technical)
1.   We can set up air quality monitoring stations to track certain specified air
     pollutants and toxins. Delhi for example has set up several real time air quality
     monitoring stations. The system uses Lidar (light detection and ranging)
     technology, which releases and captures a laser beam and measures the before-
     after difference to gauge the concentrations of various pollutants in the air.
2.   Construction of screen grit chambers to trap the sludge from the effluent
     through the introduction of de-salting tables to minimize the quantity of salt in
     the effluent.
3.   Use of Sonic Horns, a pneumatically actuated device which produces high
     pressure acoustic energy or sound waves that are capable of fluidizing powder
     that adheres to surfaces in the bag filter. This low frequency vibration provides
     an effective means of cleaning the filter. The FES sonic horn helps in the removal
     of powder from walls, ceilings, curtain, and filter bags in the dust collector. (
     http://www.fesintl.com/htmfil.fld/sonichrn.htm )
4.   Use of Heat pipe Exchangers instead of WHRB, which can transfer up to 100
     times more thermal energy than copper, the best known conductor. Heat pipe is
     a thermal energy absorbing and transferring system and have no moving parts
     and hence require minimum maintenance.


                                                                                     41
New Gadgets
Heat Pipe Exchanger (HPHE)   Sonic Horn


                                          42
Our Recommendations (Legal)
• reduction of green house gas by
  implementation of clean development
  mechanism (listed by UNDP/GEF) is found to
  be depend upon the sincerity and integrity of
  the plant owner.
• Granting land on lease basis with ultimate
  owner as the community.
• Granting license on term basis to the plant
  owners.

                                                  43
Our recommendations (Institutional)
1. Sponge iron industries may come under a cooperative
   organization for management of waste.
2. Assured quality of raw materials must be provided. Raw
   material quality must be declared.
3. Pooled resources to set up common facilities towards
   pelletization, or ore beneficiation, transportation and
   others.
4. Electronic alarms in the Air monitoring systems (that use
   LIDAR technology) might be set up on facilities connected to
   a central computer which shuts operations whenever limits
   of emission are crossed. This has been CPCB’s
   recommendation for a long time.
                                                              44
THANK YOU


            45

Sponge Iron Industry

  • 1.
    Pollution in CoalBased DRI Summer Internship Project, 2012 Supervised by Susmita Dasgupta, ERU, JPC 1
  • 2.
    DRI, or directlyreduced iron is a method of producing solid iron from iron oxide 2
  • 3.
    Prepared by NilopherKhan and Garima Sharma, Teri University Supervised by Dr Susmita Dasgupta PRESENTED TO ECONOMIC RESEARCH UNIT, JOINT PLANT COMMITTEE, JULY 2012 3
  • 4.
    Iron from ironore can be • In solid form • Or in molten form In solid form, iron ore can In molten form iron can be be produced in the 1. DRI produced in coal 1. Blast Furnace, needs based kilns coking coal. 2. HBI produced in gas 2. Corex , can use based kiln. significant quantities of 3. DRI does not need non coking coal but coking coal at all. cannot do away with it totally. 4
  • 5.
    DRI is preferredin India because of 1.Small scale of production. 2.Access to iron ore. 3.Paucity of coking coal in India.  Between 2004-05 and 2009-10, the DRI production in India has increased by 24% as compared to only 8% for steel per annum. For steel produced through the coking coal route, the production growth is only 5.5%. • Source: JPC ,2011. 5
  • 6.
    In India, 27%of all steel is produced through coal DRI And 7% of all steel is produced through Gas DRI And 20% is through the scrap route. Source: JPC,2012 6
  • 7.
    This means thatthe DRI segment is a vital constituency of the steel industry. 54% OF INDIAN STEEL IS THROUGH THE NON BLAST FURNACE ROUTE. SOURCE: JPC, 2012. 7
  • 8.
    India is theworld’s largest producer of DRI India produced 28 million tonnes of DRI in 2010 as against 57 million tonnes of global production. Source: World Steel Association, 2012. 8
  • 9.
    DRI is produced and consumed locally; being unstable in composition, DRI cannot be exported out or transported over long distances. Factories are located close to raw material sources 9
  • 10.
    No wonder thenmost DRI plants are located in Odisha, Jharkhand, Chhattisgarh, West Bengal and Karnataka Since they are rich in iron ore and coal. Source: CSE, 2012. 10
  • 11.
    Raw DRI Process materials, partly coal, iron ore, After Burn Flue gas Chamber fluxes enter the rotary kiln The remainder Rotary kiln coal in = 2.5% Slo and 0.47 rp pe powdered form m sp e e d and hot air is charged Preheating Solid iron and zone or unburnt char, combustion zone lime is where coal is heated discharged Cooler discharge and product separator 11
  • 12.
  • 13.
    Paths of Ironand Gas DRI Route Reactant Gas route 1. Raw material yard 1. Rotary kiln discharge or 2. Crusher, screener combustion end. 3. Rotary kiln 2. Gas Conditioning tower 4. Recuperator 3. After Burn Chamber 5. Cooler discharge 4. Gas cleaning plant 6. Product separator 5. Dust settling chamber 7. Stock house 6. Waste Heat Recovery 8. Loading points Boiler 9. Trucks 7. Stack 13
  • 14.
    Input Output InDRI Plants per tonne of DRI Matter Input Output Solids Iron Ore 6-20 mm : 1500 kg Sponge Iron +3 mm: 790 kg Coal 0-3 mm : 300 kg Sponge Iron 1-3 mm: 210 kgs Coal 3-15 mm: 700 kg Sponge Iron -1 mm: 50 kg Limestone: 0-3 mm: 75 kg Char +3mm :30 kg Char 1-3mm: 75 kg Char -1mm:195 kg Air 6000 Nm3 5000 Nm3 Energy in Gcal Coal = 6 Char = 1.15 = 10 (9) Cooling 0.3 Sponge Iron =1.7 Waste Heat Recovered = 2.25 Unaccounted radioactive = 0.5 Source: http://www.newagepublishers.com/samplechapter/001741.pdf 14
  • 15.
    Unfortunately, DRI is apolluting industry Air, water, solid wastes containing mainly PM, SO2, NOX and CO abound the ambient environment. Source: CPCB,2008 15
  • 16.
    Garbage Factor fora tonne of sponge iron unit. INPUT (in Tonnes) OUTPUT (in Tonnes) 1.6-1.75 Iron Ore 1.8-2 Carbon Dioxide 1.2-1.5 Coal 0.25 Dust 0.035-0. 5 Dolomite 0.29 Coal Char 1.5-2 Water 0.02 Kiln accretions 0.2 Sulfur Dioxide with water vapour Water vapour Source: Down to Earth, September 16,2006. 16
  • 17.
    Sources of AirPollution Process Fugitive 1. Combustion of coal in the 1. Raw material handling and preheating zone, kiln 2. Oxidation of iron ore in the feeding area. process zone, kiln 2. Recuperator (in lieu of 3. Flue gas from the kiln WHRB) through the upper end. 4. Dust of char, unburnt lime, 3. Discharge end and cooler sulphur, alumina and others discharge. through the discharge end. 4. Product separator. 5. Flue gas through the cap of the After Burn Chamber. 5. Work area of plant. 6. Particulate matter from ESP 17
  • 18.
    Dust Collection Centers Source: CSE 2008 Location Nomenclature Raw material storage yard Stock house Coal is crushed for charging as powder Coal Crusher Iron ore is crushed to fit 5 to 16 mm size Iron crusher Raw materials sent to plants Transfer points Sponge iron is cooled by spraying water Cooler discharge Sponge iron rests before screening and separation Intermediate bin Sponge iron is separated from char Product separation Product is stocked Product house 18
  • 19.
    Norms of AirPollution Source: CPCB, 2010. Process Fugitive • 100 mg/Nm3 for CPCB. • 2 mg/Nm3 • Lower at 86 mg/Nm3 for Karnataka, 69mg/Nm3 for Chhattisgarh. 19
  • 20.
    Sources of waterconsumption and pollution Water consumption Water pollution 1. Rotary kiln cooler. 1. Cooler discharge contains 2. Cooler discharge. solid waste particle. 2. Gas coolers also contain solid 3. Gas Cooling particles.  Water is circulating water 3. Some sulphides are mixed in the sense the water irretrievably into water. which is used to cool the 4. Water is sprayed on dust kilns is again used to cool while disposing it off in the coolers of solid trucks. discharge and flue gas. 5. Water in gas scrubbing may Make up water is kept in contain PAH compounds. reserve. 20
  • 21.
    Water Requirement inm3/tonne DRI Purpose Water in m3/tonne DRI Nature of water Cooling 1.32 Circulating and non contact ABC 0.48 Direct and contact Dust suppression 0.30 Direct and contact Wet Scrubber 0.78 Direct and contact Total Contact 1.54 To be recycled Total Circulating 1.32 To be made up Total Water 2.88 Source: CSE, 2008 21
  • 22.
    707 kgs/ tonneof DRI is solid waste. Source: CSE,2012 22
  • 23.
    Solid waste from DRIis wet dust in the form of sludge And is mostly allowed to drain out into rivers, ponds, fields. 23
  • 24.
    Solid waste inDRI Plants Source CSE, June 2012 Dust Due to Source Percentage of Total Dust Char Dust Incomplete combustion. Rotary kiln, Recuperator 42% Gangue and stony elements. ESP Dust Ash in coal, incomplete waste Stack connected to ESP 24% recovery and gas cleaning. Dust Settling Impurities in raw materials, Stack connected to Gas Cleaning 3% Chamber incomplete combustion of Plant, sometimes the Waste coal, poor oxidation of ore. Heat Recovery Boiler. Cooler Discharge Due to physical fall of Ambient spillage, bag filter 15% and Product material Separating area ABC Dust Poor waste heat recovery ABC Cap 5% Kiln accretions Poor quality coal, non Stack connected to kiln 11% preheated material, over oxidation of iron ore due to presence of sulphur. 24
  • 25.
    Standard Norms fordischarged effluents. Source: CPCB, 2008. PARAMETER PERMISSIBLE LIMIT pH 6.5 ~ 8.5 COD (mg/L) 250 BOD (mg/L) 30 O & G (mg/L) 10 Flouride (mg/L) 5 Hexavalent Chromium 0.1 (mg/L) Iron (mg/L) 3 Total Chromium (mg/L) 2 Manganese 2 (mg/L) TSS (mg/L) 100 Cyanide (mg/L) 0.2 Phenolic Compounds (mg/L) 1 Sulphide (mg/L) 2 25
  • 26.
    Pollution from thesponge iron industries is the core reason why communities rise in arms against this industry. 26
  • 27.
    Various CSE Reportsof 2008 inform us 1. In Odisha, women from the Bonai Vana Suraksha Committee marched up to the District Collector with samples of soil, water and grain to protest against sponge iron plants. 2. Similar protests in Keonjhar and Sundargarh. 3. In Chhattisgarh, popular protests led to closure of offending units and discovery of illegal operators. 4. Public protests in Chhatisgarh were around a sudden increase in respiratory diseases and skin allergies. 5. In Andhra Pradesh people filed cases in courts and obtained compensation for lost kharif crops. 6. In Karnataka, there is an ongoing protest in Bellary against sponge iron industries. 27
  • 28.
    Blast Furnace vs.DRI Source: CSE,2012. BF must be taken together with Coke Ovens and Sinter Plants Coal based DRI • Raw material consumption • Raw material consumption in tonnes per tonne of iron in tonnes per tonne of iron = 3.5 = 5.08 • Thermal Energy Consumption = 0.4 ( C0) • Thermal Energy +0.5 (Sinter/Pellet) + 4.5 Consumption = 7.5Gcal/ (BF) = 5.4 Gcal/ tonne of tonne iron • Pollution Norms = 100 • Pollution Norms = 50 ( CO) + 100 (Sinter/Pellet) + 150 mg/Nm3 (BF) = 300 mg/Nm3 28
  • 29.
    Blast furnaces havehigher stack heights due to larger volume DRI have lower stack due to smaller volumes and hence pollution impact is higher. 29
  • 30.
    Interestingly, Coal DRIis one third as much polluting as the Blast Furnace Raising the stack height might actually help. 30
  • 31.
  • 32.
    Features of sample 1.Nearly 95% of sponge iron units in West Bengal have been considered. 2. All plants are declared as red hot. 3. Plants occur in clusters like Durgapur, Jamuria and others in Burdwan; in Bankura, Purulia, Haldia in East Midnapore and in West Midnapore. 4. All plants had run for 720 hours from the last measurement. 5. All plants are coal based DRI, using SL/RN Process. 6. Sampling was done for 25 to 30 minutes. 32
  • 33.
    Data reveals 1. Size is not related to flouting of norms. Lower stack heights are not related to pollution. 2. Commonest source of pollution is the kiln area due to combustion and carbonization faults. This is due to poor quality of raw materials. 3. Due to poor combustion, thermal efficiency is low and heat exchange is also low. 4. The existence of pollution control equipment does not guarantee clean operations. Poor raw material quality may not permit the proper running of facilities. 5. Sulphides lead to higher temperature of flue gas. 6. High CO2 interferes in nitrogen cycle leading to high Nox in emissions. 7. Sludge is not controlled because of poor commercial reuse value. 8. Char is generated due to low quality of coal. 33
  • 34.
    CSE Study, WestBengal Sponge Iron Industry Clusters November 2011 1. WBPCB fails to control pollution. Irregular monitoring. No enforcement. 2. Factories are repeat and habitual offenders. 3. 92% of inspection reports show abnormally high emissions from the kilns. 4. 52% fail to meet emission standards. 5. Solid waste management is pathetic. 6. Open storage of raw materials a major issue. 7. Sponge Iron units do not use the pollution control equipment. Source: WBPCB,2011. 34
  • 35.
    West Midnapore, CSEReport • People’s movement very strong against the sponge iron industry especially Rashmi Cement/ Ispat in 2009, in West Midnapore. • Maoist politics emerged solely due to pollution from sponge iron plants in West Midnapore. • Pollution Control Board found gross violation on water, air and solid waste disposal. • Nagarik Mancha led campaign against Rashmi Ispat. 35
  • 36.
    Jamuria, Burdwan • Poorwater quality. • Cattle has stopped grazing. • Fish inedible. • Units release pollutants at night from the ABC cap to avoid inspection. • Due to water shortage in Jamuria, water is not used as dust suppressant. 36
  • 37.
    West Bengal PollutionControl Board • Romita Dutta in Live mint reports that WBPCB has issued closure notice to 50-60 units out of the 250 units in West Bengal. • More than 40% of the units in West Bengal violate the environment. • WBPCB claims that night inspection in West Midnapore was stalled because of Maoists. • According to WBPCB, air pollution has been the main problem. 37
  • 38.
    CSE Recommendations • Kilnswith capacity less than 300 tpd should be phased out. • Only integrated plants should be allowed in the future. • Mandatory standards for material handling, storage and transportation must be enacted. • New cluster based standards should be imposed. • Stricter enforcement. 38
  • 39.
    Pollution Control Mechanisms(CSE & CPCB Recommendations) 1. Concrete floor in the work area as well as in the material handling area. 2. Use of covered trucks and enclosed hoppers to transport dust and ash. 3. To put a WHRB after the ABC so that the GCC is avoided. 4. Use of ESP instead of the DSC attached to ABC and GCC. 5. Use of magnetic separator at the discharge end. 6. Use of suction hood, bag filter and ESP to cooler discharge. 7. Use of raw material i.e. coal preheating to reduce energy consumption and char. 8. Use of pellets. 39
  • 40.
    Our recommendations forwaste Utilization in DRI • Char is used as fuel in thermal power plants, industries and domestic purposes. Coal fines can be mixed with char fines for fuel. • Dust and fly ash can be made into bricks. • Kiln accretions and slag can be used as landfills and road making. • Product circuit dust can be used as activated carbon in edible oil refineries. • Dolchar and char can be used in cement making. • Waste Heat is recovered in captive power plants. • Waste water recycled as make-up water. 40
  • 41.
    Our Recommendations (Technical) 1. We can set up air quality monitoring stations to track certain specified air pollutants and toxins. Delhi for example has set up several real time air quality monitoring stations. The system uses Lidar (light detection and ranging) technology, which releases and captures a laser beam and measures the before- after difference to gauge the concentrations of various pollutants in the air. 2. Construction of screen grit chambers to trap the sludge from the effluent through the introduction of de-salting tables to minimize the quantity of salt in the effluent. 3. Use of Sonic Horns, a pneumatically actuated device which produces high pressure acoustic energy or sound waves that are capable of fluidizing powder that adheres to surfaces in the bag filter. This low frequency vibration provides an effective means of cleaning the filter. The FES sonic horn helps in the removal of powder from walls, ceilings, curtain, and filter bags in the dust collector. ( http://www.fesintl.com/htmfil.fld/sonichrn.htm ) 4. Use of Heat pipe Exchangers instead of WHRB, which can transfer up to 100 times more thermal energy than copper, the best known conductor. Heat pipe is a thermal energy absorbing and transferring system and have no moving parts and hence require minimum maintenance. 41
  • 42.
    New Gadgets Heat PipeExchanger (HPHE) Sonic Horn 42
  • 43.
    Our Recommendations (Legal) •reduction of green house gas by implementation of clean development mechanism (listed by UNDP/GEF) is found to be depend upon the sincerity and integrity of the plant owner. • Granting land on lease basis with ultimate owner as the community. • Granting license on term basis to the plant owners. 43
  • 44.
    Our recommendations (Institutional) 1.Sponge iron industries may come under a cooperative organization for management of waste. 2. Assured quality of raw materials must be provided. Raw material quality must be declared. 3. Pooled resources to set up common facilities towards pelletization, or ore beneficiation, transportation and others. 4. Electronic alarms in the Air monitoring systems (that use LIDAR technology) might be set up on facilities connected to a central computer which shuts operations whenever limits of emission are crossed. This has been CPCB’s recommendation for a long time. 44
  • 45.