Downloaded 1,215 times
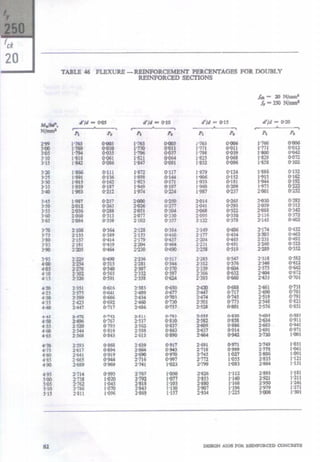
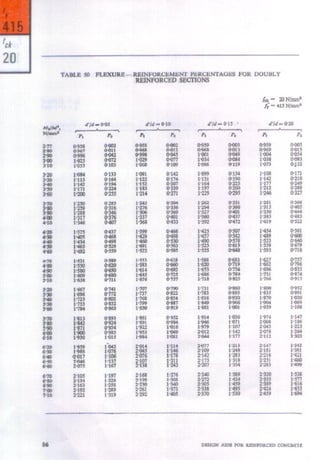
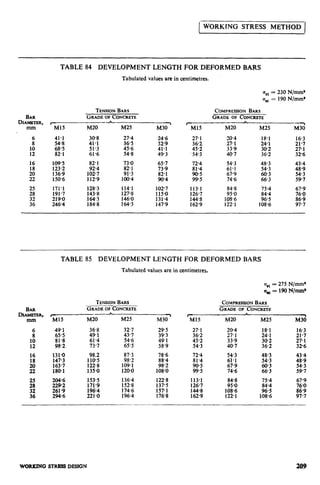
![Taking the above values into consideration,
most of the charts and tables have been
prepared for three grades of steel having
characteristic strength& equal to 250 N/mm*,
415 N/mm2 and 500 N/mm2.
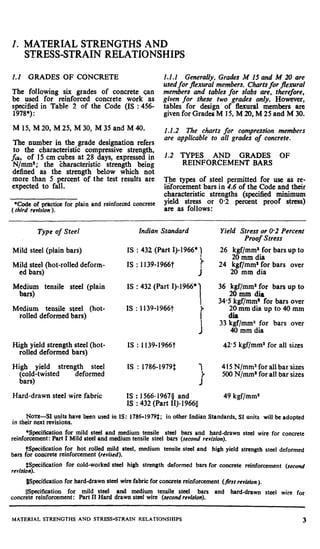
1.2.1 If the steel being used in a design has
a strength which is slightly diflerent from the
above values, the chart or table for the nearest
value may be used and the area ofreinforce-
ment thus obtained be modi$ed in proportion
to the ratio of the strengths.
1.2.2 Five values of fY (includinglthe value
for hard-drawn steel wire fabric) have been
included in the tables for singly reinforced
sections.
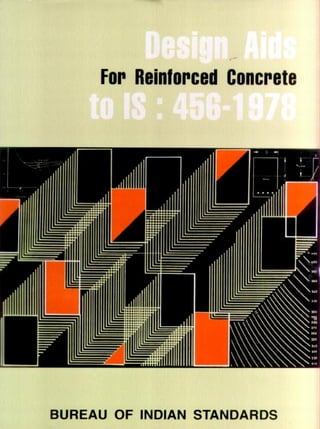
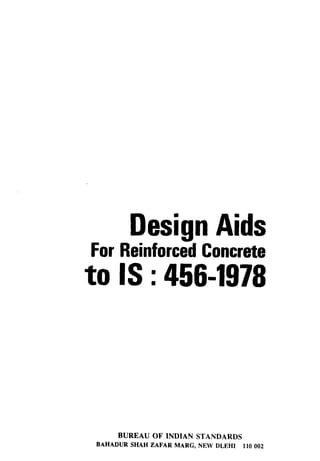
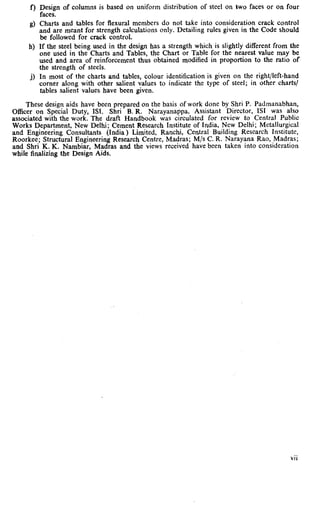
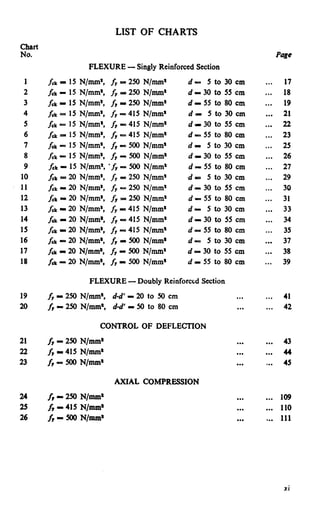
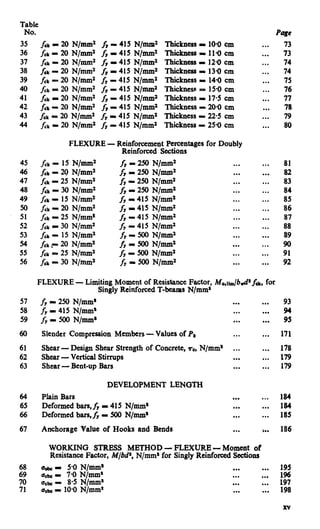
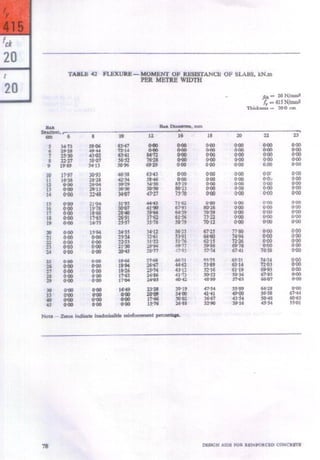
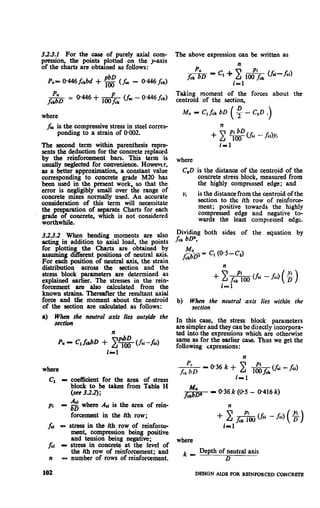
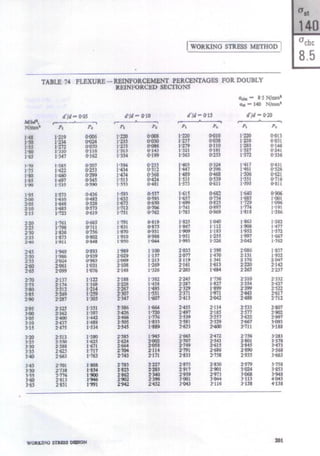
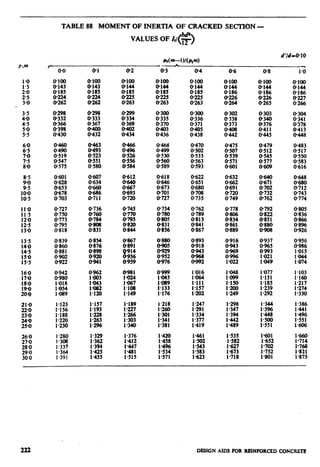
1.3 STRESS-STRAIN RELATIONSHIP
FOR CONCRETE
The Code permits the use of any appro-
priate curve for the relationship between the
compressive stress and strain distribution
in concrete, subject to the condition that it
results in the prediction of strength in subs-
tantial agreement with test results [37.2(c)
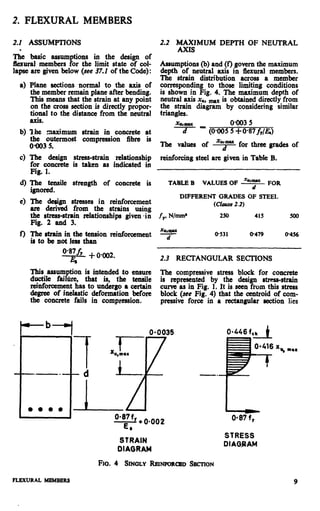
of the Code]. An acceptable stress-strain
curve (see Fig. 1) given in Fig. 20 of the Code
will form the basis for the design aids in this
publication. The compressive strength of con-
crete in the structure is assumed to be O-67fd.
With a value of l-5 for the partial safety
factor ym for material strength (35.4.2.1 of
the Code), the maximum compressive stress
in concrete for design purpose is 0.446 fck
(see Fig. I).
1.4 STRESS-STRAIN RELATIONSHIP
FOR STEEL
The modulus of elasticity of steel, E,, is
taken as 200 000 N/mm2 (4.6.2 of the Code).
This value is applicable to all types of
reinforcing steels.
The design yield stress (or 0.2 percent proof
stress) of steel is equal to fr/ym. With a value
of l-15 for ym (3.5.4.2.2 of the Code), the
design yield stress fv
stress-strain relations tp for steel in tension1.
becomes 0#87f,. The
and compression is assumed to be the same.
For mild steel, the stress is proportional
to strain up to yield point and thereafter the
strain increases at constant stress (see Fig. 2).
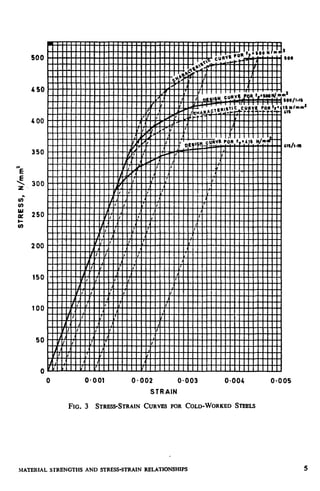
For cold-worked bars, the stress-strain
relationship given in Fig. 22 of the Code will
I/ /
.I
I a.002 0’001
STRAIN
FIG. 1 DESIGN STRKSS-STRAINCURVE FOR
CONCRETE
. 200000 N/mm’
? --
STRAIN
FIG.2 STRESS-STRAINCURVE FORMILD STEEL
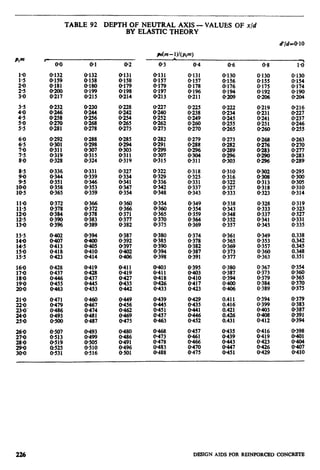
be adopted. According to this, the stress
is proportional to strain up to a stress of
0.8 fY. Thereafter, the stress-strain curve is
defined as given below:
Stress hu#aslic~srrain
O*SOfy Nil
0.85 fr OQOOl
0*9ofy 0.0% 3
0*9sf, o*ooo 7
0.975 fy 0~0010
l-O& 0.002 0
The stress-strain curve for design purposes is
obtained by substituting fYe for fY in the
above. For two grades of cold-worked bars
with 0.2 percent proof stress values of
415 N/mms and 500 N/mm2 respectively,
the values of total strains and design stresses
corresponding to the points defined above
are given in Table A (see page 6). The stress-
strain curves for these two grades of cold-
worked bars have been plotted in Fig. 3.
4 DESIGN AIDS FOR REINFORCED CONCRETE](https://image.slidesharecdn.com/sp16latest-130507020240-phpapp01/85/Sp16-latest-24-320.jpg)
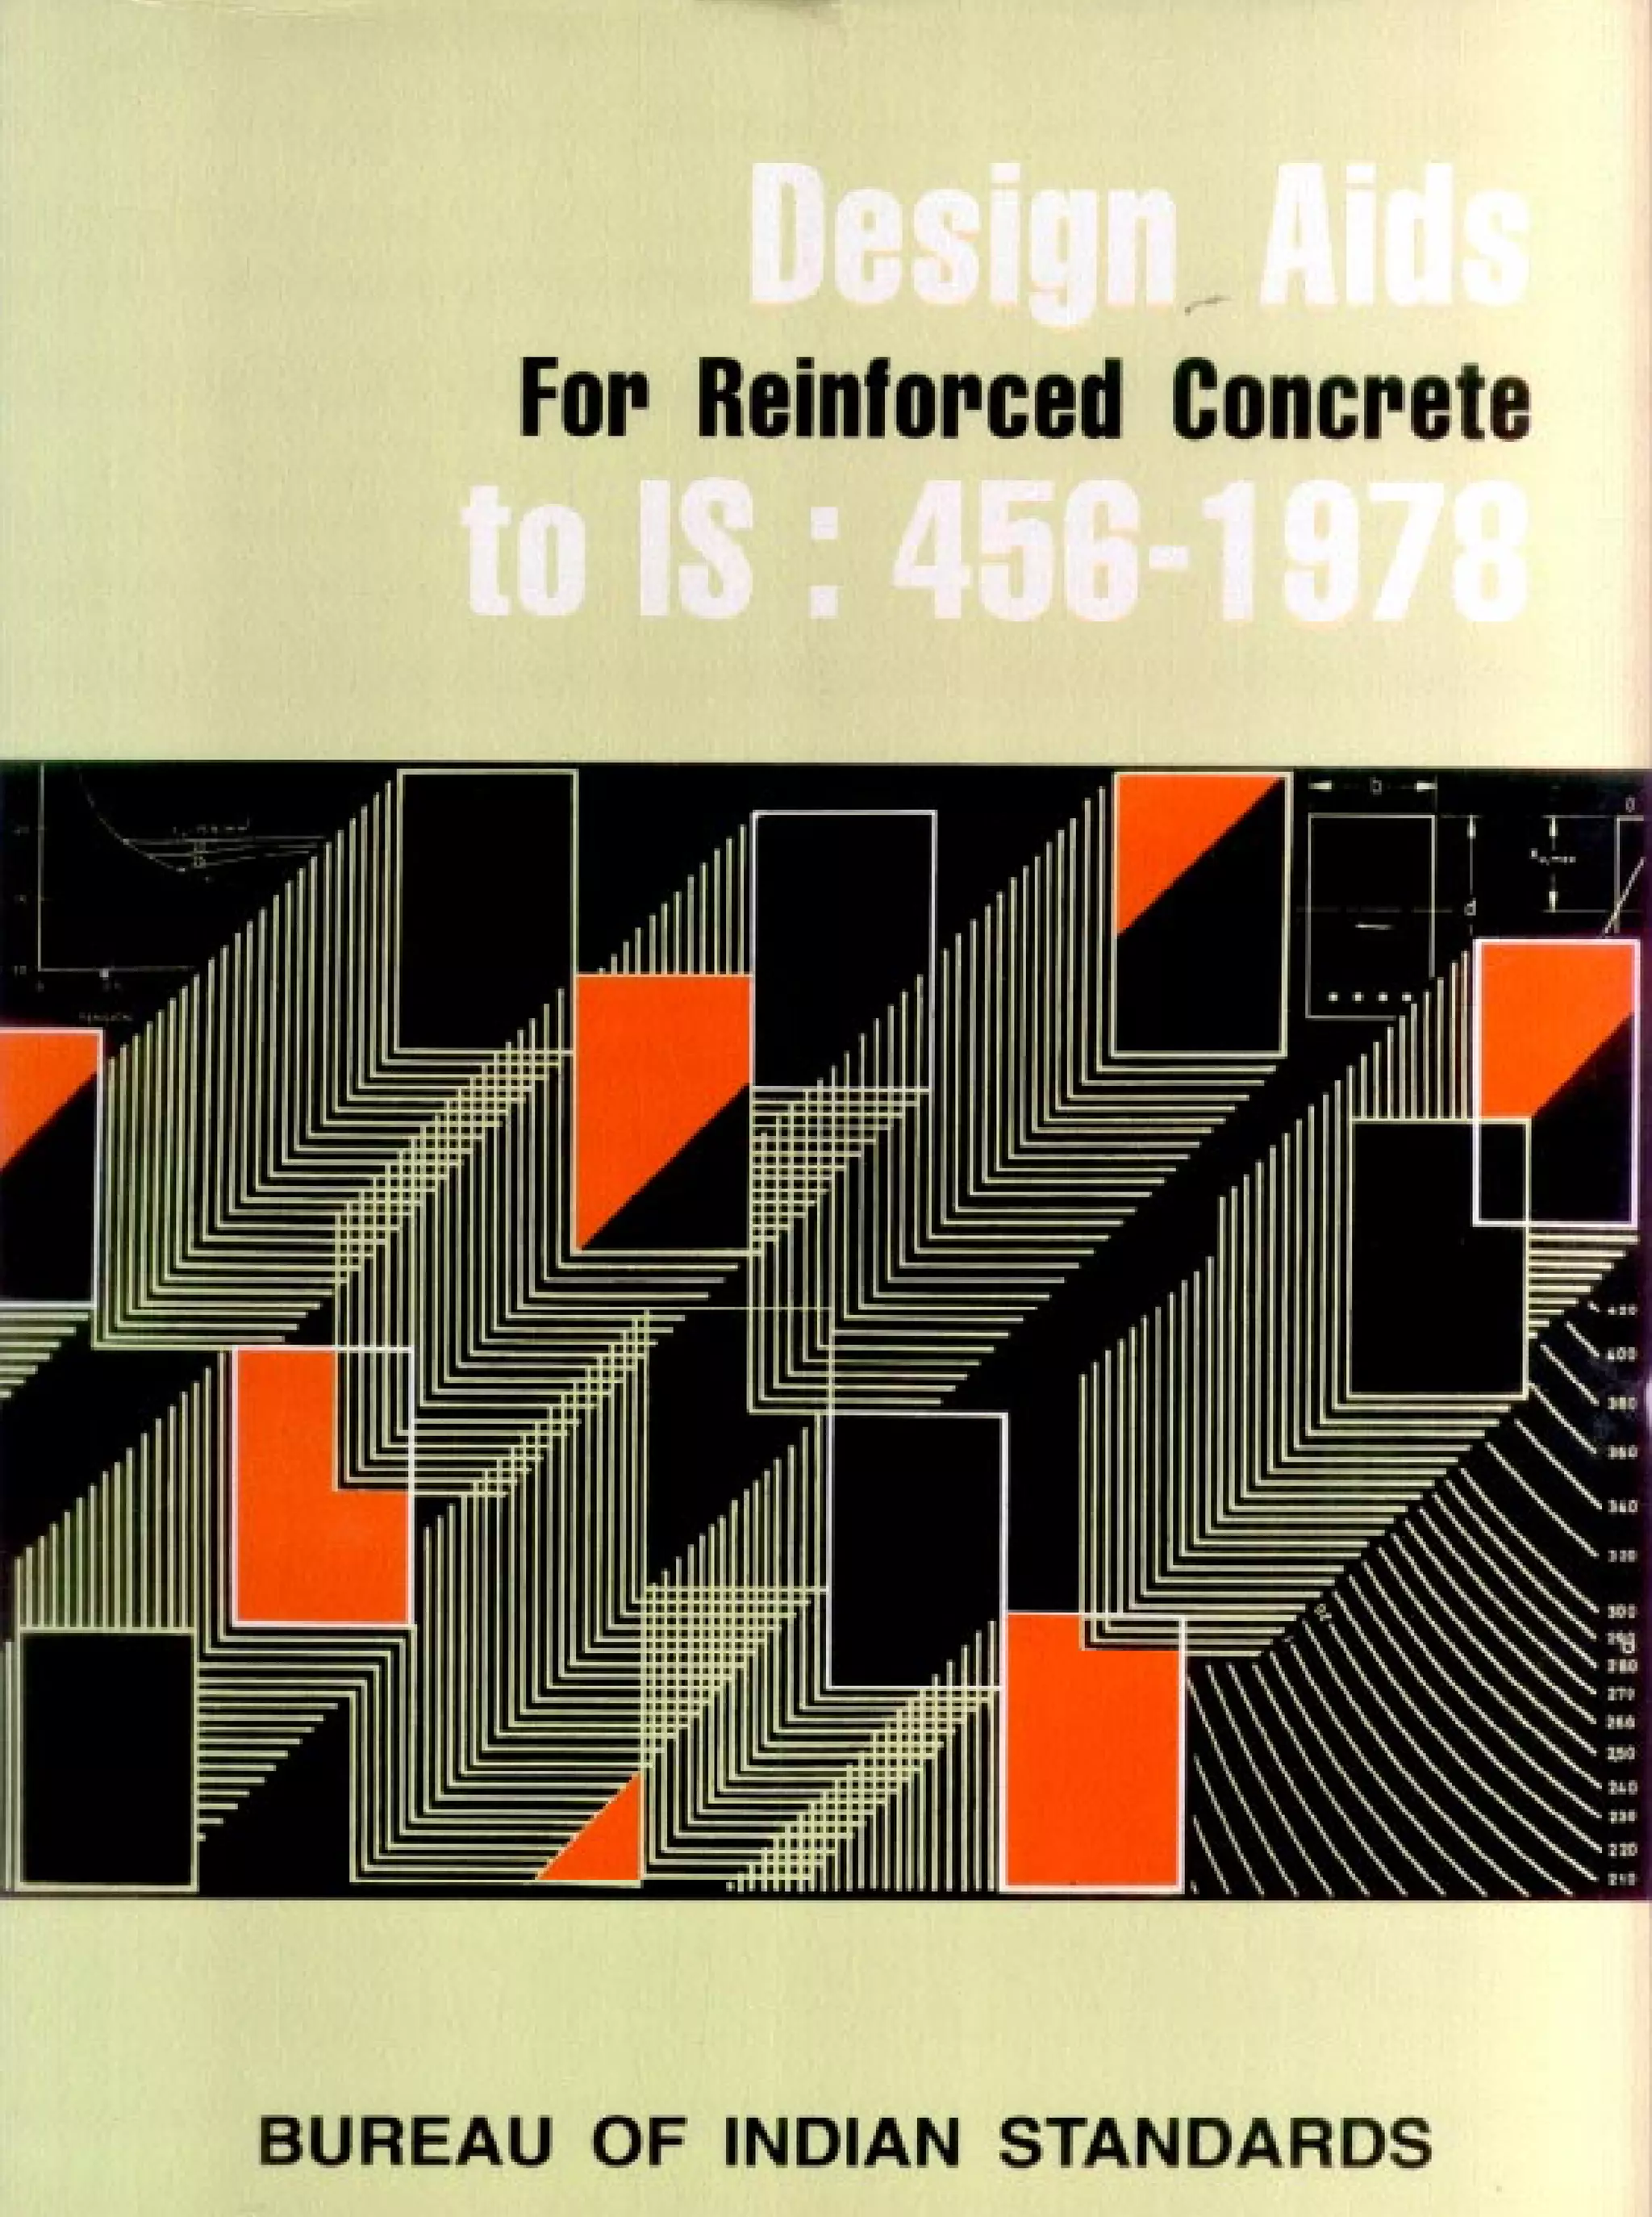
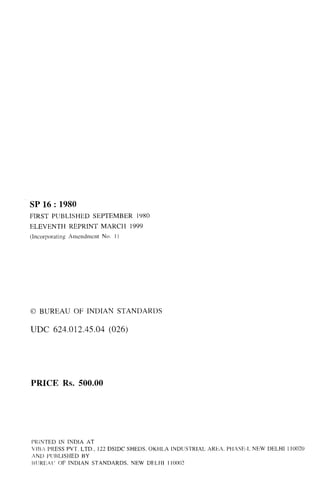
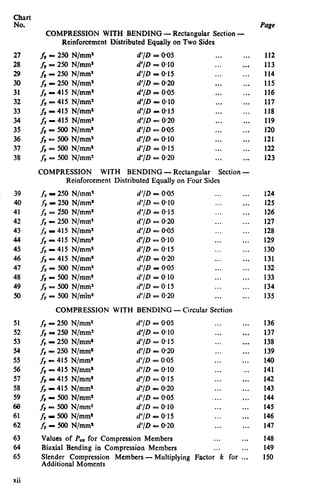
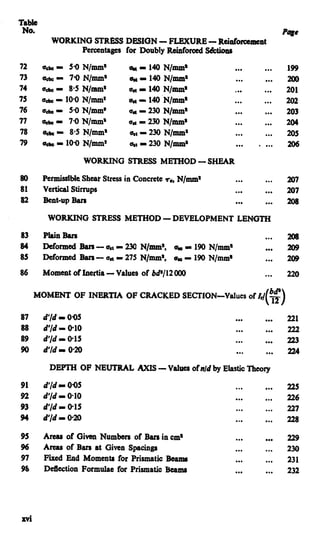
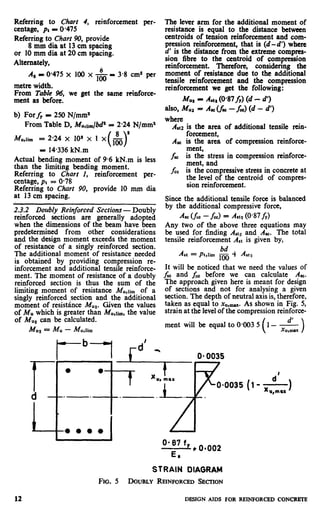
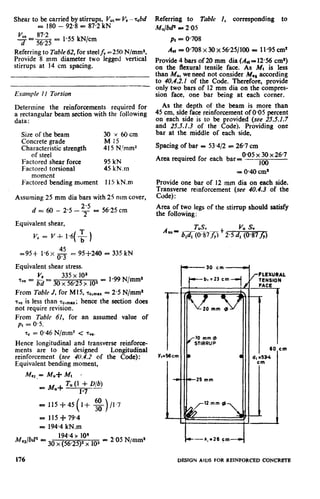
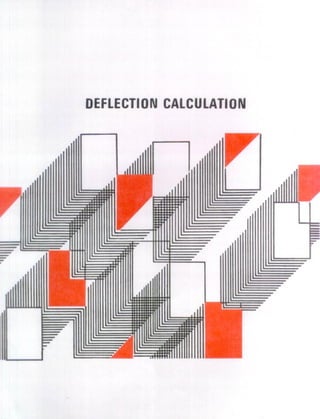
![at a distance or U-416 xu (wnlcn nas oecn
rounded off to 0.42 xu in the code) from the
extreme compression fibre; and the total force
of compression is 0.36 fck bxu. The lever arm,
that is, the distance between the centroid
of compressive force and centroid of tensile
force is equal to (d - 0.416 x,). Hence the
upper limit for the moment of resistance of a
singly reinforced rectangular section is given
by the following equation:
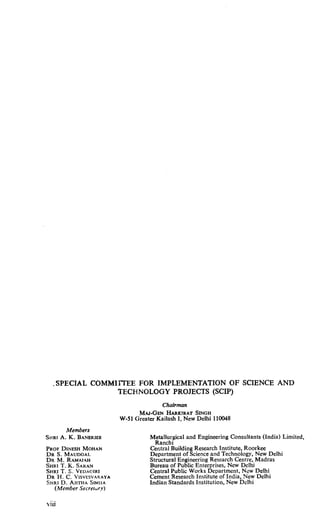
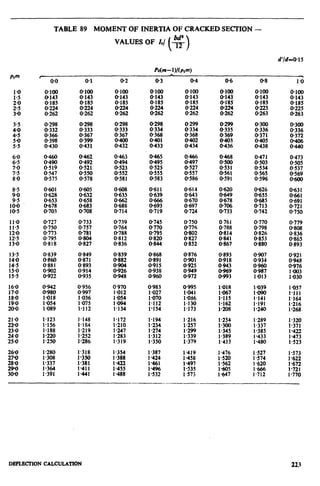
Mu,lim = O-36& bxu,,,
x(d - 0.416 ~u,mu)
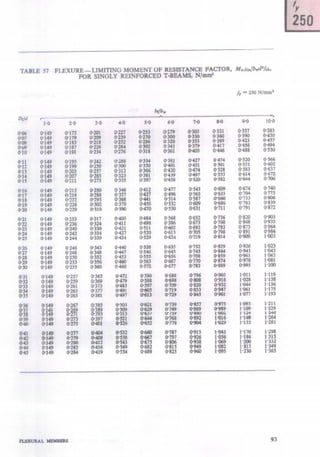
Substituting for xu,- from Table B and
transposing fdr bd2, we get the values of
tie limiting moment of resistance factors for
singly reinforced rectangular beams and
slabs. These values are given in Table C.
The tensile reinforcement percentage, pt,lim
corresponding to the limiting moment of
resistance is obtained by equating the forces
of tension and compression.
Substituting for xu,mPxfrom Table B, we get
the values of Pt,lim fYj& as given in Table C.
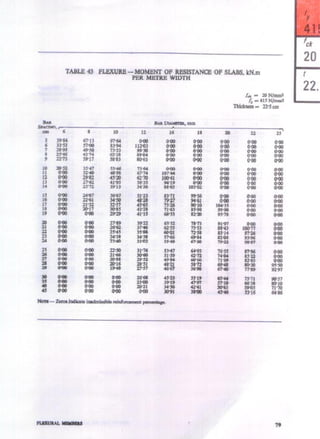
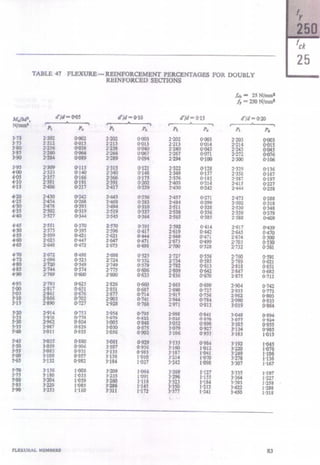
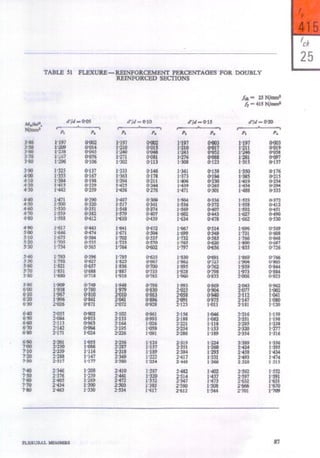
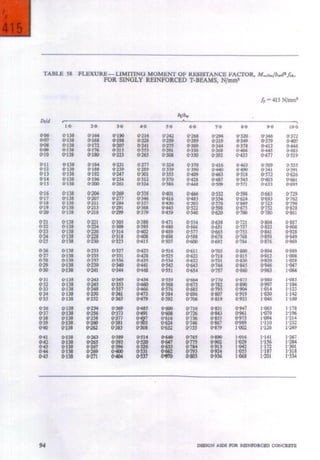
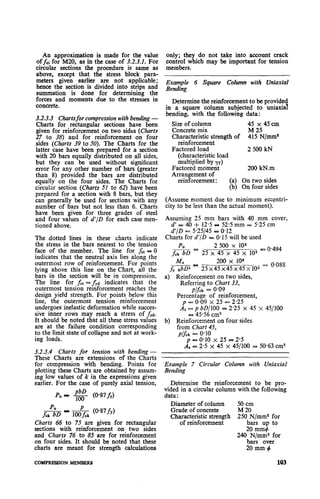
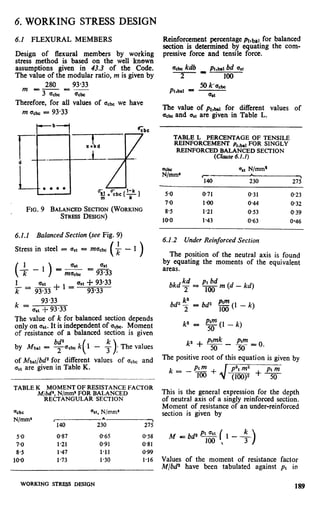
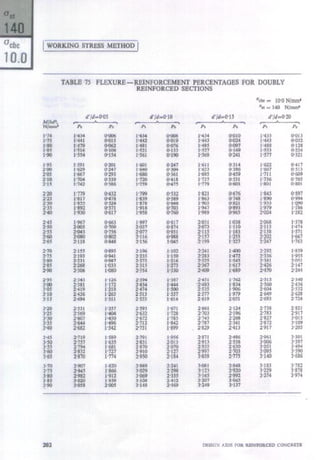
TABLE C LIMITING MOMENT OF
RESISTANCE AND REINFORCEMENT INDEX
FOR SINGLY REl;~&FOR~N~ RECTANGULAR
(Clause 2.3)
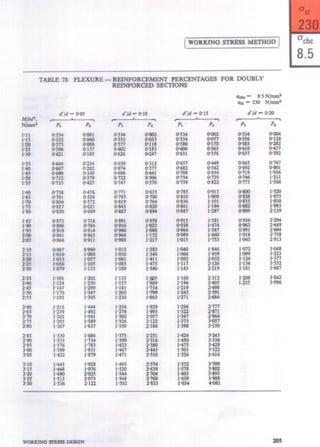
j& N/mm* 250 415 500
M*,lhl-- -
Lk bd’
0.149 W138 0.133
Plrllrnfy
/ ck
21.97 19.82 18.87
The values of the limiting moment of resis-
tance factor Mu/bd2 for different grades of
concrete and steel are given in Table D. The
corresponding percentages of reinforcements
are given in Table E. These are the maximum
permissible percentages for singly reinforced
sections.
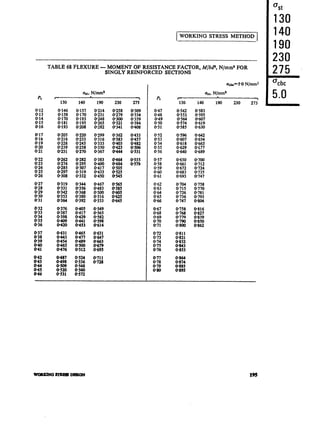
TABLE D LIMITING MOMENT OF
RESISTANCE FAVOR Mu,,im/bd’, N/mm’ FOR
SINGLY REINFC);&yE$sECTANGULAR
(Clause 2.3)
/CL,
N/mm’
fy, N/-Y
rK------ 500
15 2.24
Is:3.45
2.00
3: 2.983.73 2.663.33
30 4.47 414 3.99
TABLE E MAXIMUM PERCENTAGE OF
TENSILE REINFORCEMENT pt,lim FOR
SINGLY REINFStRmTNSRE!aANGW
(c%u.w 2.3)
fdr, /y, Nhm’
N/mm* r b
250 415 u)o
15 1.32
4
1.76
220
;g “0%
2% l.43 YE.
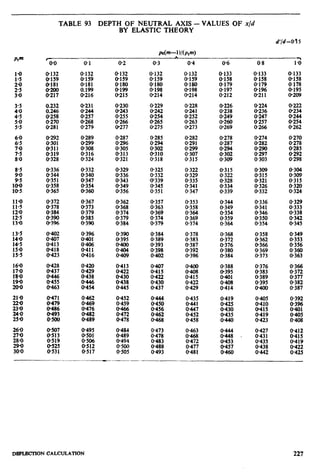
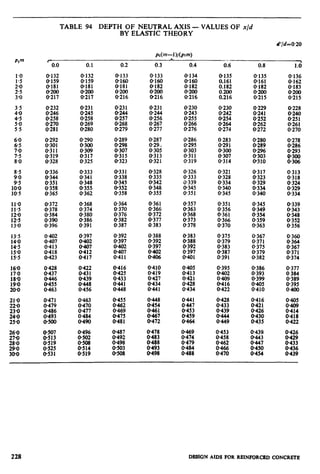
2.3.1 Under-ReinforcedSection
Under-reinforced section means a singly
reitiorced section with reinforcement per-
centage not exceeding the appropriate value
given in Table E. For such sections, the
depth of neutral axis xu will be smaller than
x”,,,,~. The strain in steel at the limit state
of collapse will, therefore, be more than
0.87 fy
- + 0902 and, the design stress in
E.
steel will be 0937fy. The depth of neutral
axis is obtained by equating the forces of
tension and compression.
‘G (0.87 fr) - 0.36 fdrb xu
The moment of resistance of the section is
equal to the prdduct of the tensile force
and the lever arm.
Mu = pG (@87f,) (d - 0,416 xu)
=O*87fy &
( )(
l- 0.4165
)
bd2
Substituting foi $ we get
_ _
x 1
C
- 1.005 &$]bda
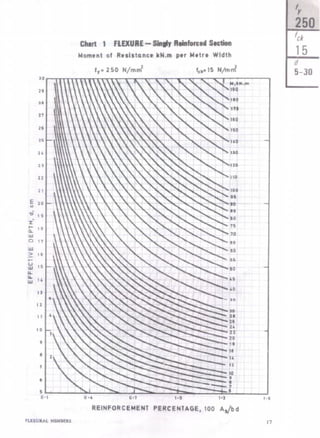
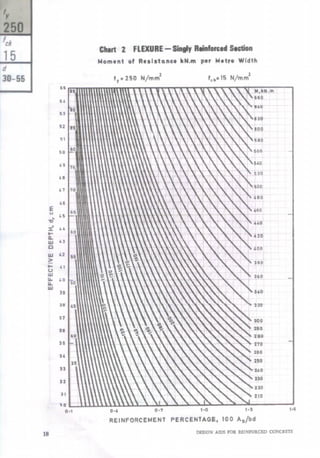
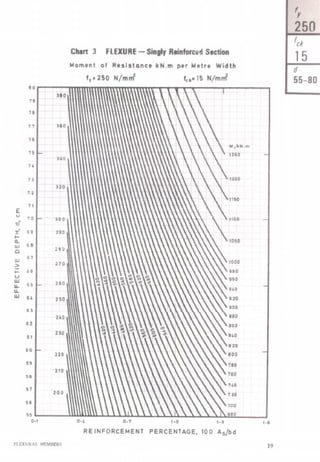
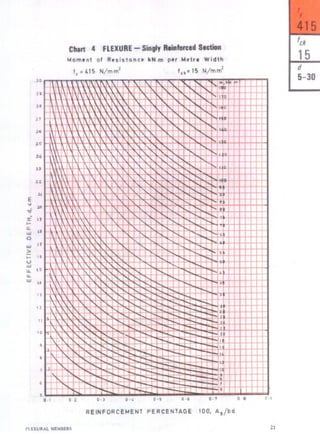
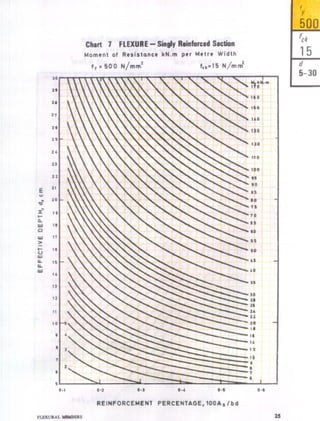
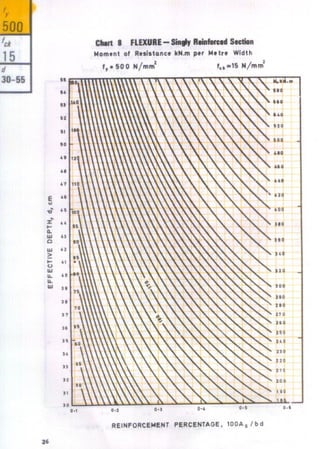
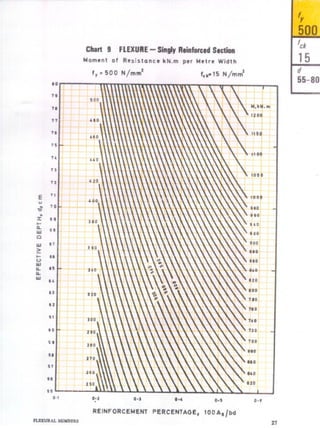
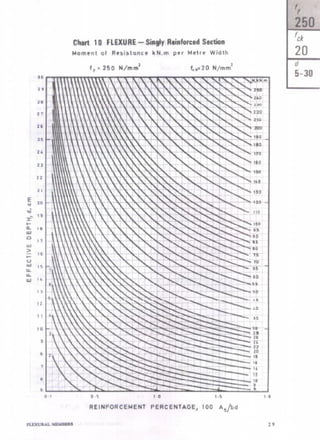
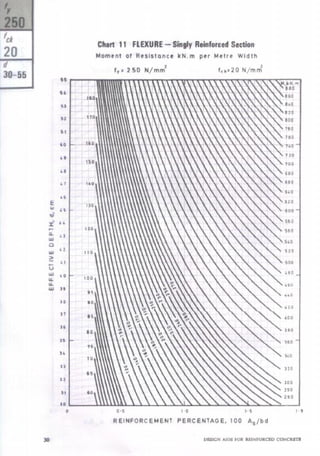
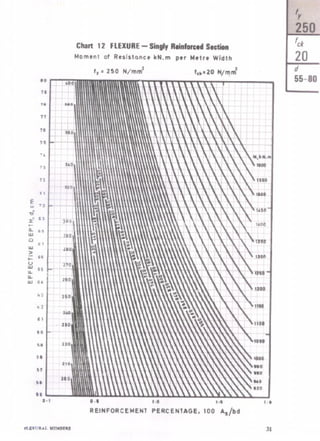
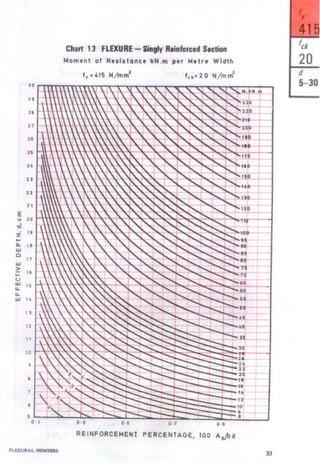
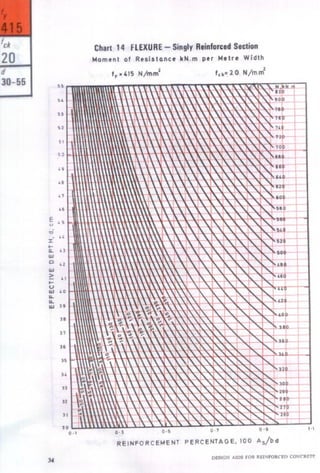
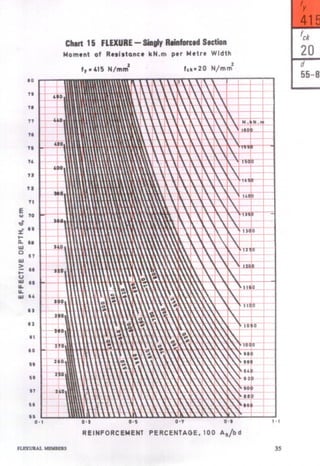
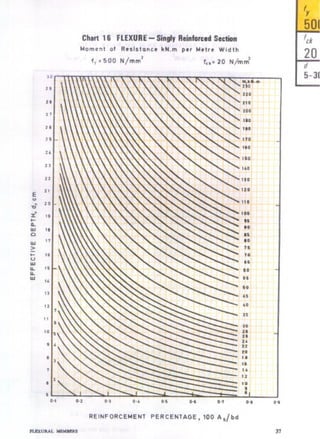
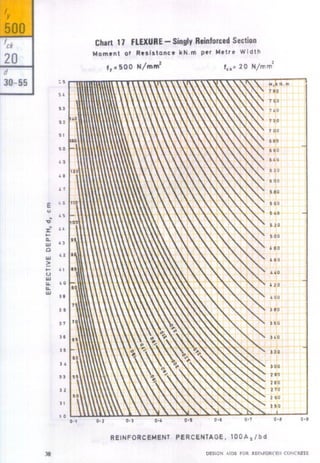
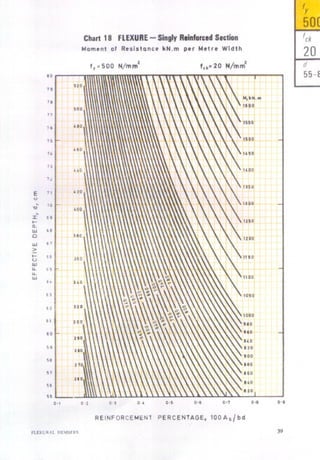
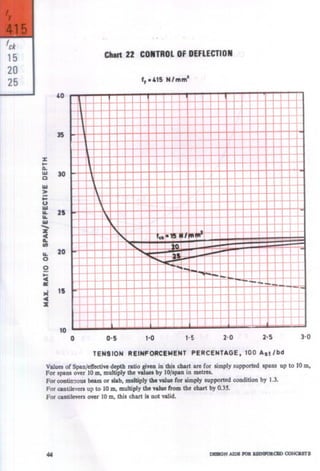
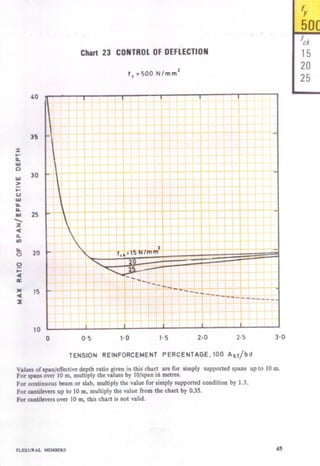
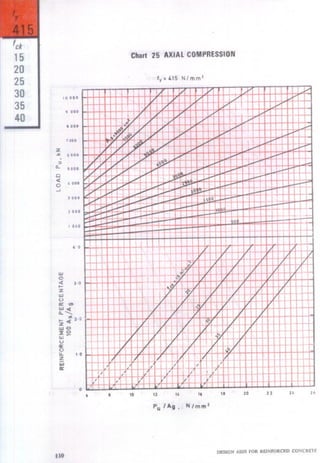
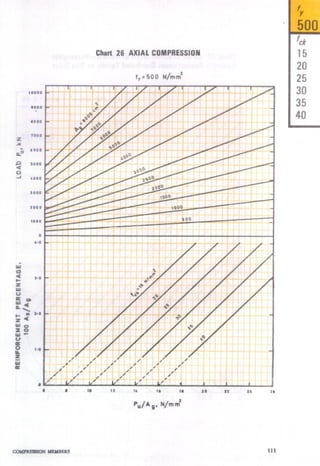
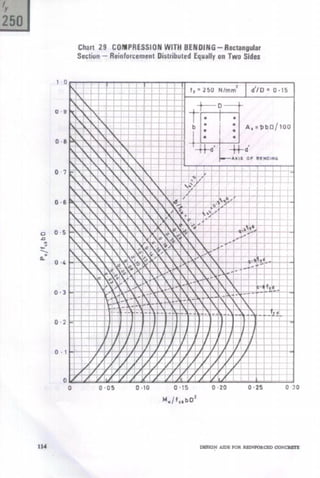
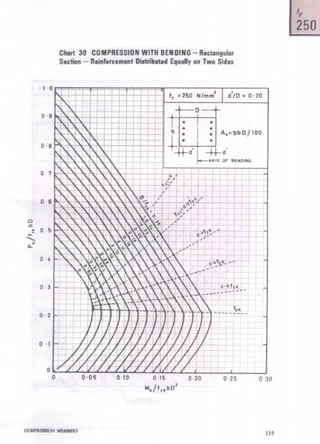
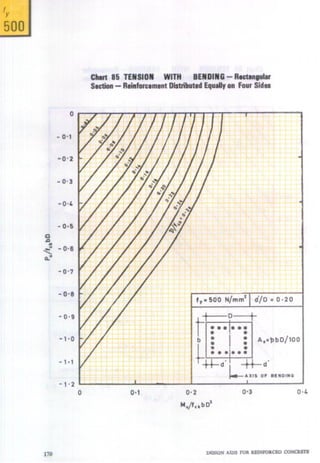
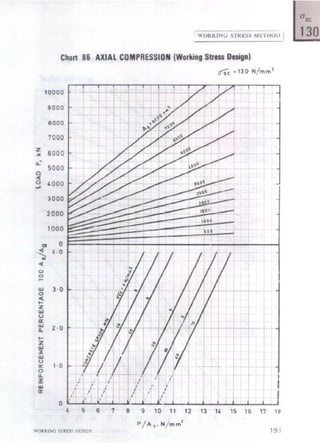
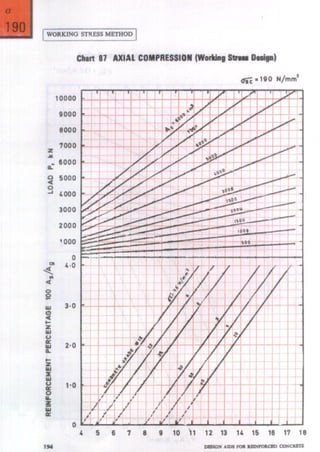
2.3.Z.Z Charts 1 to 28 have been prepared
by assigning different values to Mu/b and
plotting d versuspt. The moment values in
the charts are in units of kN.m per metr$
width. Charts are given for three grades of
steel and, two grades of concrete, namely
M 15 and M 20, which are most commonly
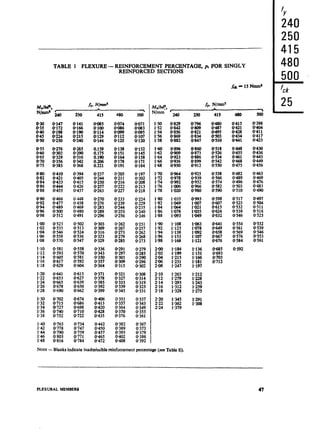
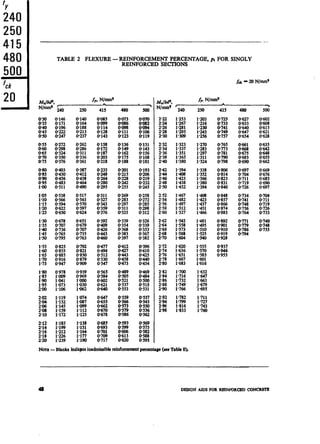
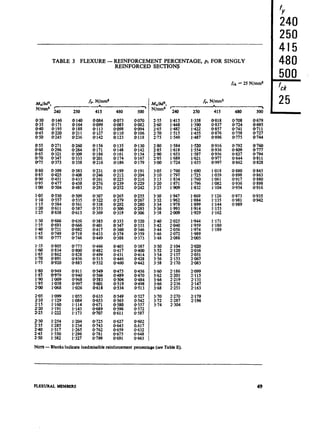
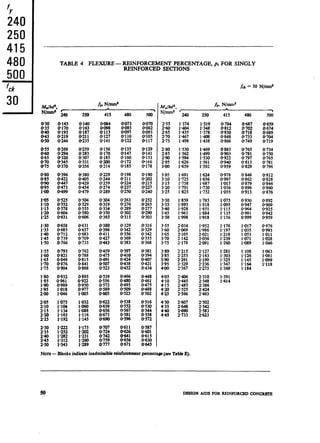
used for flexural members. Tables 1 to 4
cover a wider range, that ‘is, five values of
fy and four grades of concrete up to M 30.
In these tables, the values of percentage of
reinforcement pt have been tabulated against
Mu/bd2.
10 DESIGN AIDS FOR WNFORCED CONCRETE](https://image.slidesharecdn.com/sp16latest-130507020240-phpapp01/85/Sp16-latest-30-320.jpg)
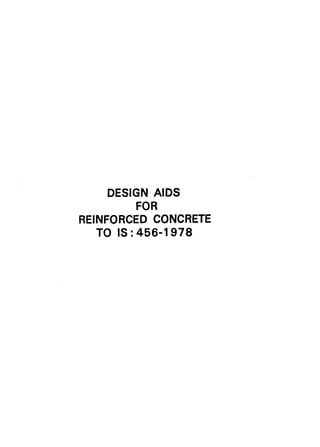
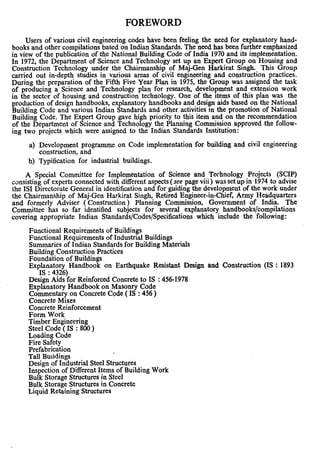
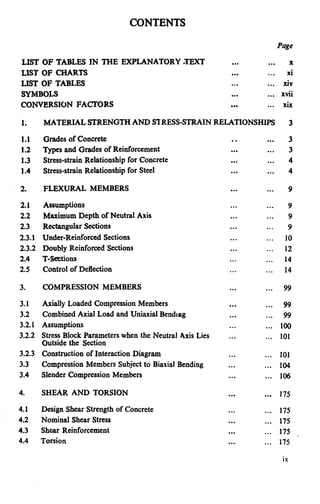
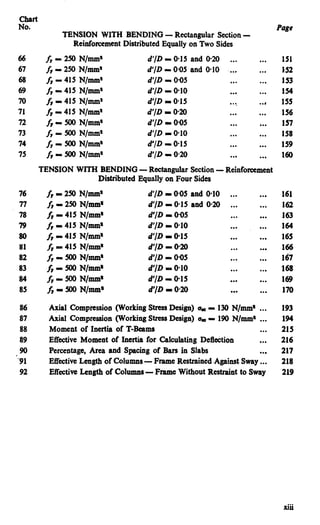
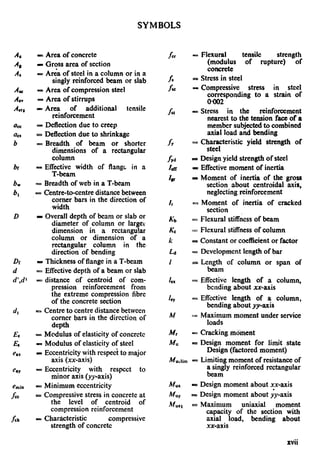
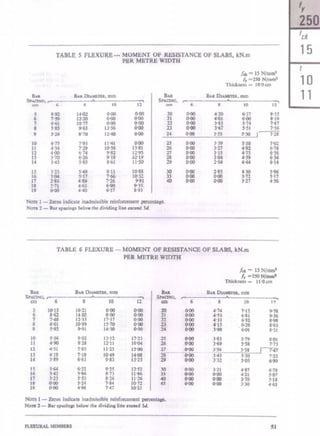
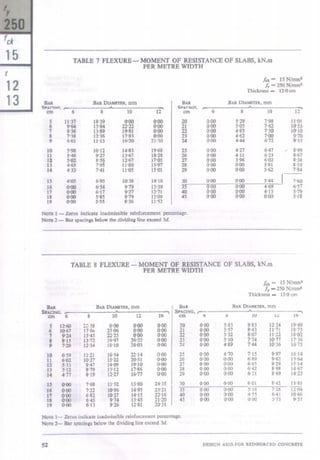
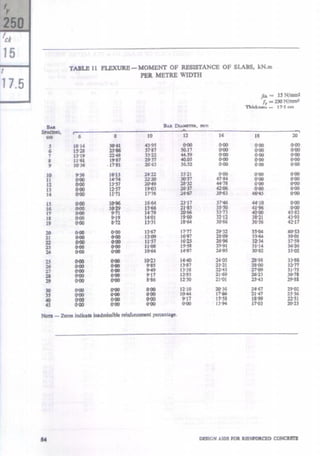
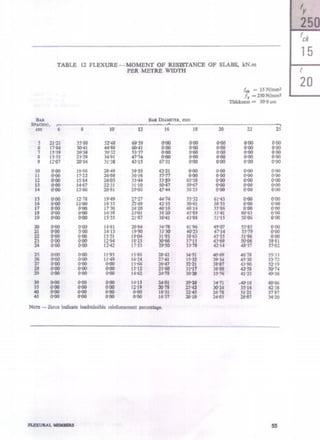
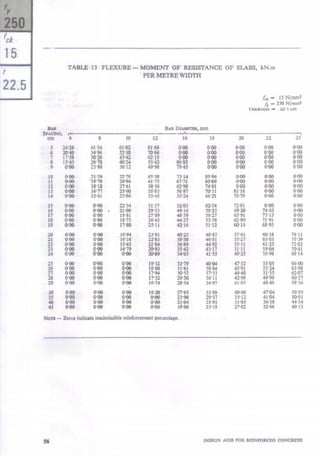
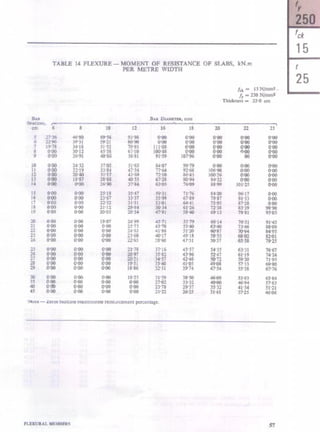
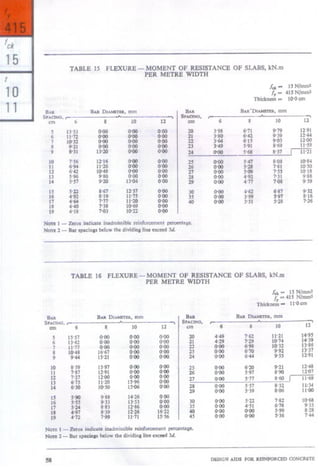
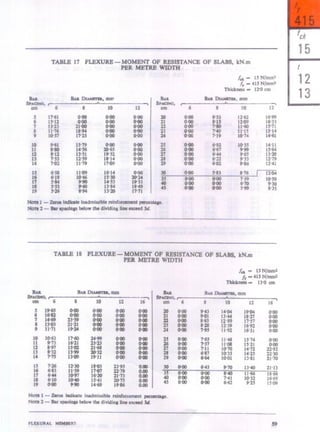
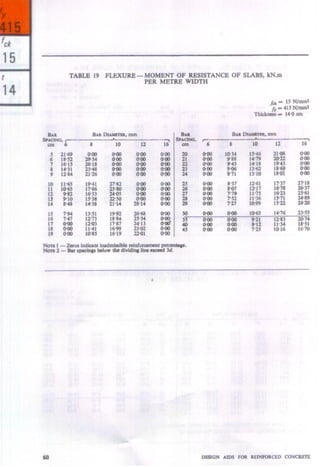
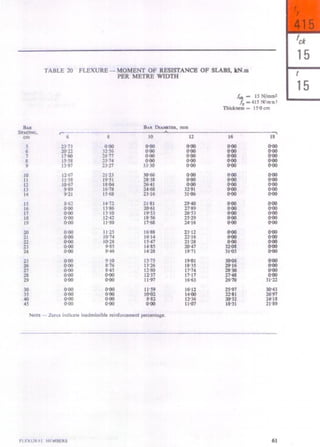
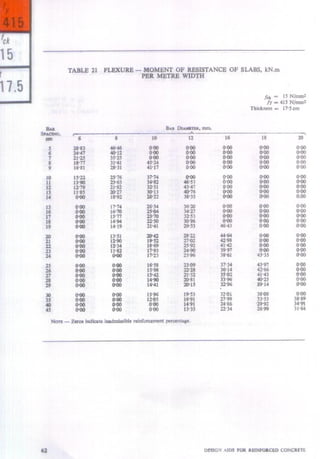
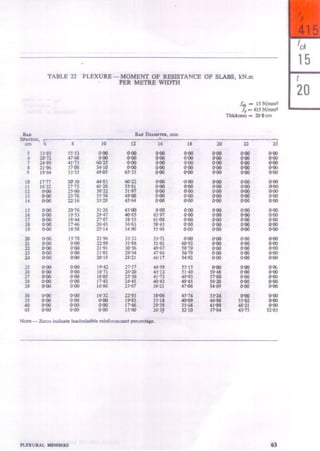
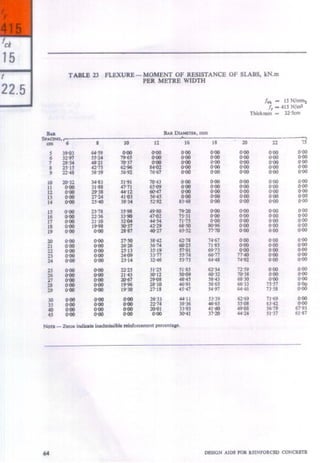
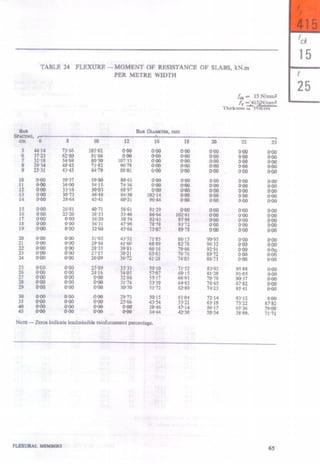
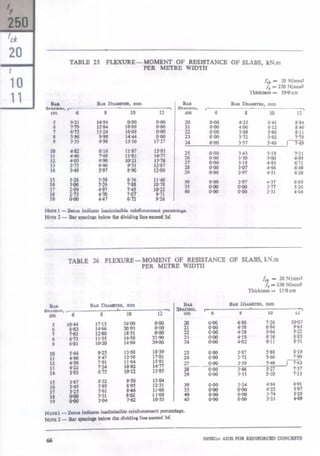
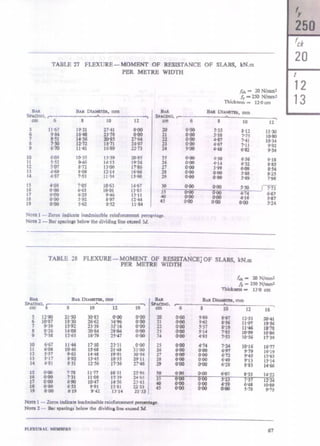
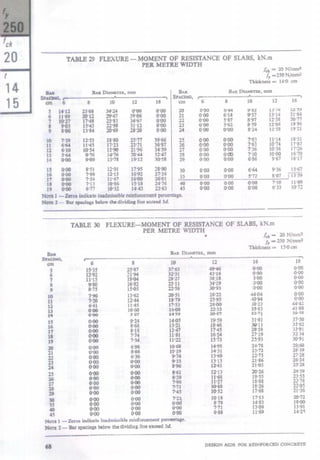
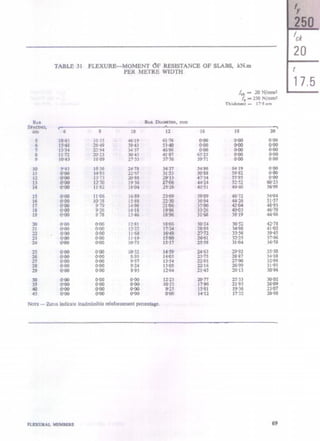
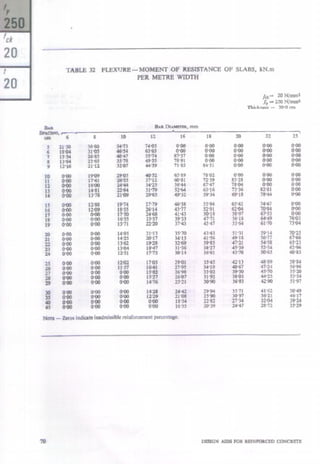
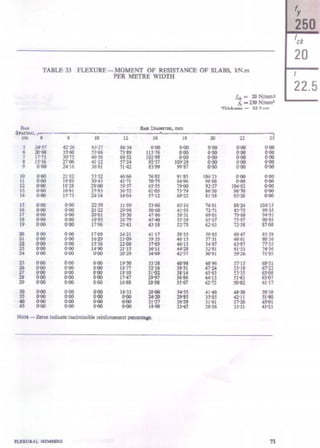
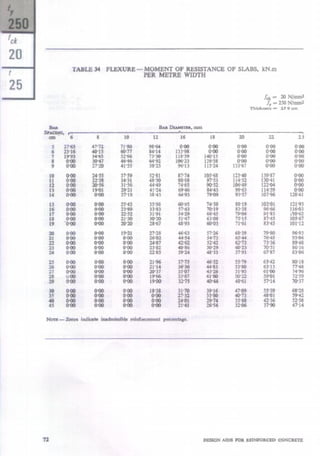
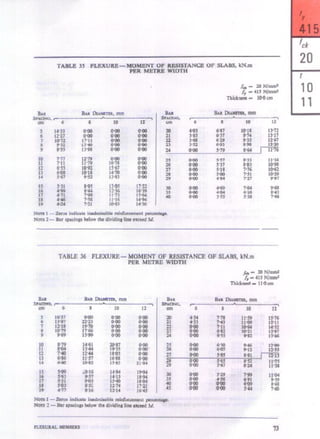
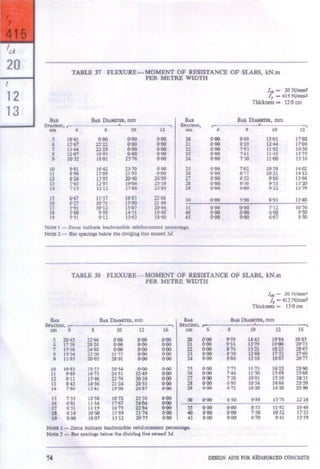
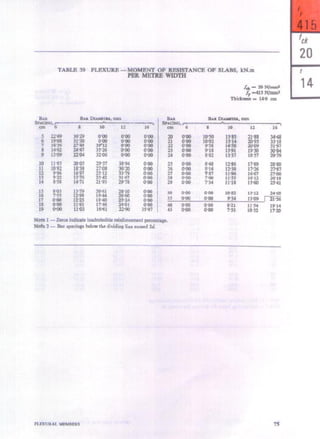
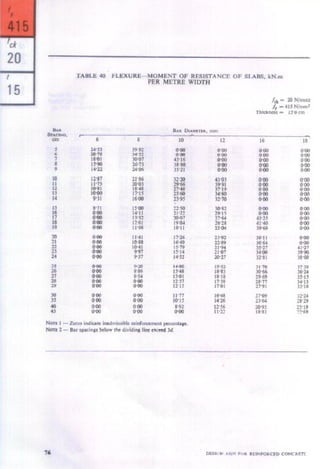
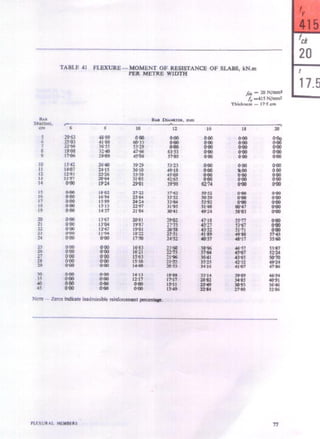
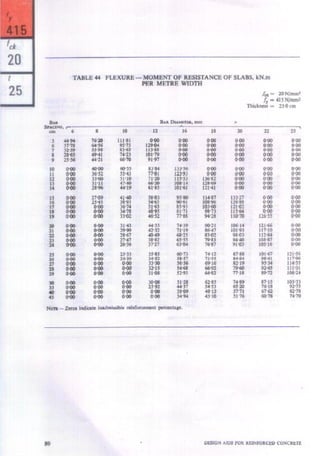
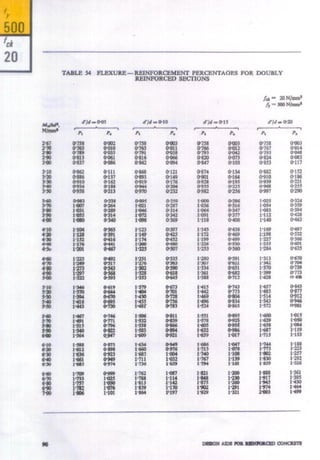
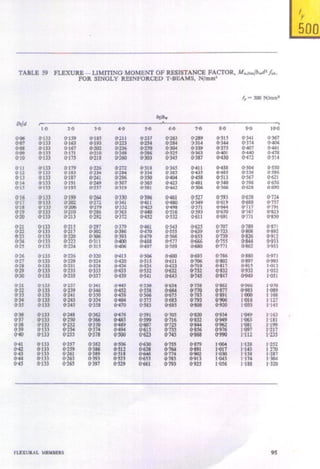
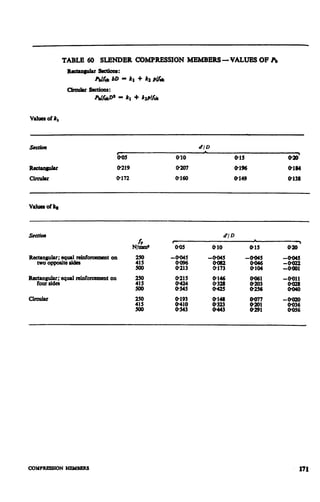
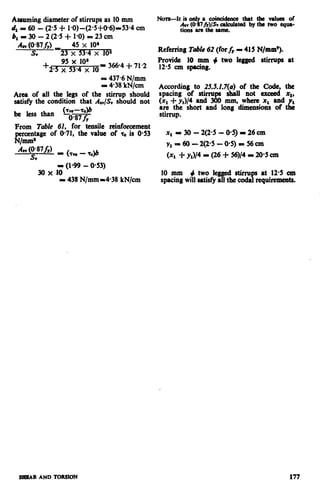
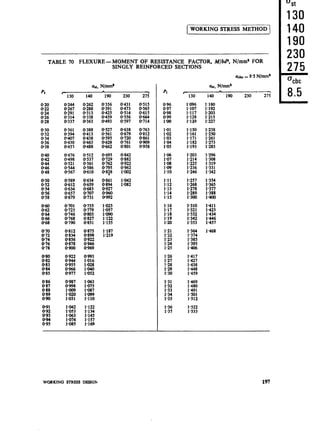
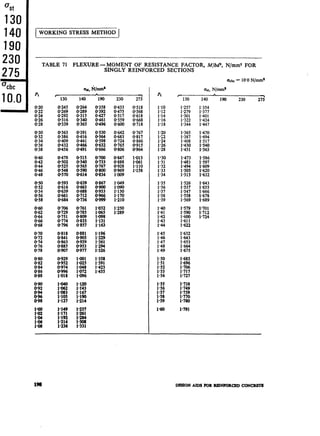
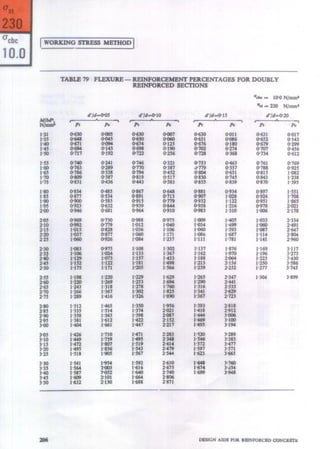
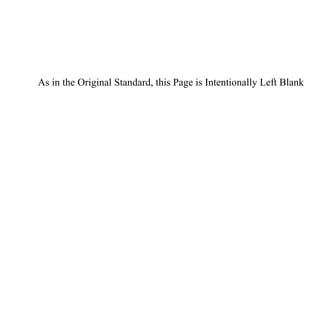
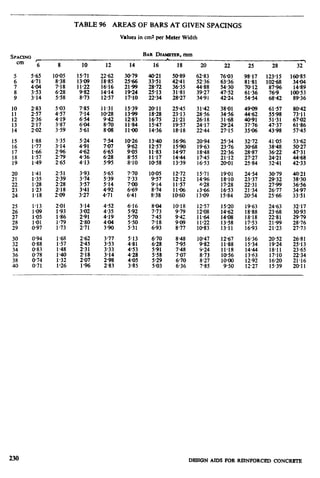
![2.3.2.2 The moment of resistance of slabs,
with bars of different diameters and spacings
are given in Tables 5 to 44. Tables are given
for concrete grades M 15 and M 20, with
two grades of steel. Ten different thicknesses
ranging from 10 cm to 25 cm, are included.
These tables take into account 25.5.2.2
of the Code, that is, the maximum bar
diameterdoesnot exceedone-eighth the thick-
ness of the slab. Clear cover for reinforce-
ment has been taken as 15 mm or the bar
diameter, whichever is greater [see 25.4.1(d)
of the Code]. Jn these tables, the zeros at
the top right hand comer indicate the region
where the reinforcement percentage would
exceed pt,lim; and the zeros at the lower
left hand comer indicate the region where
the reinforcement is less than the minimum
according to 25.5.2.1 of the Code.
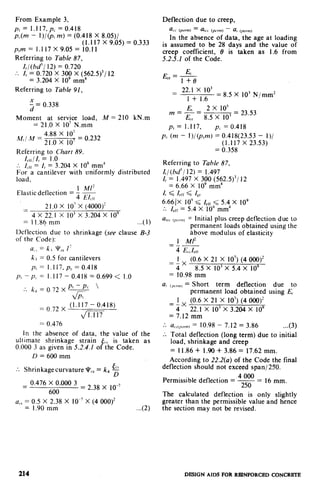
Example 1 Singly Reinforced Beam
Determine the main tension reinforcement
required for a rectangular beam section
with the following data:
Sixeof beam 3ox6Ocm
Concrete mix M 15
Characteristicstrength 415N/mm’
of reinforcement
*Factored moment 170kN.m
*Assuming 25 mm dia bars with 25 mm
clear cover,
Effectivedepth I 60 - 2.5 -2;- 5625 cm
From Table D, for fr P 415 N/mm’ and
fcrc- 15 N/mm*
MWliUJM’ p 2.07 N/mm:
v$g$ x (1000)’
e; 2.07 x 101kN/m*
:. &am - 2.07 x 1O’W
30
I 2-07 x 10’ x fa x
I 1965 kN.m
$%ua] moment. of. 170 kN.m is less *than
The sectton 1stherefore to bedestgned
asu’~mm’singlyreinforced (unde&einforced)
rectangular section.
fVfM’HODOF RBFQIRINGTOFU3XURECHART
For referring to Chart, we need the value of
moment per metre width.
Mu/b-g = 567kN.m per metrewidth.
*The term ‘factoredmoment’means the moment
due to characteristic loads multiplied by the appro-
priate value of p&rtialsafety factor yf.
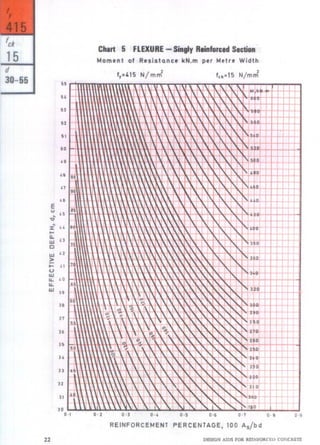
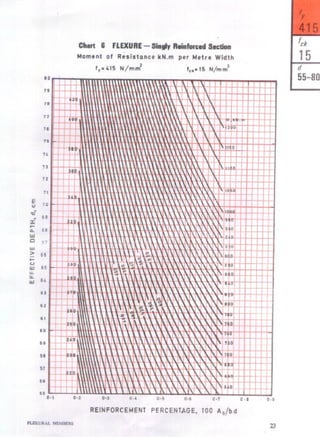
Retbrring to C/r& 6, corresponding to
h&,/b - 567kN.m and d = 5625 cm,
Percentageof steelpt - lOOAsM = 0.6
0.6 bd
. .* A,= -jijiy
0.6~30~5625 __O1 ,,*
100
For referring to Tables, we need the value
Mu
ofw
M” 170x IO’
bd’ - -3m6.25 x 56.25 x IO’
I 1.79 N/mm’
From Table 1,
Percentage of reinforcement,pt = 0.594
* As-. .
0.594 x 30 x 56.25 _ ,omo2,,*
100
Example 2 Slab
Determine the main reinforcement re-
quired for a slab with the following data:
Factored moment 9.60 kN.m
E%etre
Depth of slab 10 cm
Concrete mix M 15
Characteristic strength a) 415 N/mm2
of reinforcement b) 250 N/mm*
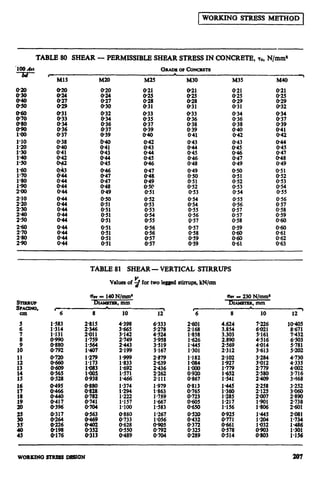
h&l-HODOFREPERRINGTOTABLESFOR SLABS
Referring to Table 15 (for fy - 415 N/mmz),
directly we get the following reinforcement
for a moment of resistance of 9.6 kN.m
per metre width:
8 mm dia at 13cm spacing
or 10mm dia at 20 cm spacing
Reinforcement given in the tables is based
on a cover of 15 mm or bar diameter which-
ever is greater.
MFXHOD OF RFNRRJNG TO FLBXURB CHART
Assume 10 mm dia bars with 15 mm cover,
d - 10- 1.5 - 9 =8cm
a) For fy= 415 N/mm’
From Table D, Mu,tidb# = 2.07 N/mm*
:. J%lirn - 2.07 x lOa x z x (A)’
= 13.25kN.m ’ _’
Actual bending moment of 960 kN.m is less
than the limiting bending moment.
FLExuRALmMBERs 11](https://image.slidesharecdn.com/sp16latest-130507020240-phpapp01/85/Sp16-latest-31-320.jpg)
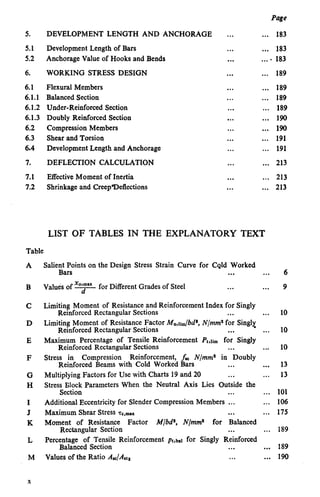
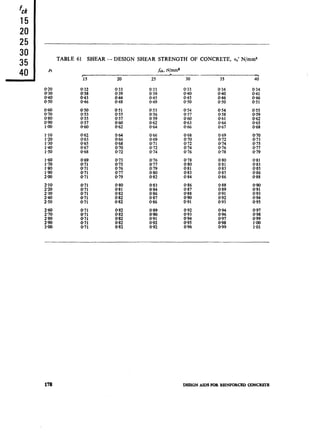
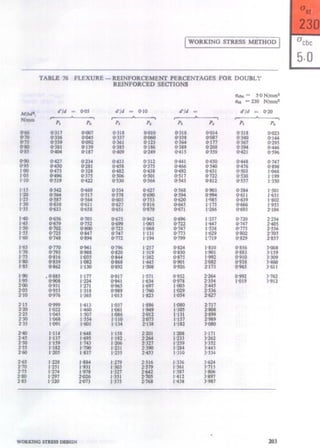
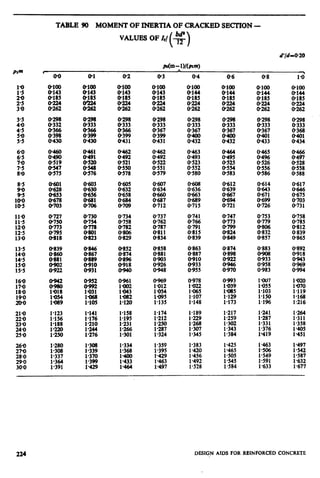
![For values of d’/d up to 0.2, feeisequal to
0446 fck; and for mild steel reinforcement
fz would be equal to the design yield stress
of 0.87 fY. When the reinforcement is cold-
worked bars, the design stress in compression
reinforcement fw for different values of
d’/d up to 0.2 will be as given in Table F.
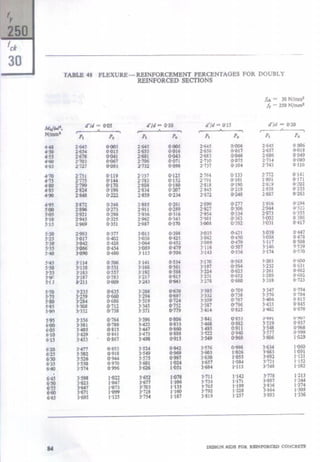
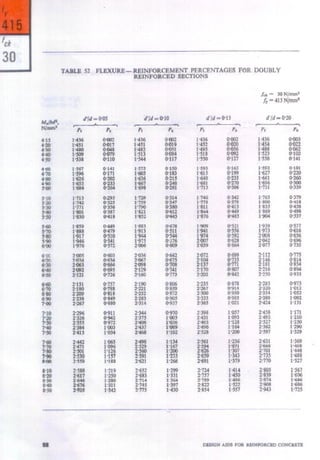
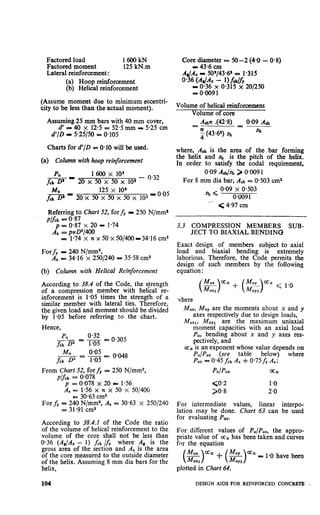
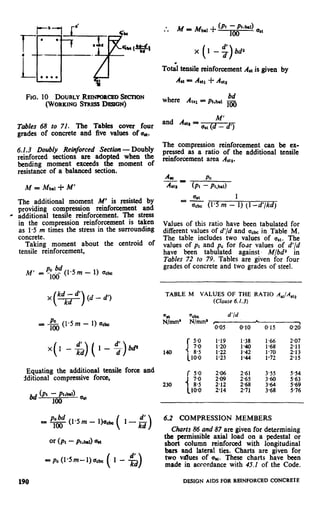
TABLE F STRESS IN COMPRESSION
REINFORCEMENT ftc, N/mm* IN DOUBLY
REINFORCED BEAMS WITH COLD-
WORKED BARS
(Clause 2.3 2)
fY9
N/mm’
415
500
d’ld
-A ,
0.0s 0.10 O-15 0.20
355 353 342 329
424 412 395 370
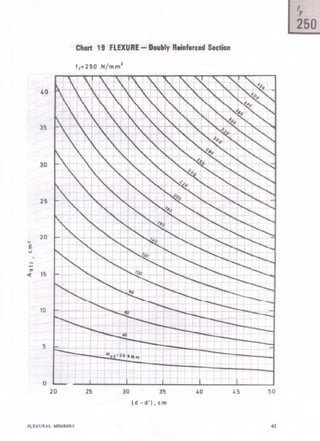
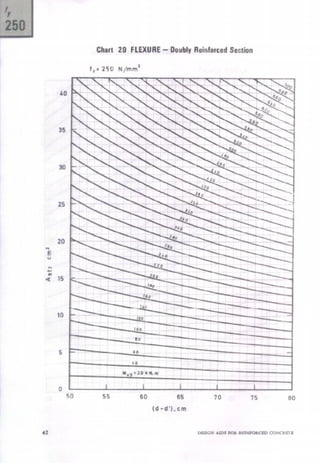
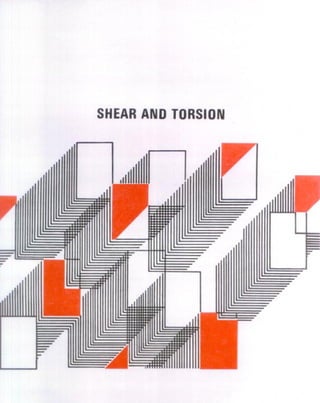
2.3.2.2 Astzhas been plotted against (d -d’)
for different values of MU, in Charts 19 and
20. These charts have been prepared for
fs = 217.5 N/mm2 and it is directly appli-
cable. for mild steel reinforcement with yield
stress of 250 N/mm*. Values of Aat? for other
grades of steel and also the values of A, can
be obtained by multiplying the value read
from the chart by the factors given in Table G.
The multiplying factors for A=, given in
this Table, are based on a value of fee corres-
ponding to concrete grade M20, but it can
be used for all grades of concrete with little
error.
TABLE G MULTIPLYING FACTORS FOR
USE WITH CHARTS 19 AND 20
‘Clause 2.3.2.1)
f
N&P
FACTOR FACTOR FOR A, FOR d’jd
FOR
A
c--
at* 0.05 0.10 0.15 0.2
250 1.00 1.04 1.04 1.04 1.04
415 0.60 0.63 0.63 0.65 0.68
500 0.50 0.52 0.54 0.56 0.60
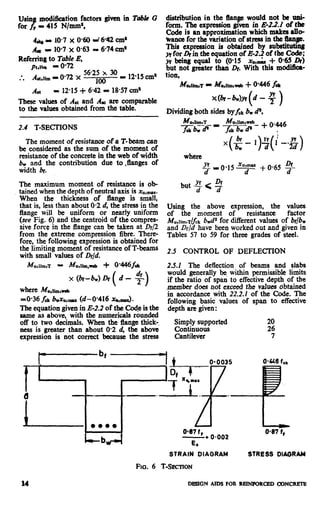
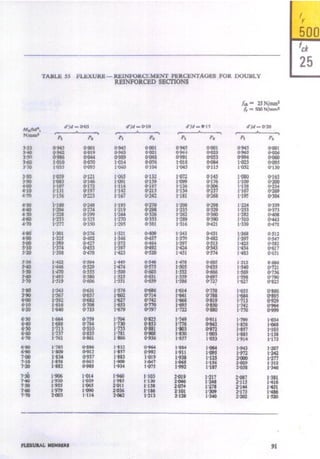
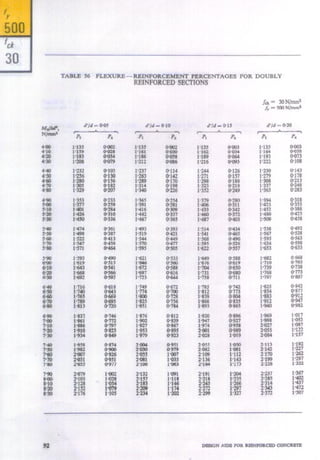
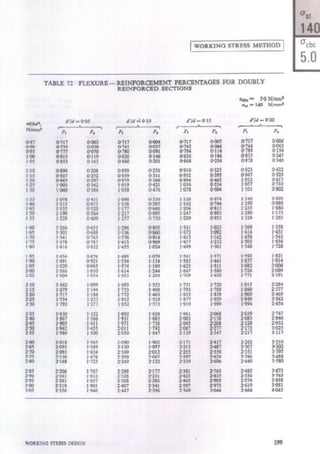
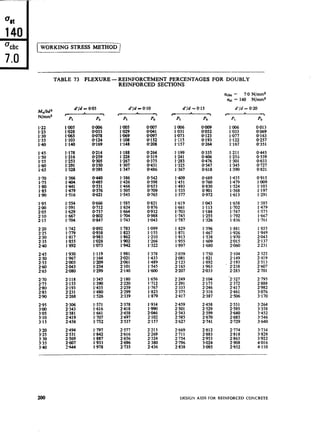
2.3.2.2 The expression for the moment of
resistance of a doubly reinforced section may
also be written in the following manner:
Mu = Mu,lim + %(0*87fy) (d-d’)
Mu Mu,lim
bj2 = bd”___ + -&(0*87f,)( I- ;>
where
ptz is the additional percentage of tensile
reinforcement.
Pt = phlim + pt2
PC =P”[-L-]
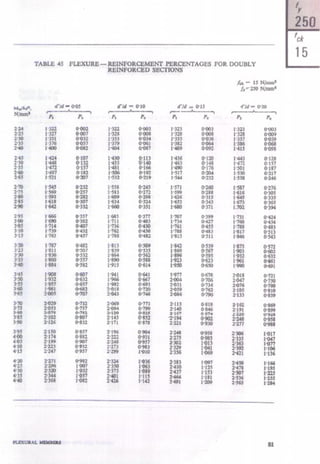
The values of pt and pc for four values of
d’jd up to 0.2 have been tabulated against
MU/bd2 in Tables 45 to 56. Tables are given
for three grades of steel and four grades
of concrete.
Example 3 Doubly Reinforced Beam
Determine the main reinforcements re-
quired for a rectangular beam section with
the following data:
Size of beam 30 x 6Ocm
Concrete mix M 15
Characteristic strength of 415 N/mm2
reinforcement
Factored moment 320 kN.m
Assuming 25 mm dia bars with 25 mm
clear cover,
d = fj0 - 2.5 - 225 = 56*25cm
From Table D, for fy = 415 N/mm2 and
fck = 15 N/mm2
Mu,linJbd”=2.07 N/mm2 = 2.07 x IO2kN/m”
.*. Mu,lim-2.07 x 10³bd2
30 56.25 56.25
-2.07 x 10”x loo x Ts- x -100-
= 196.5 kN.m
Actual moment of 320 kN.m is greater
than Mu,lim
*. . The section is to be designed as a doubly
reinforced section.
Reinforcement from Tables
Mu 320
$$ = O-562 5)2 x 10³~~~~~ N/mm2
d’/d c 2.5 + 1.25 i o,07
5625 >
Next higher value of d’/d = 0.1 will be used
for referring to Tables.
Referring to Table 49 corresponding to
MU/bd2 = 3.37 and $ = 0.1,
Pt = 1.117,pc = 0.418
.
. . At - 18.85 cm2, A, = 7.05 cm2
REINFORCEMENTFROM CHARTS
(d-d’) = (56.25 - 3.75) - 52.5 cm
Mu2 - (320 - 196.5) = 123.5 kN.m
Chart is given only for fy = 250 N/mm2;
therefore use Chart 20 and modification
factors according to Table G.
Referring to Chart 20,
Art2 (for fY = 250 N/mm2) = 10.7 cm2
FLEXURAL MEMBERS 13](https://image.slidesharecdn.com/sp16latest-130507020240-phpapp01/85/Sp16-latest-33-320.jpg)


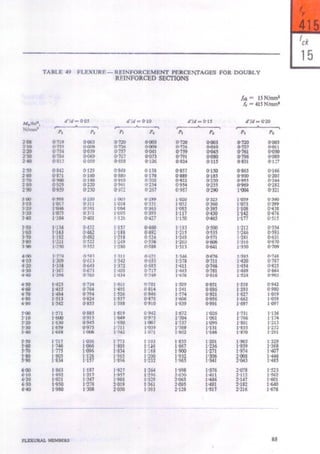


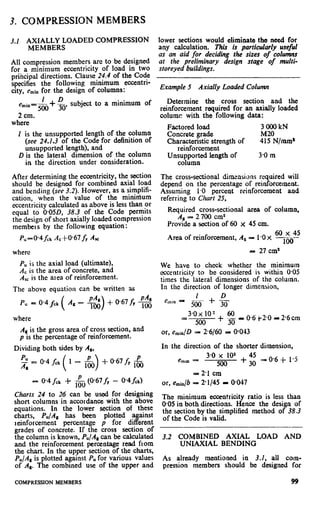
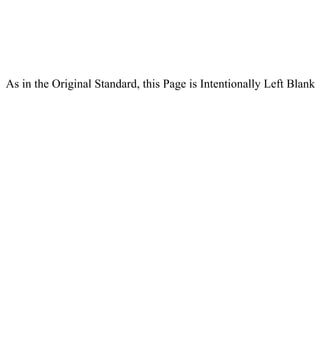
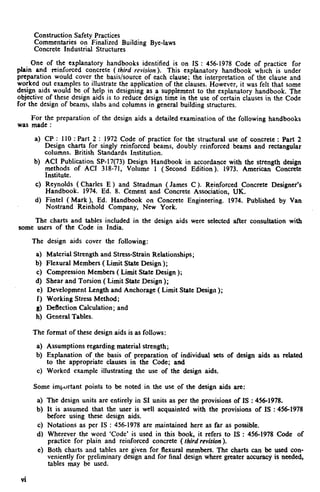
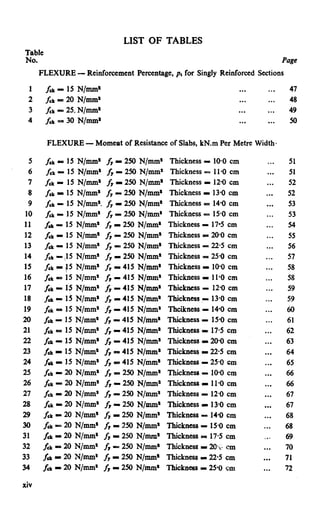
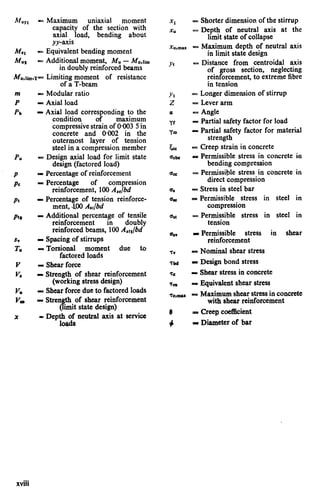
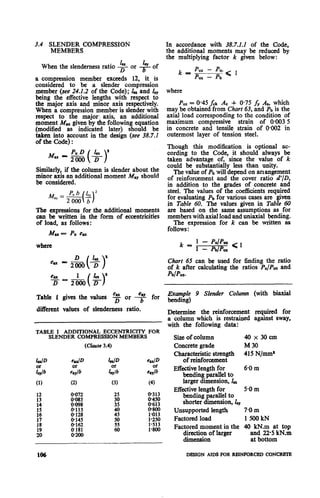
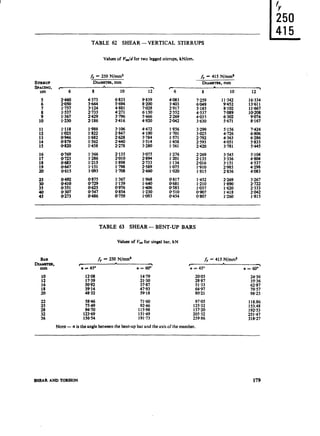
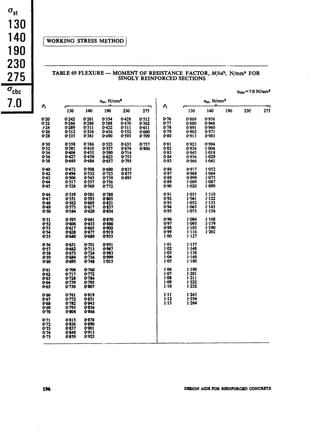
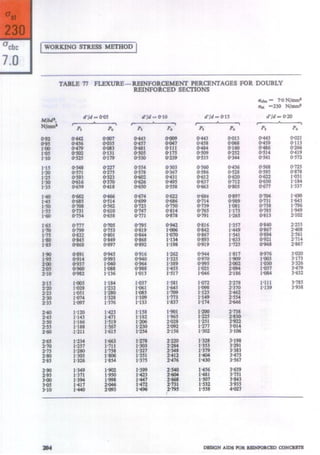
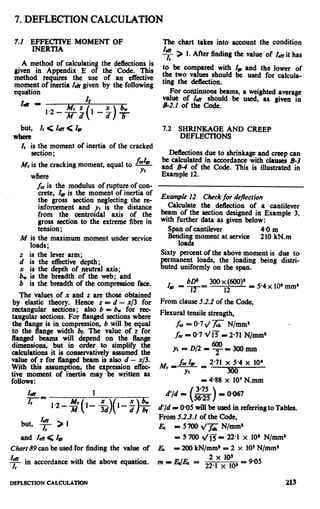
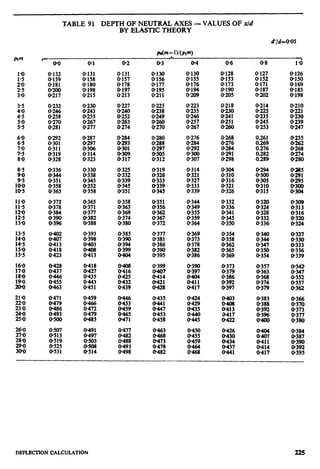
![minimum eccentricity of load. It should
alwaysbe ensuredthat the scotionis designed
for a moment whichis not lessthan that due
to the prescribedtinimum eccentricity.
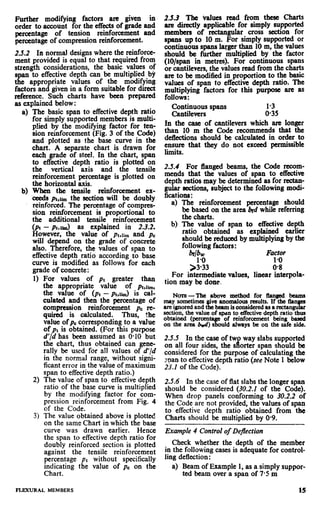
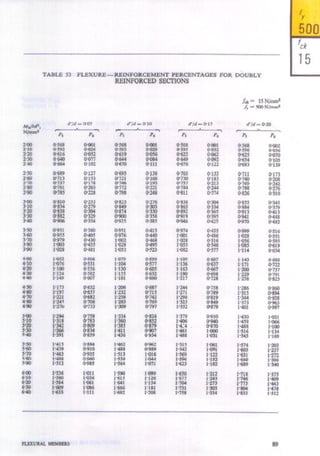
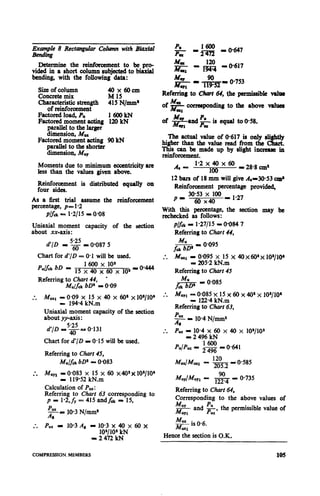
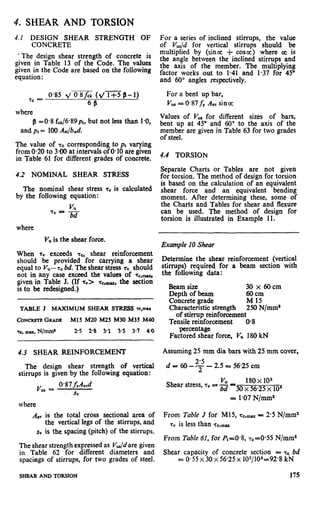
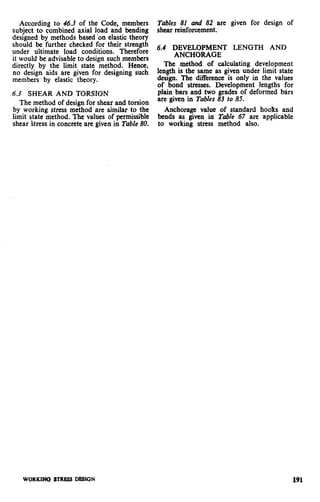
3.2.1 Amanptio&Assumptiom (a), (c),
(d) and (e) for flexural members (see 2.1)
are also applicable to members subjcoted
to combined axial load and bending. ‘The
assumption (b) that the maximum strain
in concrete at the outermost eom ression
ifibre is 04N35 is also applicablew en the
neutralaxis k withinthe seotionand in the
limitingcase when the neutralaxis lies along
one edge of the section; in the latter oasc
the strain varies from 0@035 at the highly
compressed edge to zero at the opposik
ed~. For purely axial compression, the
strain is assumed to be uniformly equal
00002 acxossthe seotion[see38.l(a) of the
Code]. The strairidistributionlines for these
~’ oases intersecteaeh other at a depth of
~ffom the highly compressed edge. This
point is assumedto act as a fulcrum for the
strain distribution line when the neutral
axis lies outsidethe motion(see Fig. 7). This
leads to the assumption that the strain at
the highly compresseded~ is 00035 minus
0?5 times the strainat the leastcompressed
edge [see 38.Z(b) of the Cole],
“-i t- - ---1-”
I
: 1
q ‘* q
I
q
*
q
q
i
q
q
c
b
q
:
0
0
I I
!
* q
t
q
J: IHIWilmY
q 00 EOOE
C6MPRE SSE II
CENTRO13AL AXIS
+’+ ikh ROW OF REINFORCEMENT
STRAIN DIAGRAMS
0035
Neutral axis
wlthln the scctlon
-30/7
-1
-— -----
Neutral axis
outside the sect ion
FIG. 7 Cmramm Am- LOAD AND UNIAXIAL BENDING
No DESIGNAIDSIK)RREINFORCEDCONCR81E](https://image.slidesharecdn.com/sp16latest-130507020240-phpapp01/85/Sp16-latest-120-320.jpg)
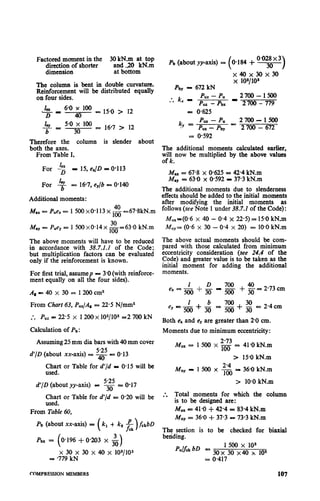
![3.2.2 Stress Block Parameters Wh&n the Area of stress block
NeutralAx& Lies O&sidethe Section- When
the neutral axis lies outside the section, g 4
the shape of the stress block will be as.indi-
- 0446f,D-5
( >
,-D
cated in Fig. 8. The stress is uniformly
0446fd for a distance of Ly from the highly
= 04461&D +gD
compressed edge because the strain is more - 0446fdr D
than 0402 and thereafter the stress diagram
[l-&&J]
is parabolic.
The centroid of the stress block will be
found by taking moments about the highly
compressed edge.
Moment about the highly compressed edge
D
pO1446fckD i
( 1-$ gD
t
i
The position of the centroid is obtained by
dividing the moment by the area. For diier-
ent values of k, the area of stress block and
STRAIN DIAORAM the position of its centroid are given in
Table H.
O-446 1,
BTRESS OIAORAW
FIG. 8 STRBSSBLOCK WHEN THE NEUTRAL
Am h¶ oUT?3IDE THE SECTION
Let x0- kD and let g be the ditference
between the strxs at the highly compressed
edgo and the stress at the least compressed
edge. Considering the geometric properties
of a parabola,
-o+Mf& &
( 1
1
TABLEH STRESSBLOCKPARAhUTTERS
WHENTHE NETmmtA&mA?NLIES OUTSIDE
(Clause 3.2.2)
Nom-Values of stress block parametershave
beentabulatedforvaluesof k upto4’00forinfom-
tion only. For constructionof interactiond@cams
it b merally adaquatato considervaluesof k up to
about 1.2.
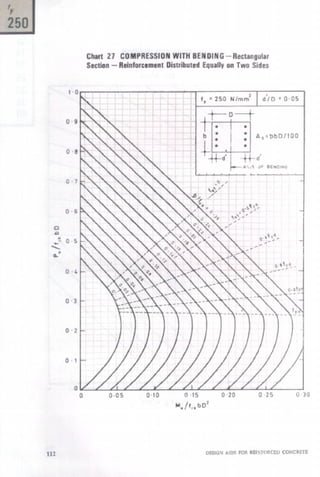
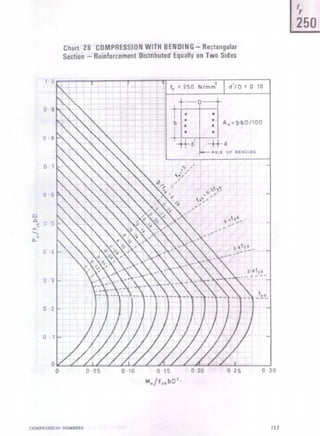
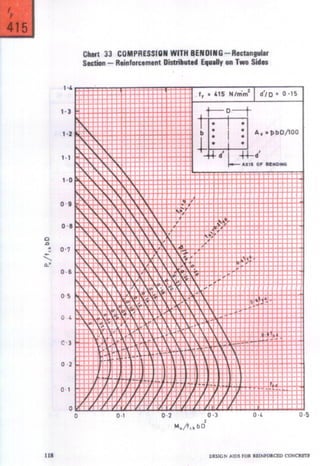
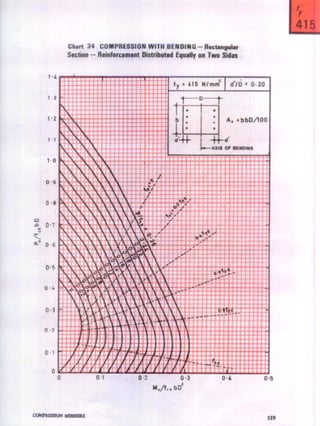
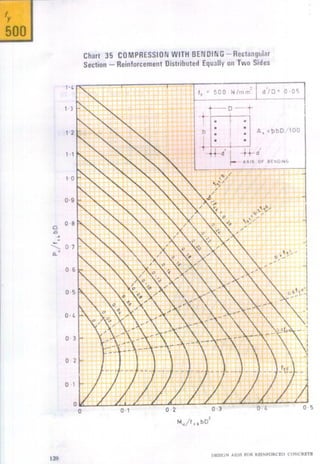
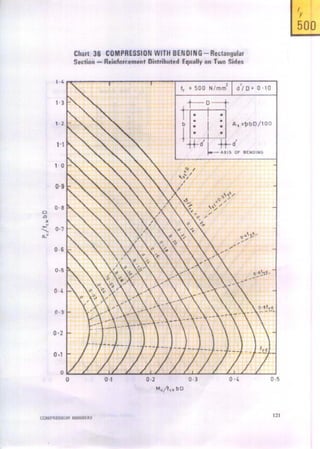
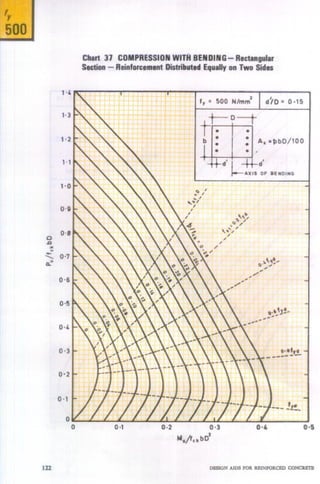
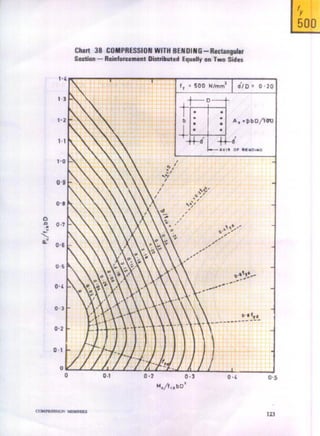
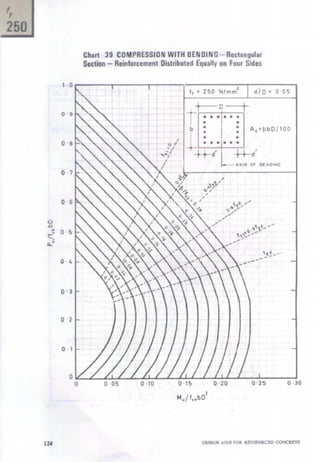
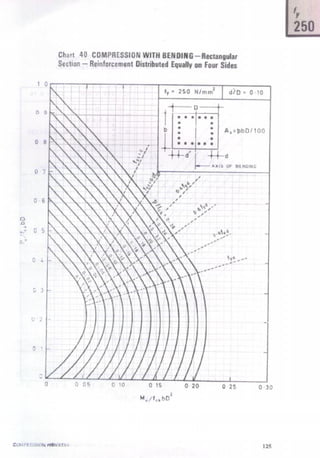
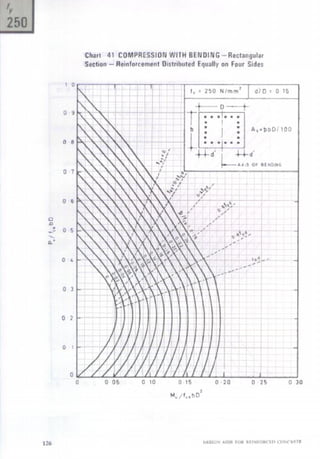
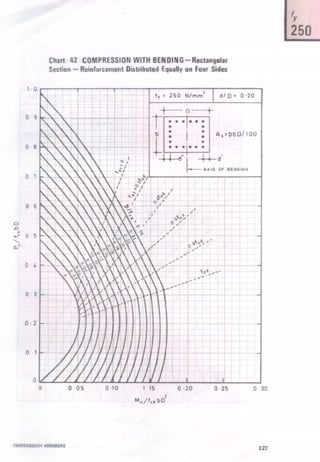
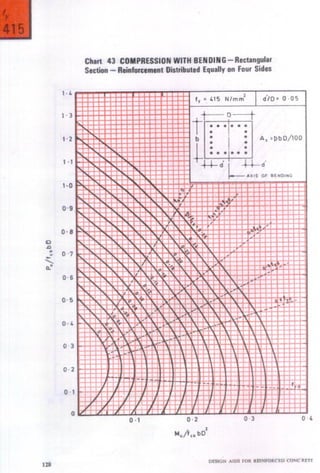
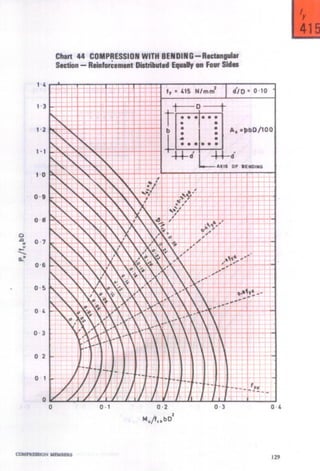
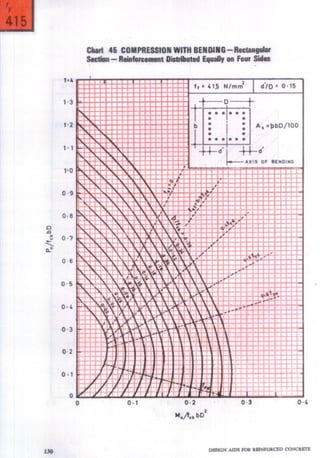
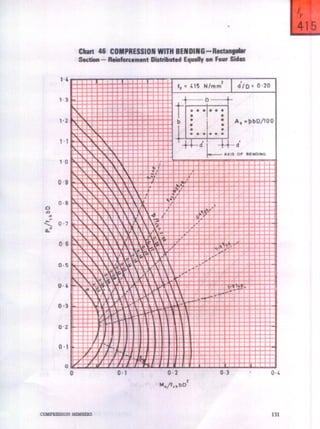
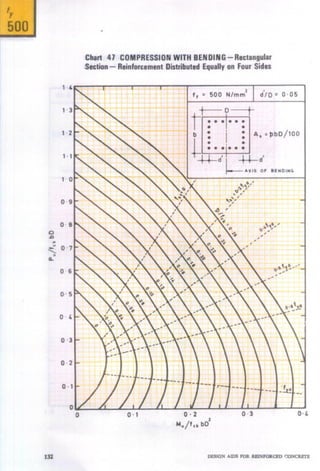
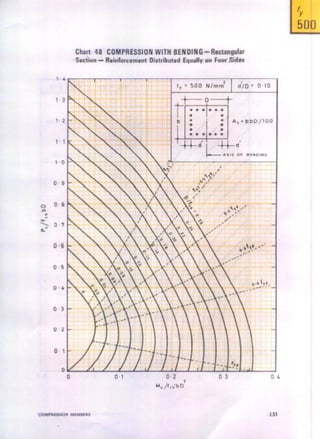
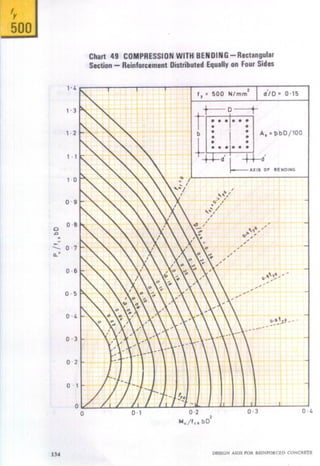
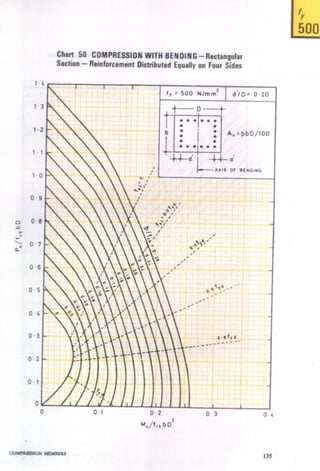
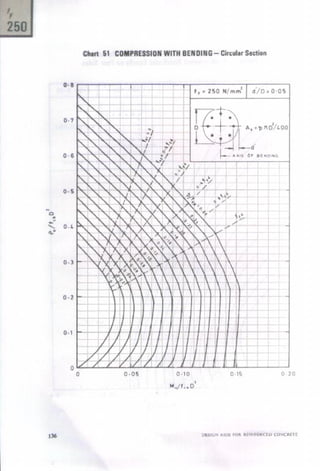
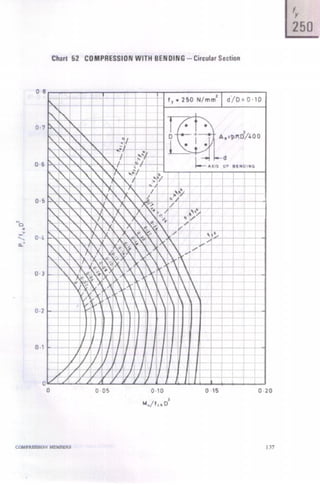
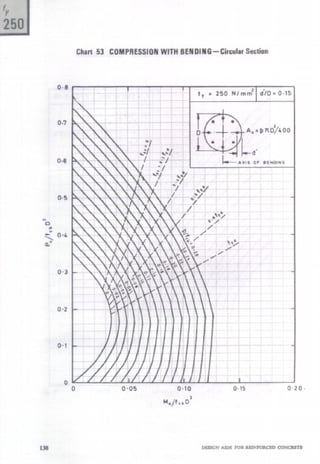
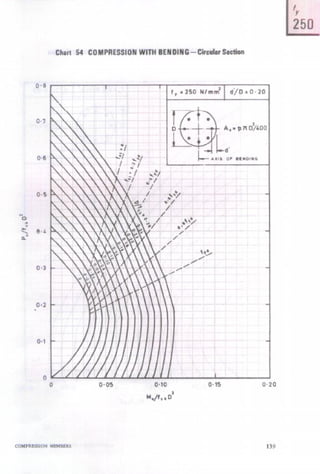
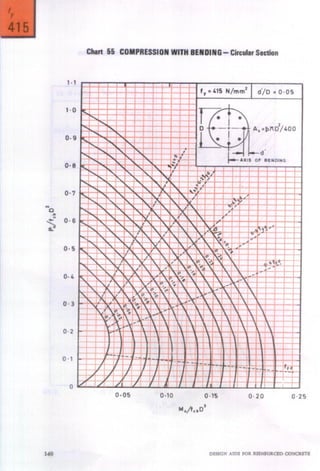
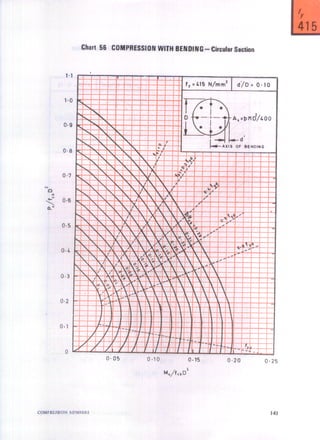
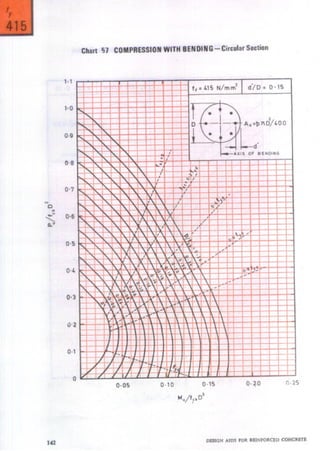
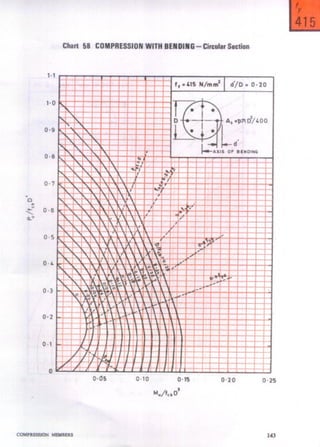
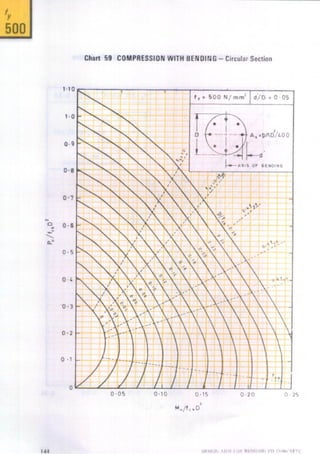
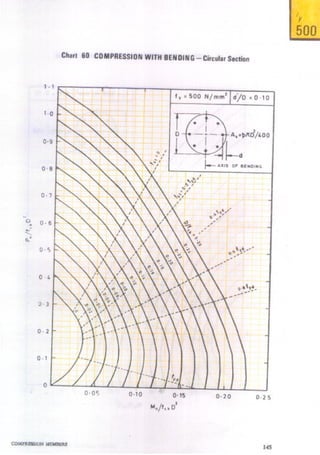
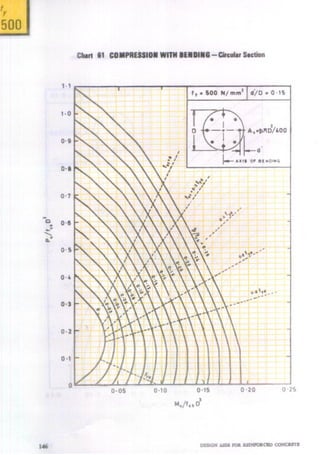
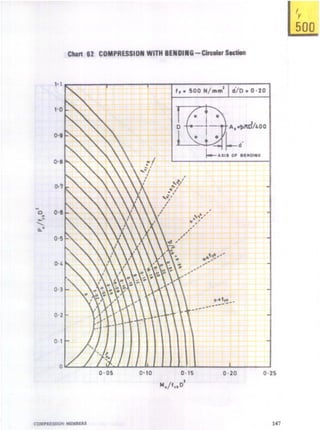
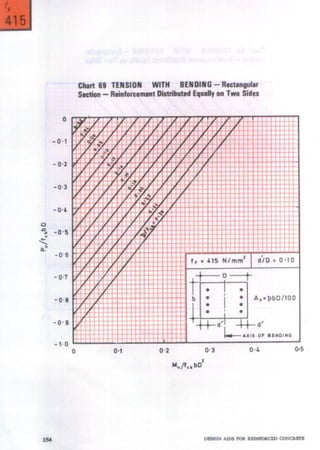
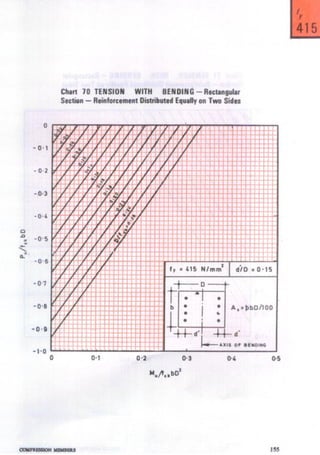
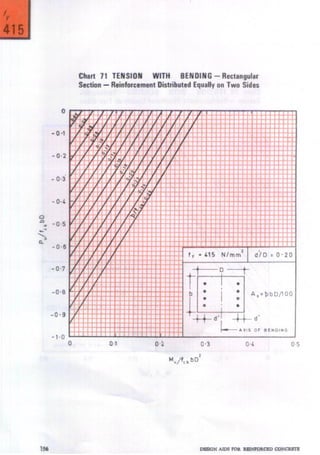
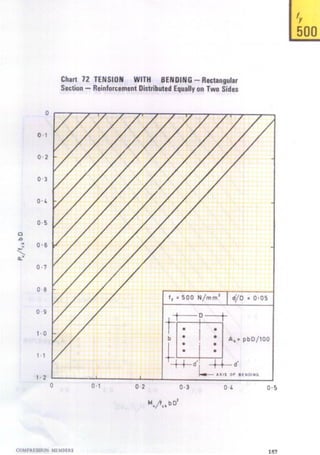
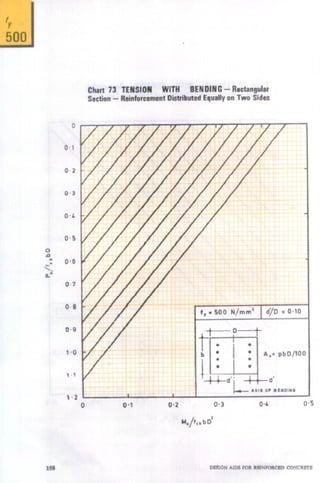
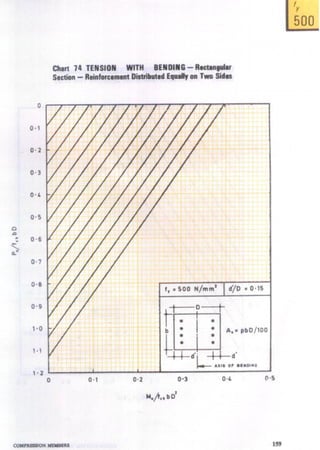
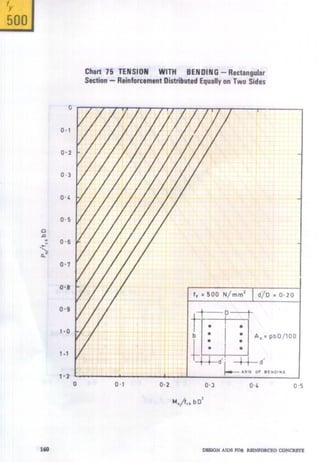
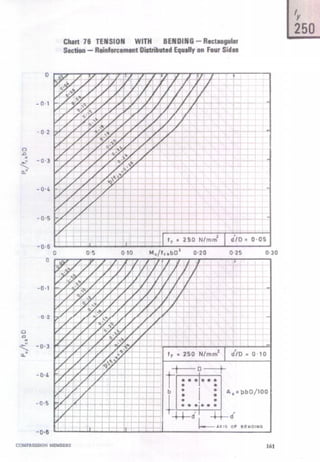
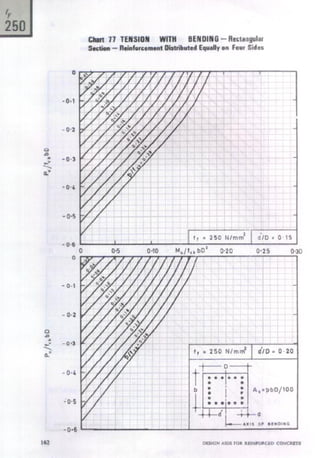
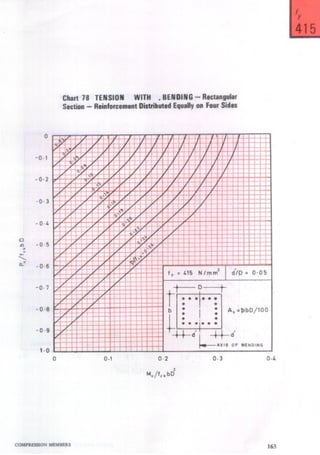
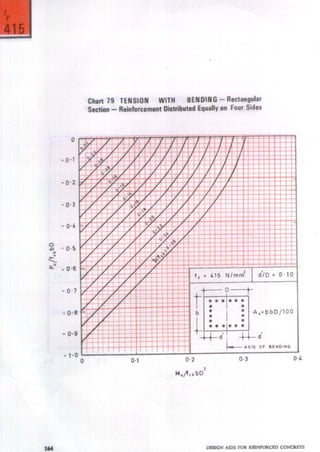
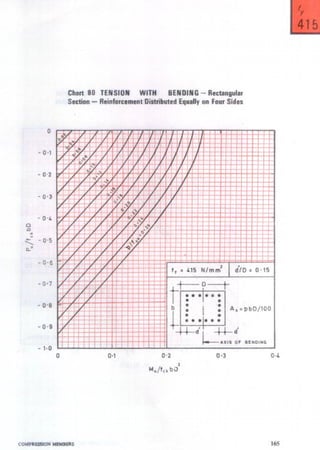
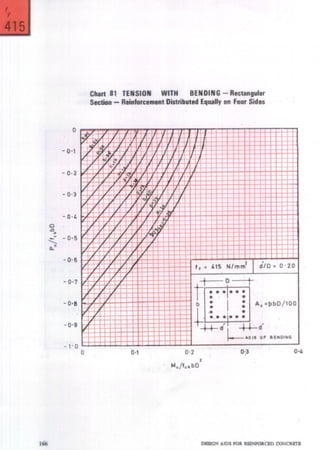
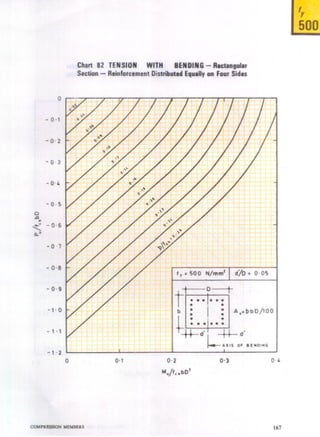
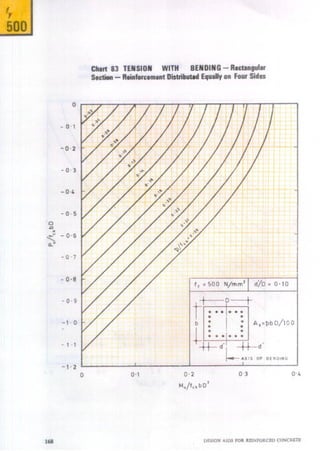
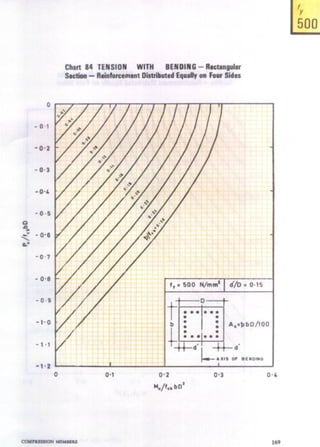
33.3 Constructionof InteractionDiagram-
Design chartsfor combined axialcompression
and bending are given in the form of inter-
action diagmms in which curyes for PJbDfd
versus MdbD* fb are plotted for different
values of p/f&, where p is the reinforcement
percentage.
COMPRESSlONMEMBERS 101](https://image.slidesharecdn.com/sp16latest-130507020240-phpapp01/85/Sp16-latest-121-320.jpg)


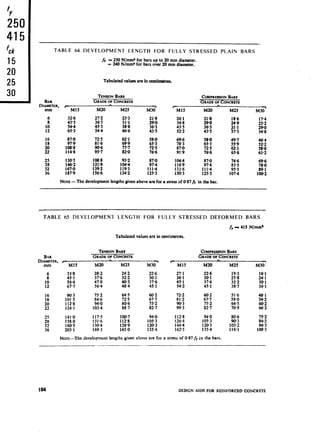
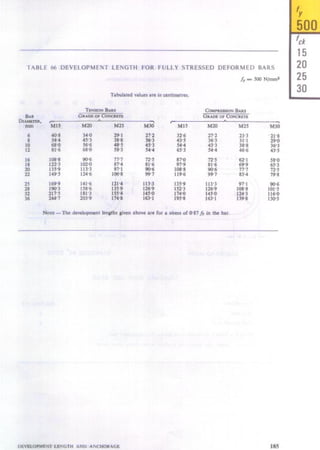
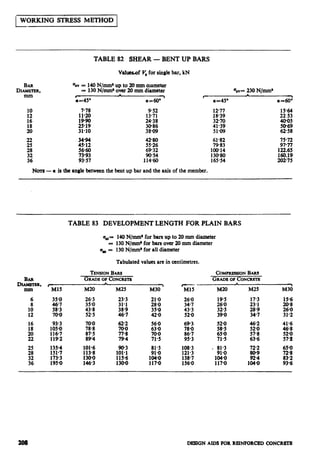
![5. DEVELOPMENT LENGTH
AND ANCHORAGE
5.2 DEVELOPMENT LENGTH OF
BARS
The development length Ld, is given by
+ esLd = ~
4 Tbd
where
4 is the diameter of the bar,
a, is the stress in the bar, and
7bd is the design bond stress given in
25.2.1.1 of the Code.
The value of the development kngth
corresponding to a stress of 0937 fY in the
reinforcement, is required for determining
the maximum permissible bar diameter for
positive moment reinforcement [see 25.2.3.3(c)
of the Code] and for determining the length
of lap splices (see 25.2.5.2 of the Code).
Values of this development length for diffe-
rent grades of steel and concrete are given
in Tables 64 to 66. The tables contain the
development length values for bars in tension
as well as compression.
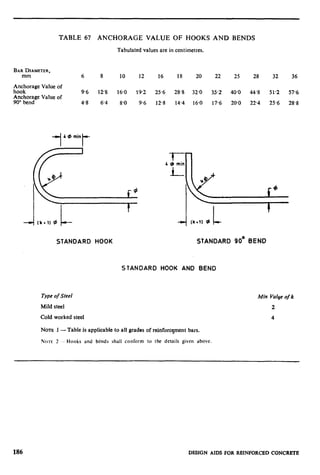
5.2 ANCHORAGE VALUE OF HOOKS
AND BENDS
In the case of bars in tension, a standard
hook has an anchorage value equivalent to a
straight length of 16# and a 90” bend has
an anchorage value of 84. The anchorage
values of standard hooks and bends for
different bar diameters are given in Table 67.
DEVIXWMENT LRNGTH AND ANCHORAGE
183](https://image.slidesharecdn.com/sp16latest-130507020240-phpapp01/85/Sp16-latest-203-320.jpg)


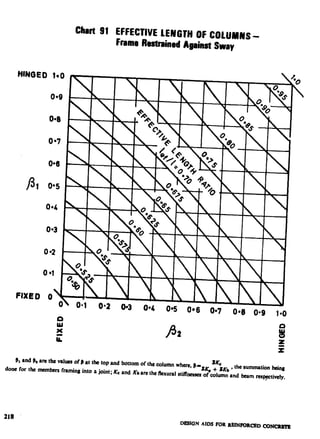
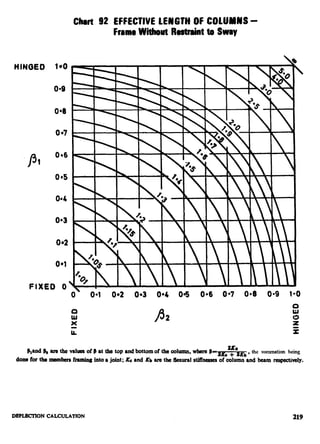

This document provides design aids for reinforced concrete structures based on Indian Standard IS: 456-1978 Code of Practice for Plain and Reinforced Concrete. The design aids cover material strength and stress-strain relationships, flexural members, compression members, shear and torsion, development length and anchorage, working stress design, deflection calculation, and general tables. Charts and tables are provided for preliminary and final design of beams, slabs, and columns. Assumptions made in developing the design aids are explained. An example illustrates the use of the design aids. Important points regarding the use and limitations of the charts and tables are noted. The design aids were prepared based on examination of international handbooks and consultation with Indian


