Download to read offline

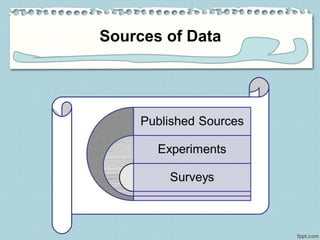

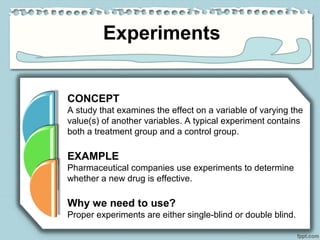
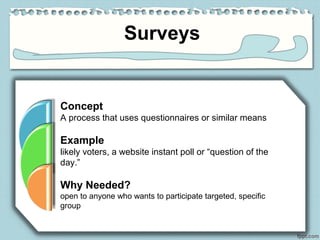
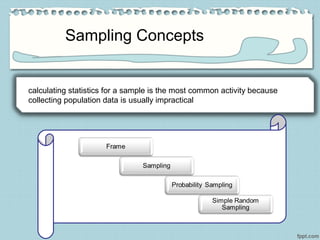
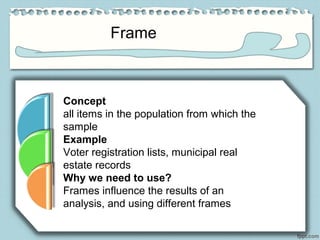
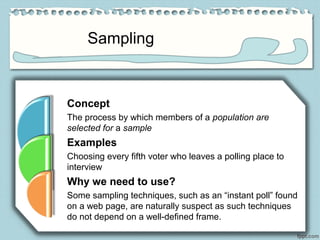
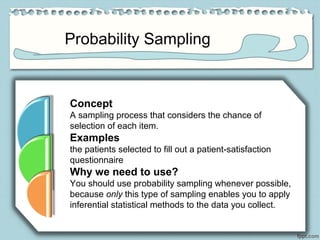
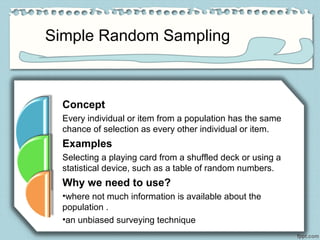
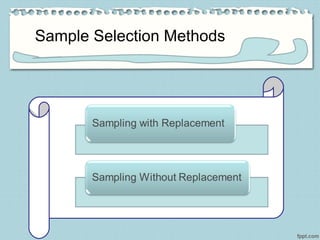

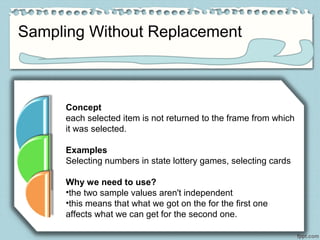

The document outlines various data sources, emphasizing the distinction between primary and secondary data, and the importance of understanding biases in published information. It discusses different methodologies for data collection, including experiments, surveys, and sampling techniques like probability sampling, simple random sampling, and sampling with or without replacement. Additionally, it highlights the necessity of proper sampling methods to ensure reliable and valid statistical analysis.


![Business Statistics for Managers with SPSS[1].pptx](https://cdn.slidesharecdn.com/ss_thumbnails/bsmwithspss1-240921045433-4aaea049-thumbnail.jpg?width=640&height=640&fit=bounds)


