Download to read offline


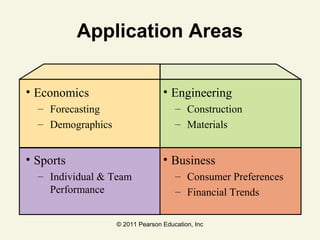

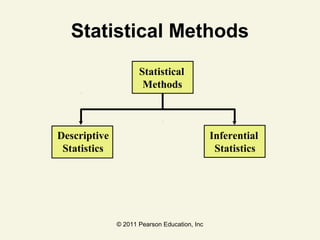
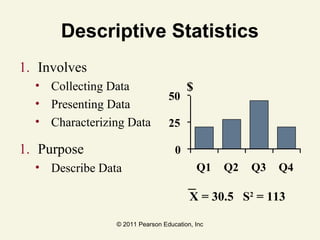


The document is an introduction to the field of statistics, detailing its role in business decision-making and data analysis. It covers fundamental concepts, types of statistical applications, methods for collecting and analyzing data, and the distinction between descriptive and inferential statistics. Key aspects include understanding populations and samples, types of data, and potential biases in sampling.


![Business Statistics for Managers with SPSS[1].pptx](https://cdn.slidesharecdn.com/ss_thumbnails/bsmwithspss1-240921045433-4aaea049-thumbnail.jpg?width=640&height=640&fit=bounds)