Downloaded 1,968 times


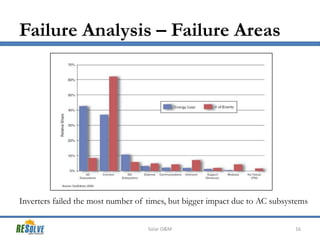
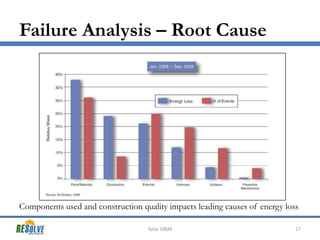
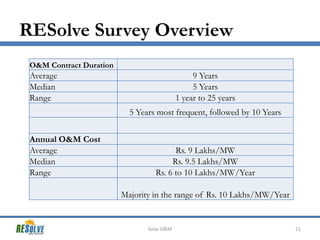
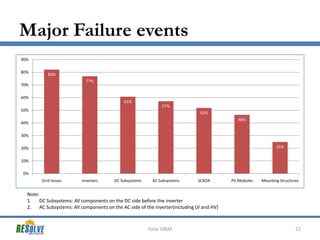
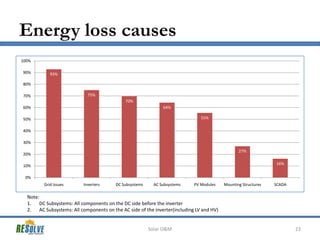
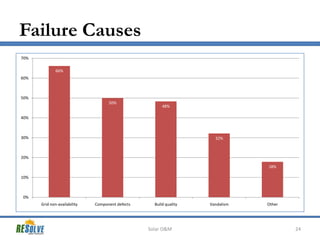


The document discusses solar PV O&M practices in India based on a survey of over 600 MW of installed capacity. The key findings are: 1. Grid issues and inverters were the most common failure events, responsible for the highest energy losses. 2. Component defects and poor build quality were the major root causes of failures. 3. Annual O&M costs averaged Rs. 9 lakhs/MW with most projects spending Rs. 10 lakhs/MW annually.


