Download to read offline

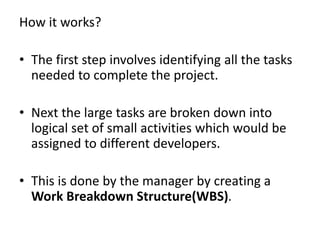
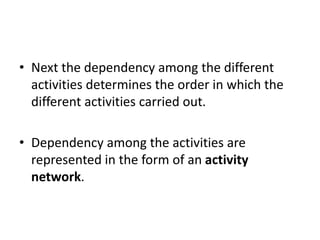


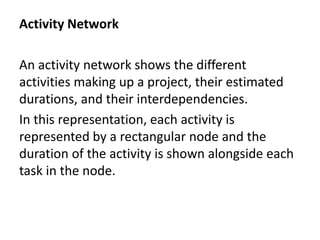


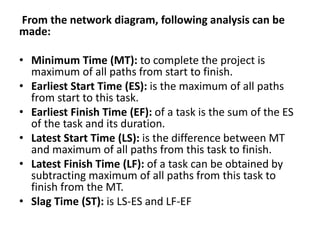


This document discusses project scheduling in software engineering. It defines scheduling as deciding which tasks will be completed and when. To schedule a project, a manager must: 1) identify all tasks, 2) break large tasks into smaller activities, 3) determine dependencies between activities, 4) estimate time durations, 5) allocate resources, and 6) plan start and end dates. The critical path is the longest sequence of activities that determines the minimum project duration. Common scheduling tools include work breakdown structures, activity networks, Gantt charts, and PERT charts.