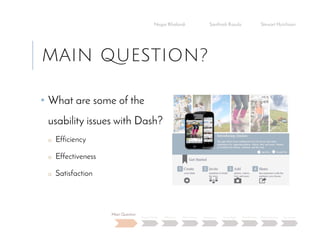
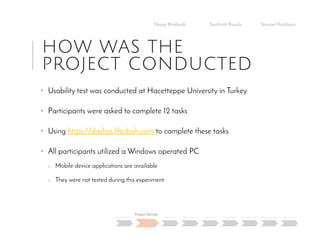
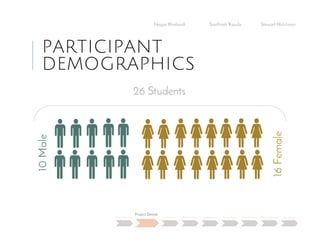
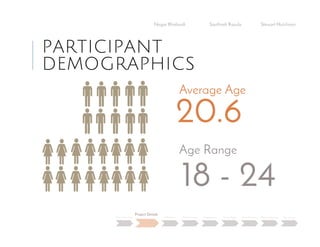
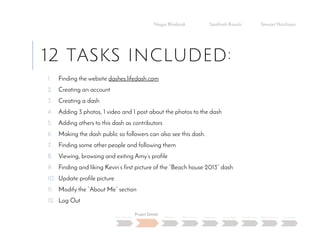
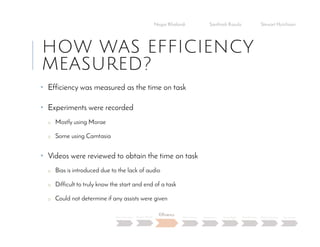
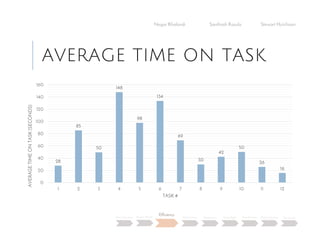
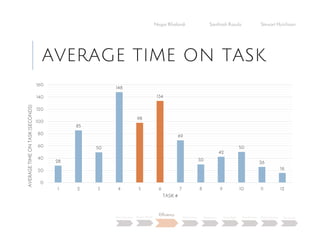
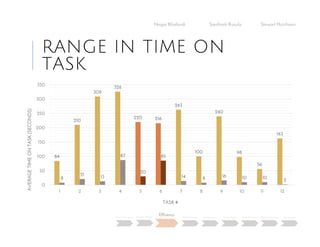
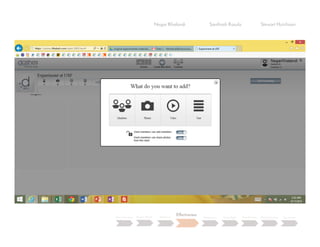
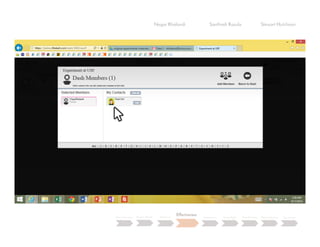
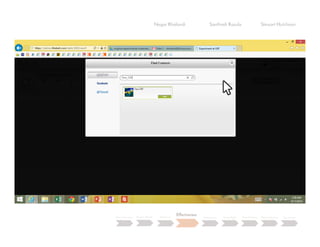
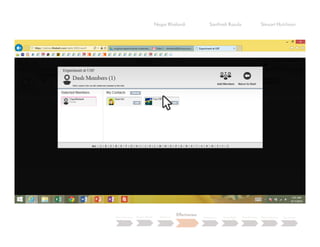
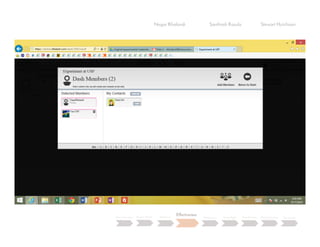
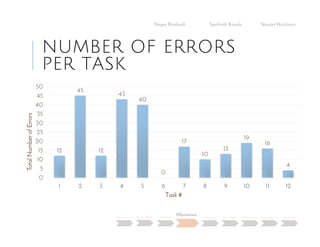
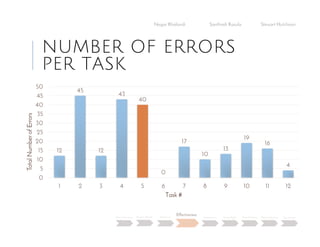
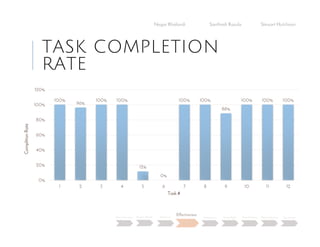
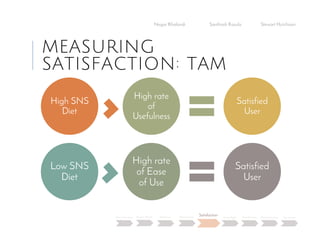
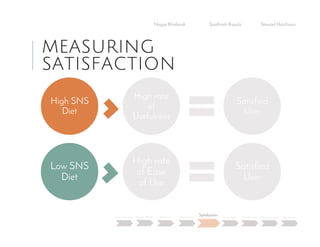
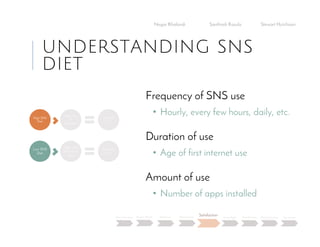
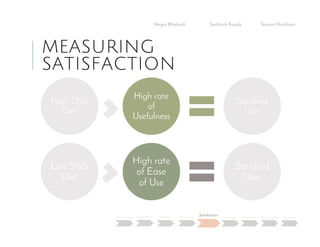
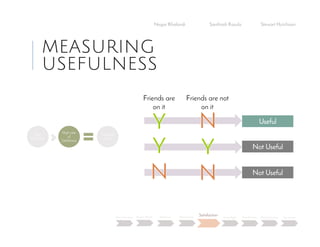
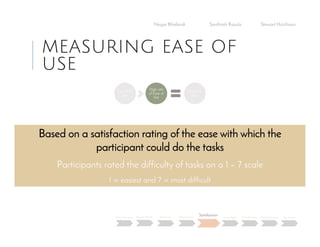
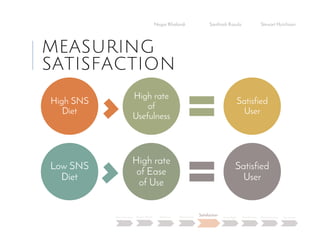
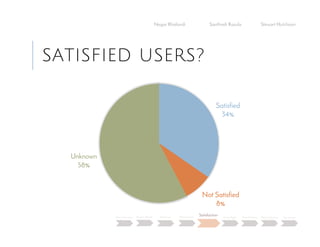
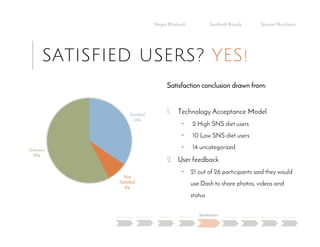
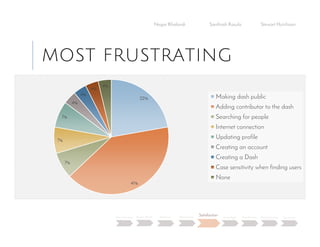
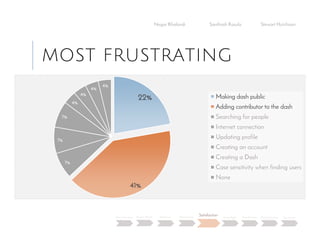
The document summarizes a usability study conducted on the social networking site Dash. 26 students participated in the study, which involved completing 12 tasks on the site like creating an account, adding photos to a dash, and searching for other users. The study measured efficiency by time on task, effectiveness by number of errors, and satisfaction using a technology acceptance model. Key findings were that setting contacts as contributors and searching for friends were inefficient. Overall, 34% of users reported satisfaction with Dash while 41% found adding contributors most frustrating. Researchers concluded the unique security controls were effective but interface improvements could enhance usability.
Seven Deadly Sins of Enterprise Software Development & What to do About Themkevinjmireles
Are you wondering why your IT modernization & Digital Transformation projects aren't proceeding as desired your adoption of agile, scrum & SAFe aren't delivering the results you hoped for?
This presentation will visually explain many of the challenges you face, in a way that even your boss and stakeholders can understand.
I'll show you:
1. How to explain why math prevents you from accurately estimating project timelines and are therefore never actually behind schedule.
2. The negative impacts of deadline-driven development and how to avoid them.
3. How to explain the difference between startup agile and enterprise agile, and what happens you confuse the two.
4. Why you need to design and architect for the 1% of your customers that drive 80% of your complexity and 50+% of your revenue.
5.The concept of minimum viable replacement and how to think about modernization/migration projects.
6. Why throwing away work is a good engineering practice and how it can save you money
7. How to avoid confusing in market with market ready.
How to Predict Your Software Project's Probability of Successkevinjmireles
Ever wonder why your software projects are never delivered on time and budget? Then take five minutes to learn why and how to calculate the probability of your project's success within the estimated time and budget.
Executive Function: Effective Strategies and InterventionsDavid Nowell
The document discusses executive function and strategies for assessment and intervention. It provides an overview of executive function models and domains. Assessment methods are described, including formal tests, record reviews, and interviews. Challenges in various life domains are reviewed, with strategies for the classroom, homework, social skills, and accommodations for deficits. Sample IEP goals target self-awareness, goal setting, planning, organizing, and problem solving.
3 beliefs you need to let go to start you agile journey – Agile EE 2017Antti Kirjavainen
The document discusses 3 beliefs that can hold organizations back from embracing agile practices:
1) Believing in batch processing and maximizing resource efficiency. This overlooks the value of adaptability and early feedback.
2) Thinking people should be fully utilized on planned work and using specialists only for their specific tasks. This reduces flexibility and information sharing.
3) Thinking new processes can simply be rolled out through changes in structure. True change requires understanding and commitment from people.
It argues these beliefs are hard to change because they are unconscious assumptions connected to other beliefs. The document proposes experiences, reflection, and real-world application can help replace beliefs by forming new connections in people's cognition, as was done with games
This document provides an overview of a presentation on executive functions. It includes sections on brain overview, models of executive dysfunction, strategic behavioral inquiry, disorders that impact executive functions, real-life implications of executive function deficits, and strategies to support executive functions in various domains. The presentation aims to educate attendees on executive functions and how to apply strategies to support individuals with executive dysfunction.
Information Technology - Discover the Root Cause and Develop a solution throu...John Hudson
The presentation was compiled by Thinking Dimensions Global in November 2012 for the ITSMF conference held in London. The content relates to the KEPNERandFOURIE process for dealing with incidents and problems in IT and in particular a means of determining the Root Cause and providing the best solution.
The presentation was co-presented by Dr Mat-thys Fourie and John Hudson of Thinking Dimensions Global
Organizations need a way to test new ideas and fast, kill ideas that don’t work and iterate on the ones that show more promise. In 2017, IDEO studied innovation in over 100+ companies and found that when teams iterate on five or more different solutions, they are 50% more likely to launch a product or service successfully.
The practice of continuous product improvement and innovation is a cycle of experimentation, where teams rapidly test leap-of-faith assumptions and get evidence to support key business decisions, ultimately, helping to build consensus and collaborate more effectively with stakeholders.
A common challenge is having the discipline to identify, test and track progress towards innovation and making the cycle of experimentation and learning a key practice on any team.
Download the additional resources that are available for this presentation at https://info.adaptivex.ca/innovation-toolkit
Learn how Indiana University leveraging IT service management data strategically to improve service delivery, grow their service offering, and strategically support the institutional initiatives.
IT Support Analytics = Better DecisionsBMC Software
This document discusses how analytics and access to the right information can help IT support teams make better decisions. It emphasizes the importance of having a variety of updated data sources organized in a clear and accessible manner. Examples are provided of how Indiana University's IT support team leverages different metrics and historical trends to assess performance, adjust operations in response to increased volume, and share knowledge with other institutions.
SymEx 2015 - Faster Projects, High Performance and Team Harmony with Critical...PMI Indonesia Chapter
Do you often face resource and budget constraints, but are often asked to complete your projects faster by sponsors and customers? Are projects frequently under crisis, where due dates are missed and overtime is required to get things done? Are many projects constantly in red status? Do you believe that your organization could achieve higher levels of success if these issues were solved?
This presentation by Joe Cooper provides insights into Critical Chain Project Management (CCPM) which improves project speed, quality, and on-time performance. We will cover many pain points such as unrealistic due dates, missed project due dates, scarce resources, the inability to establish highly achievable finish dates, lack of realistic task estimates, low team morale due to work overload, and situations where PMs are forced by project sponsors to speed up projects.
Lack of focus and inability to manage uncertainty are two significant causes of project delays, diminished quality requiring rework, and projects that take too long to complete. By addressing these root causes, CCPM techniques improve project speed, quality, on-time performance, and work-life balance. Reducing nonproductive multitasking enables high-speed execution, high-quality deliverables, a greater sense of accomplishment, and an increased capacity to think and to innovate for team members and management.
CCPM has been adopted by several leading global organizations including Eli Lilly, IBM and Mazda Motors. Now, you could take this innovative approach to your organization as well, with the plan to significantly improve the project management results.
Introduces the "TAIS" The Attention and Interpersonal Styles diagnostic assessment tool. Used by Business, Navy Seals, Army Rangers, US Olympic Committee.
The document discusses the benefits of good visual design in educational materials. It notes that 66% of stimuli reaching the brain are visual, 50% of the brain is devoted to visual processing, and 80% of learning is visually-based. The document provides tips for design including using emphasis, effective typography, color, layout, and balance. It provides examples of how linear text and visuals can enhance understanding and examples of best practices for designing handouts.
http://verraes.net
The project was of to a bad start: an inherited legacy codebase, a waterfall contract, and a projected loss. The promise of Kaizen or Continuous Improvement seemed very appealing. But when we tried to incorporate this into our process, it didn’t catch on. Biweekly retrospectives didn’t seem to expose any problems we could improve upon. The ceremonies we tried, like Deming’s Plan-Do-Check-Act cycles, added too much overhead. We were doing something wrong.
Continuous Improvement implies that you know exactly where to focus your efforts. Like scientists, we started to experiment, without deciding upfront what we expected the outcome to be. The rules? Make every experiment as small as possible. No meetings, no consensus, no cumbersome evaluation process. We let the results speak for themselves. This talk explores the successes and failures of a team that went from survival mode to learning mode over the course of a year.
May 16 from 1:00 - 2:00 ET
Presented by Chad Westbrook, AGCO
In this webinar, you'll learn a structured approach to problem-solving using the following tools:
5G – A tool used to describe a loss phenomenon
5W1H – An approach to the revised phenomenon
4M1D – Defining the contributing factors to the revised phenomenon
4M1D Confirmation – Validating the contributing factors
5 Why’s – Root cause and effective countermeasures
Chad Westbrook
Chad Westbrook is a manufacturing engineering manager and AGCO Production System manager at AGCO Corporation. Chad has a bachelor's degree in Mechanical Engineering Related Technologies from Kansas State University.
This document discusses how mindfulness can benefit businesses and employees. It notes that modern work environments often involve volatile, uncertain, complex, and ambiguous conditions that leave employees feeling pressured, always on, overloaded with information, and distracted. Research shows that on average, people's minds wander 47% of the time and tasks take 30% longer when multi-tasking. Mindfulness involves paying attention to the present moment with curiosity and kindness, and can help with attention, emotion regulation, and self-awareness. Mindfulness practice has been shown to decrease stress and change brain regions involved in these skills. The document outlines how a large company has integrated mindfulness into its wellbeing framework at various levels to promote overall health, productivity, and social
Lend Me Your Brain: Supporting TBI Survivors around Executive FunctioningDavid Nowell
Parents, counselors, case managers, and physicians are frequently called upon to support TBI survivors as they navigate decision-making, planning, and self-regulation. These key features of executive functioning are often areas of weakness for brain injury survivors, because of frontal lobe involvement. This workshop provides professionals and non-professionals alike with a model for thinking about executive functioning and strategies for providing the best supports – at the right points – for their clients and loved ones who have survived a brain injury.
LearningQ: A Large-scale Dataset for Educational Question Generation (ICWSM 2...Guanliang Chen
Presentation given in the AAAI Conference on Web and Social Media (ICWSM) in June 2018, describing how to collect LearningQ, a large-scale dataset can be used for educational question generation.
Predictive Analytics & Business InsightsJune Andrews
The document outlines a process called the "Data Driven Decision Engine" which combines engineering, data science, and product management to make better decisions. It describes generating ideas from many sources, sizing opportunities, developing products in a controlled way, communicating recommendations, and continuously learning and improving the process. The goal is to use data-driven insights along with human perspectives to build products that balance growth, quality, and member experience over the long term.
This document summarizes research from a presentation on productivity from telework. The presentation discusses the benefits of telework including increased productivity, employee satisfaction, and cost reductions. A survey of 350 home workers found that the overwhelming majority reported increased productivity when working from home, with increases in output up to 25% for some. The main reasons for increased productivity included fewer interruptions at home, the ability to better balance work and commitments, and making use of commuting time for work. The implications discussed are that traditional assumptions about lack of productivity from home are wrong, and telework should be incorporated into business strategies given the substantial gains it can provide to the bottom line.
This document outlines steps for problem solving which include beginning with the desired outcome or solution in mind, presenting the problem or question to be addressed, analyzing potential approaches, collaborating to share ideas, and applying ideas to real world problems and situations.
Growth, Engagement & Search Metrics: Snake Oil or North StarsJune Andrews
Talk at Social Media & Web Analytics
LinkedIn's homepage contains content from over 40 product areas and has evolved over hundreds of experiments. For modern websites this is not an unusual phenomena. To parallelize website development and work in harmony, product teams rely on two guidance systems, organizational cohesion and analytical feedback. Our focus is analytics and in particular, metrics. Unfortunately, not all metrics are created equal. Common metrics such as mean average precision and engagement stickiness have massive downsides if used incorrectly. Here we explore criteria to align optimizing metrics with improving user experience and reaching company goals.
The document summarizes a presentation given by Steve Krug on usability testing. It discusses that usability testing is important for understanding how real users interact with a system. It advocates for low-cost DIY usability testing with only a few participants rather than traditional expensive usability testing with many participants in a lab. It provides guidance on how to effectively conduct simple usability tests, including tips on moderating, note-taking, and prioritizing the most critical problems to address.
Prototype Testing: Working Smarter, Not HarderNicole Maynard
The document discusses different methods for prototype testing, including traditional usability testing which can take weeks or months at a cost of $10,000-$25,000. It proposes a method of "traditional smart prototype testing" which streamlines the process into a single day by shortening tasks, using informal participant recruitment, and having observers provide real-time feedback. This method allows for multiple iterative tests to be conducted quickly and at lower cost than traditional usability testing.
The document discusses using root cause analysis to improve safety. It explains that root cause analysis involves gathering facts about what happened, determining why it occurred, and identifying solutions to prevent future incidents. The document outlines different models for analyzing root causes, such as cause-and-effect diagrams and 5 Why analysis. It also discusses how safety software can help with root cause analysis by facilitating data collection, identifying trends, and tracking corrective actions. A free webinar on the topic will be held on August 20.
Implementing the READ (Reference Effort Assessment Data) as an Additional Mea...jkh156
By Kelsey Cheshire and Emily Porter-Fyke, University of North Carolina Greensboro Libraries.
Presented on March 25, 2015 for the Trends in Analyzing Reference Data portion of the NCLA-RASS Conference Series--Trends in Reference 2015.
Got Numb3rs? Community Metrics and AnalysisJillianLaura
"Got Numbers? Community Metrics and Analysis" Presentation by Jillian Bejtlich from June 2012 Enterprise 2.0 Boston conference.
For anyone working in community management, you’re well aware it’s not all about sitting on social networks all day chatting it up. Users and sometimes even our own co-workers are shocked to find out we are the ones pulling massive reports and trying to make sense of millions of data points. Who knew community management was so focused on mathematics?
As a member of marketing, communications, support, or whoever the community is run by, you’re probably accustom to being asked for a variety of metrics and ways to prove success, profitability, and efficiency. But where in the world do you start? This session will help guide you through some of the actual practices of putting numbers to work. We’ll go through some simple ways of creating valuable and easy to understand analyses, how to find something worthwhile in the massive data files, and ways of sharing your mathematical discoveries with others in easy and comprehensive manners.
The Role of Data in Becoming a High Performing SchoolQualtrics
This on-demand webinar shares how schools can utilise data to become a high performing school.
Speakers:
- Dr Phil Cummins, Managing Director, CIRCLE. Phil covers the 7 rules of being data driven in your school.
- Dave Vannette, Principal Research Scientist, Qualtrics. Dave covers best practices for survey questionnaire design.
What is the story with agile data keynote agile 2018 (Magennis)Troy Magennis
This document discusses using data to improve agile practices and outcomes. It argues that agile has lost the "data war" by not capturing and utilizing data from teams effectively. It suggests that data needs to be handled safely to avoid embarrassing people and destroying the utility of historical data. Better ways are needed to measure outcomes rather than just output, and to balance predictability with creativity. The document also discusses visualizing and managing dependencies, comparing performance across teams, and using the right metrics depending on a team's characteristics and challenges. The overarching message is that data needs to be used carefully and conversationally to drive the right actions and improve agile practices.
This resume summarizes the qualifications and experience of Lori E. Prentice. She has over 30 years of experience as an engineering geologist, including 24 years with Fugro Consultants as a principal engineering geologist. She holds licenses as a Professional Geologist in California and a Certified Engineering Geologist. The resume lists her education in geology from the University of Southern California and safety certifications. It provides details on her current role as president of Oakridge Geoscience, Inc., and highlights relevant project experience including geotechnical studies for infrastructure projects.
This short document promotes creating presentations using Haiku Deck, a tool for making slideshows. It encourages the reader to get started making their own Haiku Deck presentation and sharing it on SlideShare. In a single sentence, it pitches the idea of using Haiku Deck to easily design presentations.
We are a lighting company that specializes in designing and installing lighting solutions for hotels, resorts, and spas. With over 20 years of experience in the hospitality industry, we have the expertise to create lighting designs that enhance ambiance and aesthetics while meeting energy efficiency standards. Our full-service approach handles all aspects of a lighting project from concept development to installation and maintenance.
This document describes a low-fidelity prototype for an emergency aid feature for a Fitbit Charge HR fitness band. The band would have GPS and vibration capabilities and a small screen. It would allow the user to input up to 4 emergency contacts and select whether first responders are automatically contacted. In an emergency, the user would push a dedicated button, select the emergency scenario, and the band would give visual and haptic directions to a safe location while contacting the user's emergency contacts.
This short document promotes the creation of presentations using Haiku Deck, an online presentation tool. It includes two stock photos and suggests that the reader may be inspired to create their own Haiku Deck presentation and share it on SlideShare. The document encourages the reader to get started making a Haiku Deck presentation.
Liberty Savings Federal Credit Union is offering a debt consolidation loan with competitive rates and an extra 2% APR discount if closed by March 31st. Taking out a consolidation loan from Liberty Savings can simplify bill payments by consolidating multiple debts into one lower monthly payment, potentially reducing interest costs. Liberty Savings representatives are available to provide credit counseling and help members understand their credit reports to improve their financial situation.
This document provides information about Oakridge Geoscience, Inc. (OGI), a woman-owned geoscience consulting firm based in Camarillo, California. It describes OGI's experience providing geologic and geotechnical engineering services for infrastructure projects including pipelines, transportation and buildings. Key staff members are introduced, with over 30 years of experience each. Project examples are listed covering areas like water/wastewater facilities, transportation, and site evaluations. Services offered include engineering geology, geotechnical engineering, and construction materials testing.
We were tasked with conducting usability tests on the MWSU admissions page. We were able to get feedback from potential users and identify areas of strength and areas of improvement opportunities.
For this project, we were tasked with conducting a heuristic evaluation of MWSU's website. Each team member compiled their thoughts individually, then we came together and agreed upon the most critical heuristic violations.
We were tasked with creating a prototype for the alz.org website in an effort to improve the completion rate of 14 pre-identified tasks. We started off by interviewing potential users of the site and generated a persona. Then we generated a UX Flowdiagram to demonstrate our persona's potential journey into the site. Then we used Axure to create a mid-fidelity prototype of an improved website concept. Finally, we used the prototype to conduct guerrilla tests to quantify the improvements through the prototype.
The document outlines a UX flowchart created by Freeman, Khalandi, and Khani that maps out user flows and tasks on the Alzheimer's Association website. It includes flows for desktop and mobile, covering common user tasks like finding a local chapter, learning about warning signs of Alzheimer's, types of dementia that cause symptoms, and long-term care options. The team used card sorting, information architecture planning, and user testing to develop a flowchart that maps the key paths users may take to complete common tasks.
Here are a few tips for conducting a successful Community Dialogue:
- Invite a diverse group of community stakeholders - include representatives from schools, afterschool programs, civic groups, businesses, healthcare organizations, etc. The goal is to get input from people who can help you reach and engage underserved audiences.
- Clearly communicate the purpose and goals upfront. Explain that you want an open discussion to understand community needs and how the library can better serve them.
- Ask open-ended questions to spark discussion. For example, "What STEM opportunities do you think are lacking for youth in our community?"
- Actively listen without being defensive. Thank people for their honest feedback.
- Look for opportunities
Unlock Your Data's Potential By Integrating Qualtrics & TableauQualtrics
Find out what happens when you pair the only enterprise customer experience management platform with the world's most powerful data visualisation software.
The new Qualtrics and Tableau Integration allows you to connect your Tableau desktop to Qualtrics so you can gather and view data in real-time. Join Josh Robbins from Qualtrics and Bob Middleton from Tableau for our webinar where you will learn:
The easiest and most efficient way to get Qualtrics data into Tableau for both ad hoc or continual analysis.
Top tips for engaging your target respondents including keeping surveys mobile friendly, utilizing the survey library (not reinventing the wheel), while making questions easy to understand and much more.
Top tips for creating powerful visualisations.
High impact use cases from customers using the connector.
Building capacity for evidence-informed public health decision makingHealth Evidence™
From 2009-2013, Health Evidence partnered with three Ontario health departments on a Canadian Institutes of Health Research (CIHR) “Partnerships for Health System Improvement” grant, studying the impact of tailored, knowledge translation and exchange interventions on evidence-informed decision making in public health. On June 10, 2014, Dr. Maureen Dobbins presented the results from this study and lead an interactive discussion on the implications for this work to a broader public health and knowledge translation audience.
For a recording of this webinar, visit: https://www.youtube.com/watch?v=PbQR-cRgrKI&feature=youtu.be.
This document discusses different methods for conducting retrospectives in Agile software development. It outlines several common retrospective structures including using three questions to gather data on what went well, what didn't go well, and what puzzles the team; using a starfish model to gather data on what to keep doing, start doing, stop doing, and less of; and using a timeline to map out significant, problematic, and good events over the project. The document also discusses setting the stage, gathering data, generating insights, deciding on actions, and closing out the retrospective. The goal of retrospectives is for teams to reflect on how to continuously improve.
This document provides an introduction to Lean UX and UserTesting. It defines UX and Lean UX, discusses the benefits of user testing such as increased revenue and decreased costs, and outlines the UserTesting process including defining objectives, writing tasks, analyzing results, and using metrics and notes. UserTesting allows remote, unmoderated usability testing of digital products through video recordings of testers interacting with designs. The document provides tips for effective user testing through UserTesting.
EffectiveUI's Ari Weissman (Lead Experience Architect) and Lys Maitland (Senior Experience Planner) spoke at Denver Startup Week 2016. Discussion description:
Test early, test often.
It’s a mantra that’s been proven successful time and again when it comes to innovation and design. So why aren’t you doing it? In the start-up world, when everything is moving so quickly, it can be easy to overlook or postpone collecting feedback from real people because of cost, time, or lack of preparation. Don’t let those things stop you. Valid data can be captured cheaply, quickly, and with half-finished products and strategies.
This talk will cover:
What is user testing and why is it important
How to plan for user testing
What are ways to make testing cheaper
What are ways to make testing quicker
How to test with different fidelities of concept and design
How to collect data more frequently
Opportunities for getting the whole team engaged
What to do with the insights/outcomes of research
UX Field Research Toolkit - A Workshop at Big Design - 2017Kelly Moran
Workshop Description:
Looking for practice with in-depth user-experience research methods? You may have read about techniques in the past, but methods must be practiced to be understood. projekt202 has been employing these methodologies with great success since 2003. This workshop is your opportunity to try these tools in a structured environment without pressing deadlines or looming stakeholders. Our experienced research and design professionals will share industry tips and tricks that will help you put theory to practice.
The workshop will be hands-on and interactive; instructional elements will be reinforced with stories of impact to real projects. We will not only cover methods of gathering user data, but the importance of spending time internalizing and analyzing the data through activities such as affinity diagramming. Participants will gain exposure to these important practices in a low-pressure atmosphere and with the guidance of experienced professionals.
Denver Startup Week 2019: Choosing a Direction Learning How to Test Ideas and...BrittanyRubinstein
As part of Denver's 2019 Startup Week, Crownpeak's Director of UX, Ari Weissman and Lys Maitland, Experience Research Manager at a national healthcare organization, presented a joint session on "Choosing a direction: Learning how to test ideas and designs."
Faster Usability Testing in an Agile World presented at Agile2011Carol Smith
The sheer speed of an Agile project can be frightening to even the most experienced UX practitioner. This talk covers testing in short, quick, repetitive sessions, without sacrificing quality. The presentation covers strategies and techniques that can be used for speeding up traditional usability testing, on-site, remote and Rapid Iterative Testing and Evaluation (RITE) methods. Topics from planning through analysis, and ways to provide useful and usable recommendations to the team will be covered.
Collaborative usability test reviews UX Scotland 2019Neil Allison
How to execute a collaborative review of usability testing to facilitate design and development prioritisation consensus. Case studies of how the approach has worked at the University of Edinburgh. Presented at UX Scotland conference 2019
This document summarizes a student's research project on visualizing learning activities in social networks using 3D visualization technology. The student developed a prototype called 3DLAV (3D Learning Activities Visualization) to address the problems of complexity in visualizing social network data and determining how visualization can help learning. An online survey of 24 participants found that over 80% agreed on the need for 3DLAV and that it could make learning more fun and easier. The student concludes that 3DLAV proves the hypothesis and could be further researched as a learning visualization framework, but recognizes weaknesses in not using real data and long-term user testing.
Usability Testing for Survey Research:How to and Best Practicesegeisen
This presentation describes how usability testing of surveys can be used to improve data quality and reduce respondent burden. We describe what kind of surveys can be tested and when. We also provide practice advice for planning, conducting, and analyzing usability tests of surveys.
This document discusses 7 methods for conducting user research: field studies, desirability studies, surveys and polls, usability studies, remote testing, A/B testing, and researching without users. It provides an overview of when each method should be used, how to implement it, and tips/tools for each. The document emphasizes that user research is important because designers are not users, and it should be conducted at different stages of the product development process to inform, optimize, and assess the user experience.
SXSW Workshop on Designing for Behavior Change (2014)Stephen Wendel
Slides from my 2.5 hour SXSW workshop on how to design products to support behavior change among users. The toolkit that accompanies it is up on actiondesign.hellowallet.com.
This document summarizes a forum on demonstrating the impact of volunteering. The agenda includes speakers on why measuring impact is important, planning impact assessments, undertaking impact assessments of volunteering, and challenges and tools for impact assessment. Breakout group discussions are included. Speakers will also discuss the impact of volunteering in care homes and on health and wellbeing based on research. The goal is to help organizations better understand and communicate the impact of volunteering.
This document outlines the agenda and plans for an Epic implementation kickoff meeting. It introduces the project team roles and provides an overview of the project scope, comprehensive work plan with milestones, training approach including e-learning and on-site support, go-live preparation including dress rehearsal, and transition to help desk support after go-live. Next steps emphasized the importance of ongoing communication throughout the implementation process.
No More Excuses: Create a testing plan with no traffic, time, or budgetNTEN
Porter Mason, Steve Daignaeult, and Kira Marchenese gave a presentation on creating a testing plan with no constraints of time, budget, or resources. They discussed overcoming excuses for not testing, prioritizing tests and metrics, making sense of results, and provided next steps for attendees to begin implementing a testing process. The presentation provided tools and advice for starting simple tests immediately and developing a testing calendar and documentation to continuously learn and improve campaigns.
This document discusses the importance of developing a solid data collection plan for research projects. It notes that a well-outlined plan is crucial for communicating goals and methods to other members of a research team. The key components of an effective data collection plan include clearly defining the purpose and scope of data collection, outlining specific collection methods and units of measurement, and validating that the data will support the goals of the research. Following these steps in developing a data collection plan can help ensure a research project's success.
What’s Happening to Our Freshout Engineers?svillach
This presentation describes the results of an exploratory study investigating the work that newly graduated and hired "freshout" engineers perform in the workplace. The study investigates:
* The tasks that freshouts perform successfully and unsuccessfully on the job.
* The consequences of nonperformance.
* The root causes of nonperformance.
This study was funded by the National Science foundation.
Portions of this material are based upon work supported by the National Science Foundation under Grant No. 1037808.
Any opinions, findings, and conclusions or recommendations expressed in this material are those of the author(s) and do not necessarily reflect the views of the National Science Foundation.
This tutorial presentation offers a beginner-friendly guide to using THREADS, Instagram's messaging app. It covers the basics of account setup, privacy settings, and explores the core features such as close friends lists, photo and video sharing, creative tools, and status updates. With practical tips and instructions, this tutorial will empower you to use THREADS effectively and stay connected with your close friends on Instagram in a private and engaging way.
EASY TUTORIAL OF HOW TO USE REMINI BY: FEBLESS HERNANEFebless Hernane
Using Remini is easy and quick for enhancing your photos. Start by downloading the Remini app on your phone. Open the app and sign in or create an account. To improve a photo, tap the "Enhance" button and select the photo you want to edit from your gallery. Remini will automatically enhance the photo, making it clearer and sharper. You can compare the before and after versions by swiping the screen. Once you're happy with the result, tap "Save" to store the enhanced photo in your gallery. Remini makes your photos look amazing with just a few taps!
This tutorial presentation provides a step-by-step guide on how to use Facebook, the popular social media platform. In simple and easy-to-understand language, this presentation explains how to create a Facebook account, connect with friends and family, post updates, share photos and videos, join groups, and manage privacy settings. Whether you're new to Facebook or just need a refresher, this presentation will help you navigate the features and make the most of your Facebook experience.
The Evolution of SEO: Insights from a Leading Digital Marketing AgencyDigital Marketing Lab
Explore the latest trends in Search Engine Optimization (SEO) and discover how modern practices are transforming business visibility. This document delves into the shift from keyword optimization to user intent, highlighting key trends such as voice search optimization, artificial intelligence, mobile-first indexing, and the importance of E-A-T principles. Enhance your online presence with expert insights from Digital Marketing Lab, your partner in maximizing SEO performance.
Your LinkedIn Success Starts Here.......SocioCosmos
In order to make a lasting impression on your sector, SocioCosmos provides customized solutions to improve your LinkedIn profile.
https://www.sociocosmos.com/product-category/linkedin/
Lifecycle of a GME Trader: From Newbie to Diamond Handsmediavestfzllc
Your phone buzzes with a Reddit notification. It's the WallStreetBets forum, a cacophony of memes, rocketship emojis, and fervent discussions about Gamestop (GME) stock. A spark ignites within you - a mix of internet bravado, a rebellious urge to topple the hedge funds (remember Mr. Mayo?), and maybe that one late-night YouTube rabbit hole about tendies. You decide to YOLO (you only live once, right?).
Ramen noodles become your new best friend. Every spare penny gets tossed into the GME piggy bank. You're practically living on fumes, but the dream of a moonshot keeps you going. Your phone becomes an extension of your hand, perpetually glued to the GME ticker. It's a roller-coaster ride - every dip a stomach punch, every rise a shot of adrenaline.
Then, it happens. Roaring Kitty, the forum's resident legend, fires off a cryptic tweet. The apes, as the GME investors call themselves, erupt in a frenzy. Could this be it? Is the rocket finally fueled for another epic launch? You grip your phone tighter, heart pounding in your chest. It's a wild ride, but you're in it for the long haul.
Surat Digital Marketing School is created to offer a complete course that is specifically designed as per the current industry trends. Years of experience has helped us identify and understand the graduate-employee skills gap in the industry. At our school, we keep up with the pace of the industry and impart a holistic education that encompasses all the latest concepts of the Digital world so that our graduates can effortlessly integrate into the assigned roles.
This is the place where you become a Digital Marketing Expert.
Project Serenity is an innovative initiative aimed at transforming urban environments into sustainable, self-sufficient communities. By integrating green architecture, renewable energy, smart technology, sustainable transportation, and urban farming, Project Serenity seeks to minimize the ecological footprint of cities while enhancing residents' quality of life. Key components include energy-efficient buildings, IoT-enabled resource management, electric and autonomous transportation options, green spaces, and robust waste management systems. Emphasizing community engagement and social equity, Project Serenity aspires to serve as a global model for creating eco-friendly, livable urban spaces that harmonize modern conveniences with environmental stewardship.
EASY TUTORIAL OF HOW TO USE G-TEAMS BY: FEBLESS HERNANEFebless Hernane
Using Google Teams (G-Teams) is simple. Start by opening the Google Teams app on your phone or visiting the G-Teams website on your computer. Sign in with your Google account. To join a meeting, click on the link shared by the organizer or enter the meeting code in the "Join a Meeting" section. To start a meeting, click on "New Meeting" and share the link with others. You can use the chat feature to send messages and the video button to turn your camera on or off. G-Teams makes it easy to connect and collaborate with others!
Telegram is a messaging platform that ushers in a new era of communication. Available for Android, Windows, Mac, and Linux, Telegram offers simplicity, privacy, synchronization across devices, speed, and powerful features. It allows users to create their own stickers with a user-friendly editor. With robust encryption, Telegram ensures message security and even offers self-destructing messages. The platform is open, with an API and source code accessible to everyone, making it a secure and social environment where groups can accommodate up to 200,000 members. Customize your messenger experience with Telegram's expressive features.
4. MAIN QUESTION?
• What are some of the
usability issues with Dash?
o Efficiency
o Effectiveness
o Satisfaction
Negar Khalandi Santhosh Kasula Stewart Hutchison
Main Question
Project Details Efficiency Effectiveness Satisfaction Done Right Best Practices Data Collection Conclusion
6. HOW WAS THE
PROJECT CONDUCTED
• Usability test was conducted at Hacetteppe University in Turkey
• Participants were asked to complete 12 tasks
• Using https://dashes.lifedash.com to complete these tasks
• All participants utilized a Windows operated PC
o Mobile device applications are available
o They were not tested during this experiment
Negar Khalandi Santhosh Kasula Stewart Hutchison
Main Question
Project Details
Efficiency Effectiveness Satisfaction Done Right Best Practices Data Collection Conclusion
7. PARTICIPANT
DEMOGRAPHICS
Negar Khalandi Santhosh Kasula Stewart Hutchison
Main Question
Project Details
Efficiency Effectiveness Satisfaction Done Right Best Practices Data Collection Conclusion
10Male
16Female
26 Students
8. PARTICIPANT
DEMOGRAPHICS
Negar Khalandi Santhosh Kasula Stewart Hutchison
Main Question
Project Details
Efficiency Effectiveness Satisfaction Done Right Best Practices Data Collection Conclusion
Average Age
Age Range
9. 12 TASKS INCLUDED:
1. Finding the website dashes.lifedash.com
2. Creating an account
3. Creating a dash
4. Adding 3 photos, 1 video and 1 post about the photos to the dash
5. Adding others to this dash as contributors
6. Making the dash public so followers can also see this dash.
7. Finding some other people and following them
8. Viewing, browsing and exiting Amy’s profile
9. Finding and liking Kevin’s first picture of the “Beach house 2013” dash
10. Update profile picture
11. Modify the “About Me” section
12. Log Out
Negar Khalandi Santhosh Kasula Stewart Hutchison
Main Question
Project Details
Efficiency Effectiveness Satisfaction Done Right Best Practices Data Collection Conclusion
11. HOW WAS EFFICIENCY
MEASURED?
• Efficiency was measured as the time on task
• Experiments were recorded
o Mostly using Morae
o Some using Camtasia
• Videos were reviewed to obtain the time on task
o Bias is introduced due to the lack of audio
o Difficult to truly know the start and end of a task
o Could not determine if any assists were given
Negar Khalandi Santhosh Kasula Stewart Hutchison
Main Question Project Details
Efficiency
Effectiveness Satisfaction Done Right Best Practices Data Collection Conclusion
12. AVERAGE TIME ON TASK
Negar Khalandi Santhosh Kasula Stewart Hutchison
Main Question Project Details
Efficiency
Effectiveness Satisfaction Done Right Best Practices Data Collection Conclusion
28
85
50
148
98
134
69
30
42
50
26
16
0
20
40
60
80
100
120
140
160
1 2 3 4 5 6 7 8 9 10 11 12
AVERAGETIMEONTASK(SECONDS)
TASK #
13. AVERAGE TIME ON TASK
Negar Khalandi Santhosh Kasula Stewart Hutchison
Main Question Project Details
Efficiency
Effectiveness Satisfaction Done Right Best Practices Data Collection Conclusion
28
85
50
148
98
134
69
30
42
50
26
16
0
20
40
60
80
100
120
140
160
1 2 3 4 5 6 7 8 9 10 11 12
AVERAGETIMEONTASK(SECONDS)
TASK #
14. RANGE IN TIME ON
TASK
Negar Khalandi Santhosh Kasula Stewart Hutchison
Main Question Project Details
Efficiency
Effectiveness Satisfaction Done Right Best Practices Data Collection Conclusion
84
210
309
326
220 216
263
100
240
98
56
163
8
21 13
87
30
85
14 8 16 10 10 2
0
50
100
150
200
250
300
350
1 2 3 4 5 6 7 8 9 10 11 12
AVERAGETIMEONTASK(SECONDS)
TASK #
16. HOW WAS EFFECTIVENESS
MEASURED
Effectiveness was measured by counting the number of errors on task
Negar Khalandi Santhosh Kasula Stewart Hutchison
Main Question Project Details Efficiency
Effectiveness
Satisfaction Done Right Best Practices Data Collection Conclusion
Backtrack Error
17. DIFFICULTIES IN
COUNTING ERRORS
Negar Khalandi Santhosh Kasula Stewart Hutchison
Main Question Project Details Efficiency
Effectiveness
Satisfaction Done Right Best Practices Data Collection Conclusion
Backtrack Error
Errors counted by reviewing videos of experiments
When a task was completed correctly, then it was considered as a completion
Difficult to definitively know when a task was completed correctly – EX: Task 6
18. EXAMPLES: TASK 6
Negar Khalandi Santhosh Kasula Stewart Hutchison
Main Question Project Details Efficiency
Effectiveness
Satisfaction Done Right Best Practices Data Collection Conclusion
You’d also like to share this dash with other people who are following you but not
make them contributors. Make this dash public so they can also see this dash.
19. EXAMPLES: TASK 5
Negar Khalandi Santhosh Kasula Stewart Hutchison
Main Question Project Details Efficiency
Effectiveness
Satisfaction Done Right Best Practices Data Collection Conclusion
You’d like to add others to this dash who were at the experiment with you,
find Vera USF and Jo USF and add them to this dash as Contributors.
Only
Completed
task 5
20. EXAMPLES: TASK 5
Negar Khalandi Santhosh Kasula Stewart Hutchison
Main Question Project Details Efficiency
Effectiveness
Satisfaction Done Right Best Practices Data Collection Conclusion
21. EXAMPLES: TASK 5
Negar Khalandi Santhosh Kasula Stewart Hutchison
Main Question Project Details Efficiency
Effectiveness
Satisfaction Done Right Best Practices Data Collection Conclusion
22. EXAMPLES: TASK 5
Negar Khalandi Santhosh Kasula Stewart Hutchison
Main Question Project Details Efficiency
Effectiveness
Satisfaction Done Right Best Practices Data Collection Conclusion
23. HOW WAS EFFECTIVENESS
MEASURED
Negar Khalandi Santhosh Kasula Stewart Hutchison
Main Question Project Details Efficiency
Effectiveness
Satisfaction Done Right Best Practices Data Collection Conclusion
24. EXAMPLES: TASK 5
Negar Khalandi Santhosh Kasula Stewart Hutchison
Main Question Project Details Efficiency
Effectiveness
Satisfaction Done Right Best Practices Data Collection Conclusion
25. NUMBER OF ERRORS
PER TASK
Negar Khalandi Santhosh Kasula Stewart Hutchison
Main Question Project Details Efficiency
Effectiveness
Satisfaction Done Right Best Practices Data Collection Conclusion
12
45
12
43
40
0
17
10
13
19
16
4
0
5
10
15
20
25
30
35
40
45
50
1 2 3 4 5 6 7 8 9 10 11 12
TotalNumberofErrors
Task #
26. NUMBER OF ERRORS
PER TASK
Negar Khalandi Santhosh Kasula Stewart Hutchison
Main Question Project Details Efficiency
Effectiveness
Satisfaction Done Right Best Practices Data Collection Conclusion
12
45
12
43
40
0
17
10
13
19
16
4
0
5
10
15
20
25
30
35
40
45
50
1 2 3 4 5 6 7 8 9 10 11 12
TotalNumberofErrors
Task #
29. MEASURING
SATISFACTION: TAM
Negar Khalandi Santhosh Kasula Stewart Hutchison
Main Question Project Details Efficiency Effectiveness
Satisfaction
Done Right Best Practices Data Collection Conclusion
High SNS
Diet
High rate
of
Usefulness
Satisfied
User
Low SNS
Diet
High rate
of Ease
of Use
Satisfied
User
30. MEASURING
SATISFACTION
Negar Khalandi Santhosh Kasula Stewart Hutchison
Main Question Project Details Efficiency Effectiveness
Satisfaction
Done Right Best Practices Data Collection Conclusion
High SNS
Diet
High rate
of
Usefulness
Satisfied
User
Low SNS
Diet
High rate
of Ease
of Use
Satisfied
User
31. UNDERSTANDING SNS
DIET
Negar Khalandi Santhosh Kasula Stewart Hutchison
Main Question Project Details Efficiency Effectiveness
Satisfaction
Done Right Best Practices Data Collection Conclusion
High SNS
Diet
High rate
of
Usefulness
Satisfied
User
Low SNS
Diet
High rate
of Ease of
Use
Satisfied
User
Frequency of SNS use
• Hourly, every few hours, daily, etc.
Duration of use
• Age of first internet use
Amount of use
• Number of apps installed
32. MEASURING
SATISFACTION
Negar Khalandi Santhosh Kasula Stewart Hutchison
Main Question Project Details Efficiency Effectiveness
Satisfaction
Done Right Best Practices Data Collection Conclusion
High SNS
Diet
High rate
of
Usefulness
Satisfied
User
Low SNS
Diet
High rate
of Ease
of Use
Satisfied
User
33. MEASURING
USEFULNESS
Negar Khalandi Santhosh Kasula Stewart Hutchison
Main Question Project Details Efficiency Effectiveness
Satisfaction
Done Right Best Practices Data Collection Conclusion
High
SNS Diet
High rate
of
Usefulness
Satisfied
User
Friends are
on it
Friends are not
on it
Useful
Not Useful
Not Useful
34. MEASURING EASE OF
USE
Negar Khalandi Santhosh Kasula Stewart Hutchison
Main Question Project Details Efficiency Effectiveness
Satisfaction
Done Right Best Practices Data Collection Conclusion
Low SNS
Diet
High rate
of Ease of
Use
Satisfied
User
Based on a satisfaction rating of the ease with which the
participant could do the tasks
Participants rated the difficulty of tasks on a 1 – 7 scale
1 = easiest and 7 = most difficult
35. MEASURING
SATISFACTION
Negar Khalandi Santhosh Kasula Stewart Hutchison
Main Question Project Details Efficiency Effectiveness
Satisfaction
Done Right Best Practices Data Collection Conclusion
High SNS
Diet
High rate
of
Usefulness
Satisfied
User
Low SNS
Diet
High rate
of Ease
of Use
Satisfied
User
36. SATISFIED USERS?
Negar Khalandi Santhosh Kasula Stewart Hutchison
Main Question Project Details Efficiency Effectiveness
Satisfaction
Done Right Best Practices Data Collection Conclusion
Satisfied
34%
Not Satisfied
8%
Unknown
58%
37. SATISFIED USERS? YES!
Negar Khalandi Santhosh Kasula Stewart Hutchison
Main Question Project Details Efficiency Effectiveness
Satisfaction
Done Right Best Practices Data Collection Conclusion
Satisfied
34%
Not
Satisfied
8%
Unknown
58%
Satisfaction conclusion drawn from:
1. Technology Acceptance Model
• 2 High SNS diet users
• 10 Low SNS diet users
• 14 uncategorized
2. User feedback
• 21 out of 26 participants said they would
use Dash to share photos, videos and
status
38. MOST FRUSTRATING
Negar Khalandi Santhosh Kasula Stewart Hutchison
Main Question Project Details Efficiency Effectiveness
Satisfaction
Done Right Best Practices Data Collection Conclusion
22%
41%
7%
7%
7%
4%
4%
4%
4%
Making dash public
Adding contributor to the dash
Searching for people
Internet connection
Updating profile
Creating an account
Creating a Dash
Case sensitivity when finding users
None
39. MOST FRUSTRATING
Negar Khalandi Santhosh Kasula Stewart Hutchison
Main Question Project Details Efficiency Effectiveness
Satisfaction
Done Right Best Practices Data Collection Conclusion
22%
41%
7%
7%
7%
4%
4%
4%
4%
Making dash public
Adding contributor to the dash
Searching for people
Internet connection
Updating profile
Creating an account
Creating a Dash
Case sensitivity when finding users
None
41. WHAT DID THE
DEVELOPER DO RIGHT?
• Dash is a more secure way of sharing pictures, videos
and status
• Simplistic design of pages
• Users found it very easy to create a Dash
o The Plus sign is very intuitive
o User can limit the level of contribution to their dashes
• Intent of the SNS was translated to the users
o 21 out of the 26 users said they would use Dash to share photos, videos,
and socialize
Negar Khalandi Santhosh Kasula Stewart Hutchison
Main Question Project Details Efficiency Effectiveness Satisfaction
Done Right
Best Practices Data Collection Conclusion
43. WE LEARNED
• The importance of audio to determine:
o Stop start of a task
o Whether users were getting assists
o Confusion during a task
• Technology Assistance Model
o Measuring usefulness
o Measuring ease of use
o SNS Diet
o How these contribute to understanding a user’s satisfaction of an SNS
Negar Khalandi Santhosh Kasula Stewart Hutchison
Main Question Project Details Efficiency Effectiveness Satisfaction Done Right
Best Practices
Data Collection Conclusion
44. SURPRISED
• By the amount of work involved in coding video
o A total of 26 videos
o Ranging from 10 to 18 minutes in length
• The amount of variables that can be pulled from the
surveys
Negar Khalandi Santhosh Kasula Stewart Hutchison
Main Question Project Details Efficiency Effectiveness Satisfaction Done Right
Best Practices
Data Collection Conclusion
45. WHAT WORKED?
DIDN’T WORK?
Worked:
• The correlation between high-low SNS diet and satisfaction
• The site functioned as it was intended to (for the most part)
• Team dynamic worked well
Didn’t Work:
• We would have liked to see the results of a SUS questionnaire
• The language barrier was difficult to work around
o Many assumptions were made due to this fact
Negar Khalandi Santhosh Kasula Stewart Hutchison
Main Question Project Details Efficiency Effectiveness Satisfaction Done Right
Best Practices
Data Collection Conclusion
47. DATA COLLECTION
What we learned about data collection:
• Agreeing on metrics before scoring is critical
• Variations in data interpretation
• Splitting up video reviews resulted in saving time
What we would do differently:
• Determining an agreed upon set of tasks before reviewing videos
• Collect the data ourselves
• Evaluating the videos in more detail
• Test more high SNS diet users
Negar Khalandi Santhosh Kasula Stewart Hutchison
Main Question Project Details Efficiency Effectiveness Satisfaction Done Right Best Practices Data Collection Conclusion
49. CONCLUSION
Biggest Problem:
• The unique aspect of this site is the user’s level of security controls
o However, the interface for setting contacts as contributors was ineffective
o Only 12% of the users were able to complete this task
Negar Khalandi Santhosh Kasula Stewart Hutchison
Main Question Project Details Efficiency Effectiveness Satisfaction Done Right Best Practices Data Collection
Conclusion
50. CONCLUSION
Other Problem:
• Many of the users compared it to other SNS
o 16 out of the 26 users
• Notify users that multiple images can be uploaded at once
o Many users uploaded the photos one at a time
o Contributed to the longer time on task 4
o Can lead to a more efficient experience
• Searching for friends was not intuitive
Negar Khalandi Santhosh Kasula Stewart Hutchison
Main Question Project Details Efficiency Effectiveness Satisfaction Done Right Best Practices Data Collection
Conclusion
51. SEARCHING FOR
FRIENDS
Searching for friends was not intuitive
Negar Khalandi Santhosh Kasula Stewart Hutchison
Main Question Project Details Efficiency Effectiveness Satisfaction Done Right Best Practices Data Collection
Conclusion