
Download to read offline
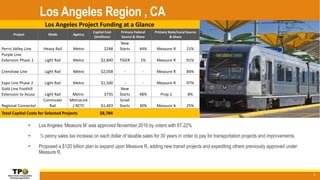

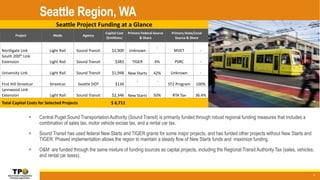
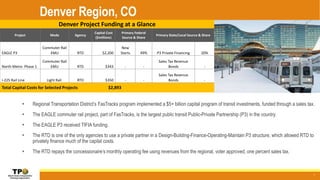
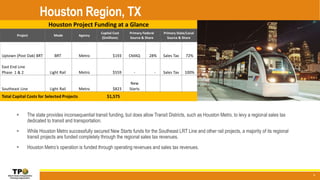
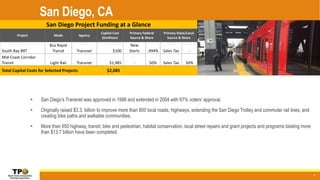
This document profiles regional transportation funding in several major US cities, including Los Angeles, San Francisco, Seattle, Denver, Houston, and San Diego. It provides details on specific transportation projects, capital costs, and primary funding sources in each region, which commonly include federal grants, regional sales taxes, and state/local funding. Regions rely on diverse funding sources including federal New Starts grants, regional measures approving sales tax increases, and state/local bonds and appropriations.


![Transit policy utsc presentation june 24 [compatibility mode]](https://cdn.slidesharecdn.com/ss_thumbnails/transitpolicyutscpresentation-june24compatibilitymode-150908121123-lva1-app6892-thumbnail.jpg?width=640&height=640&fit=bounds)


