Download to read offline
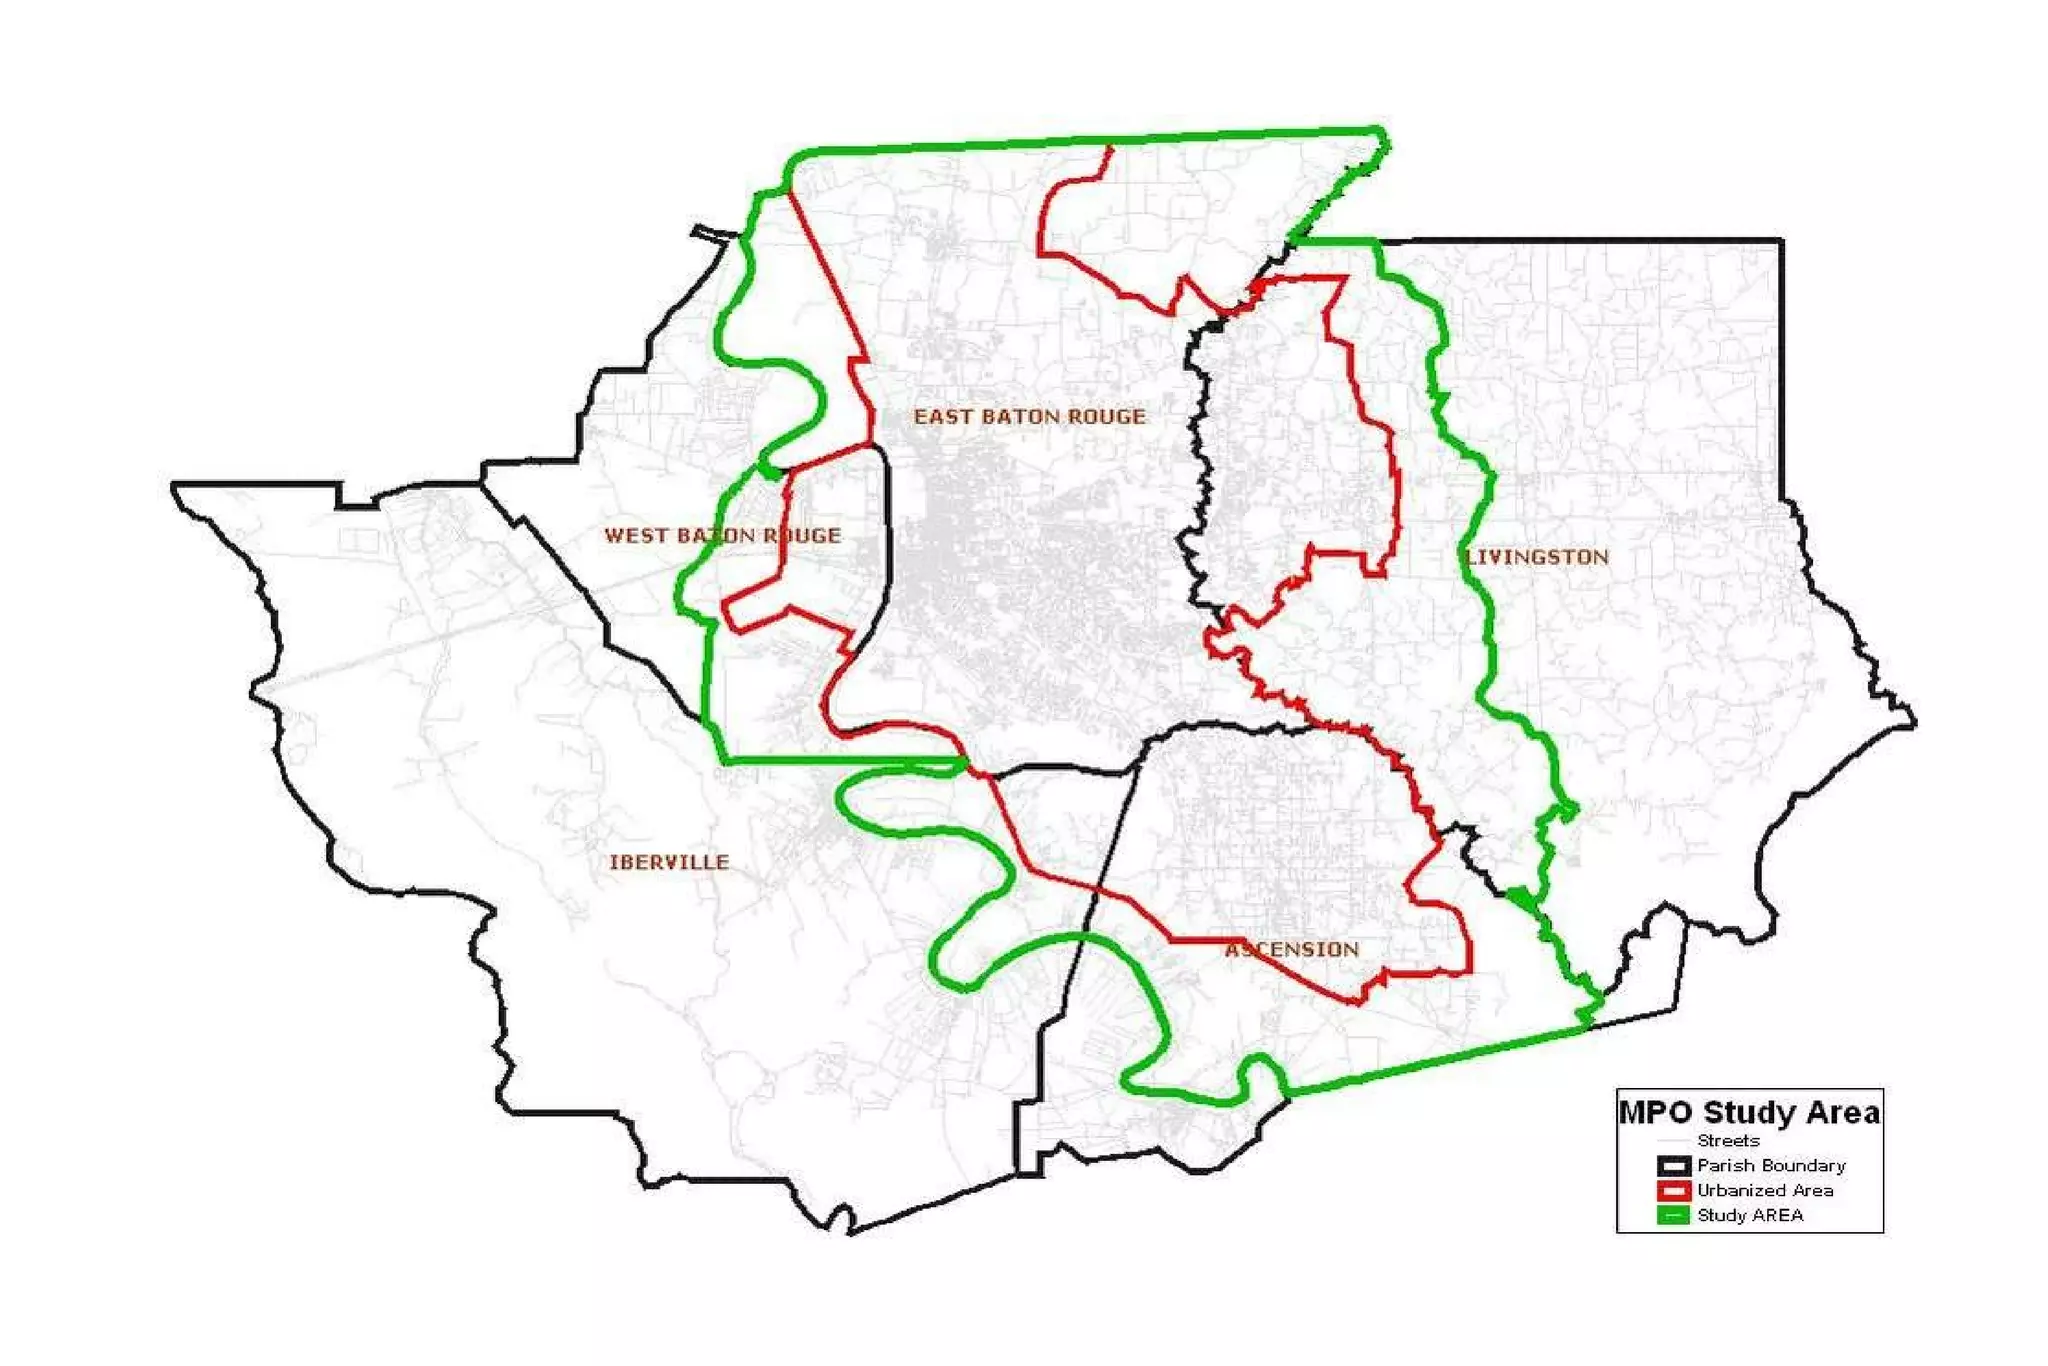
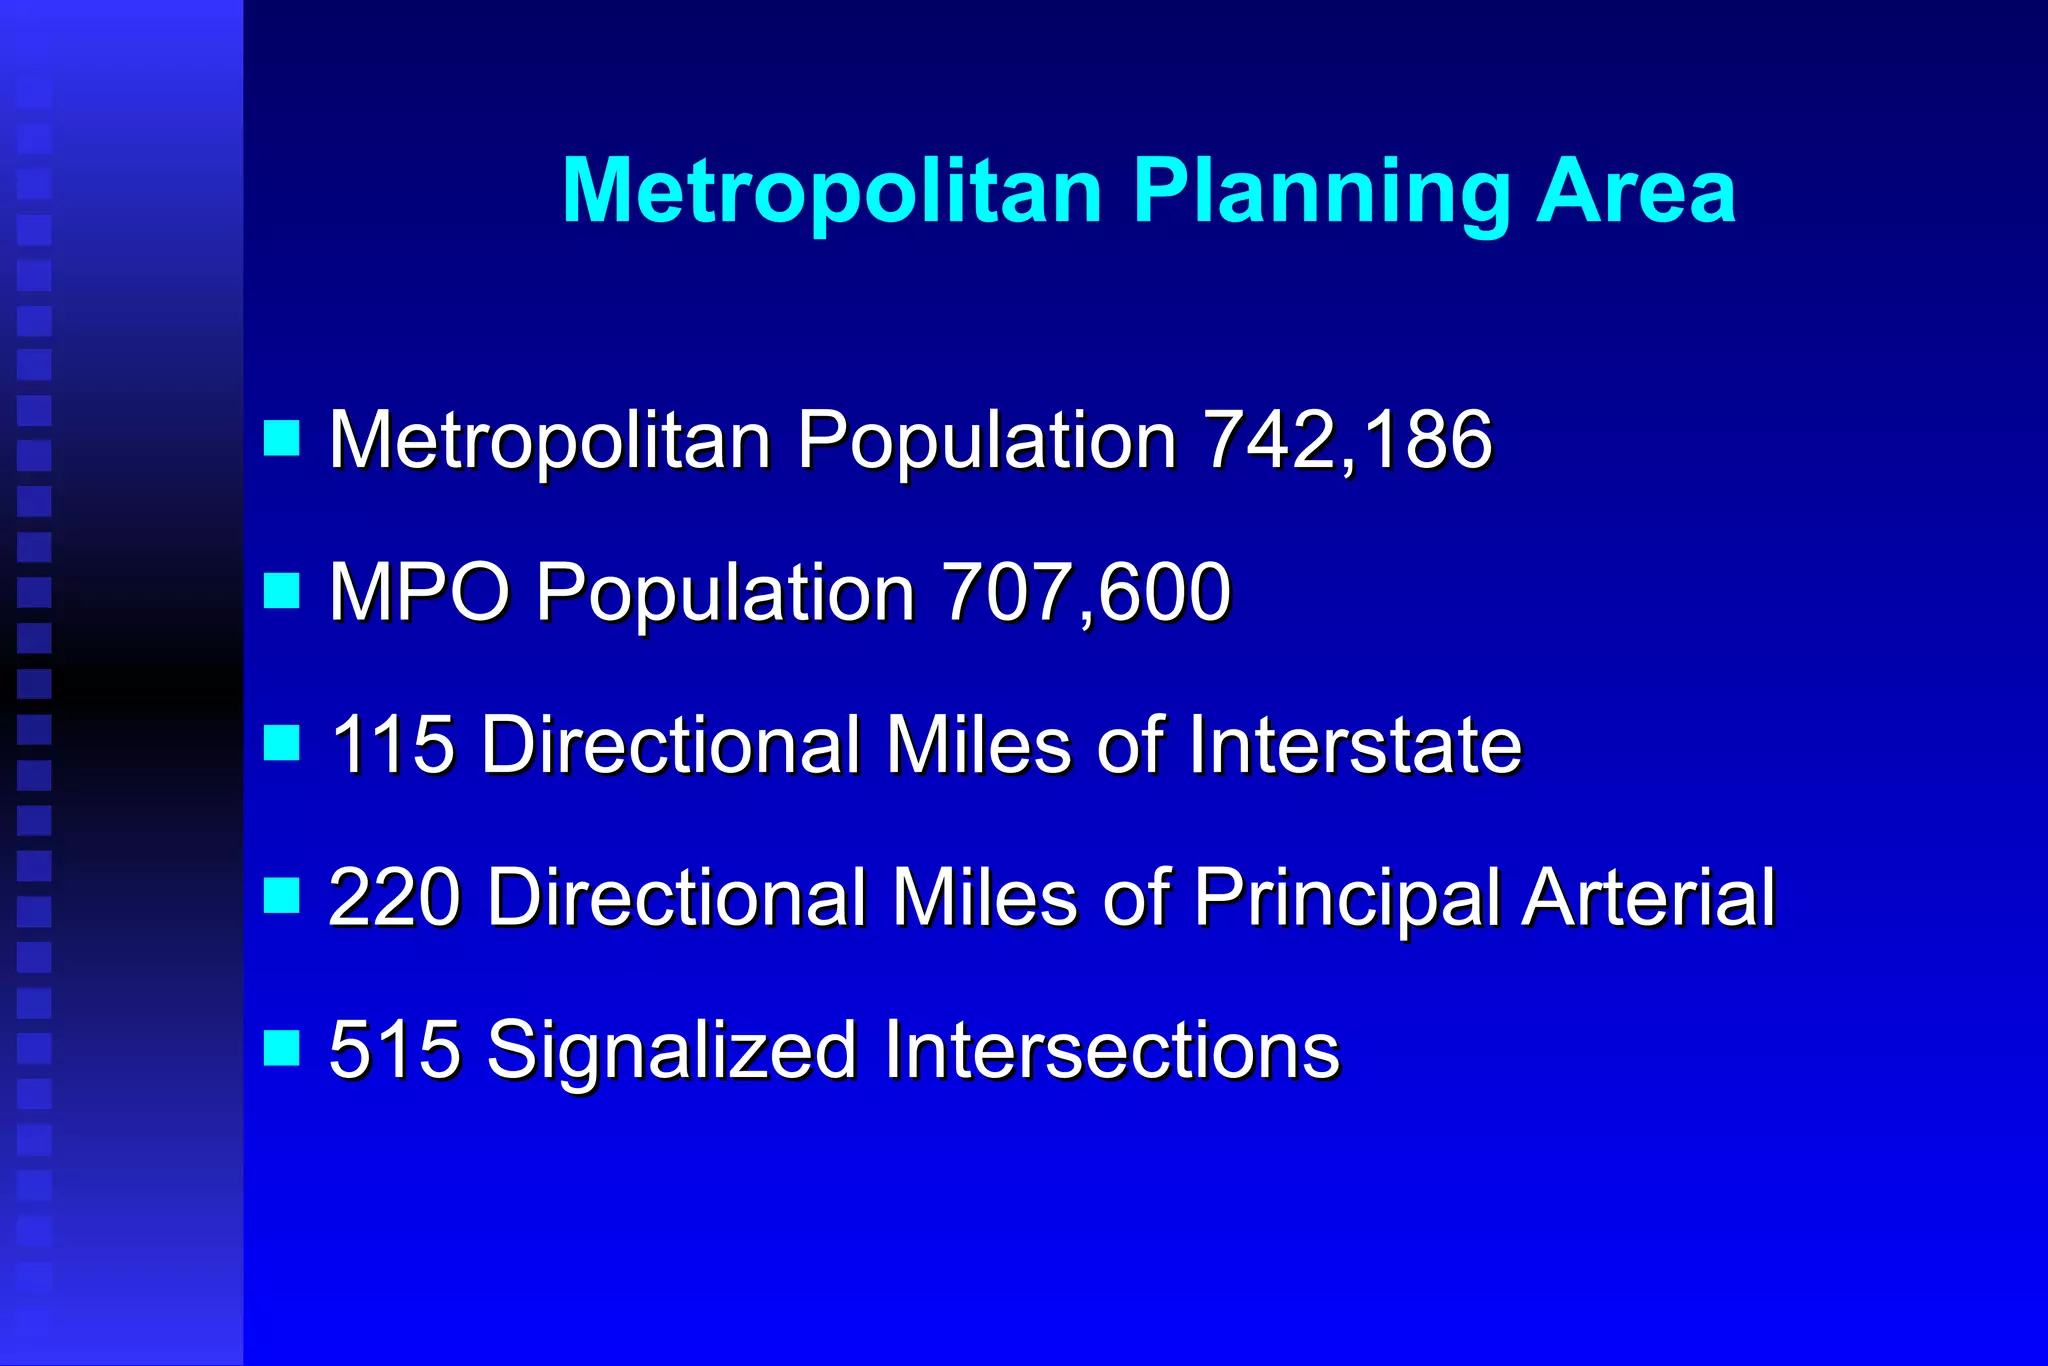
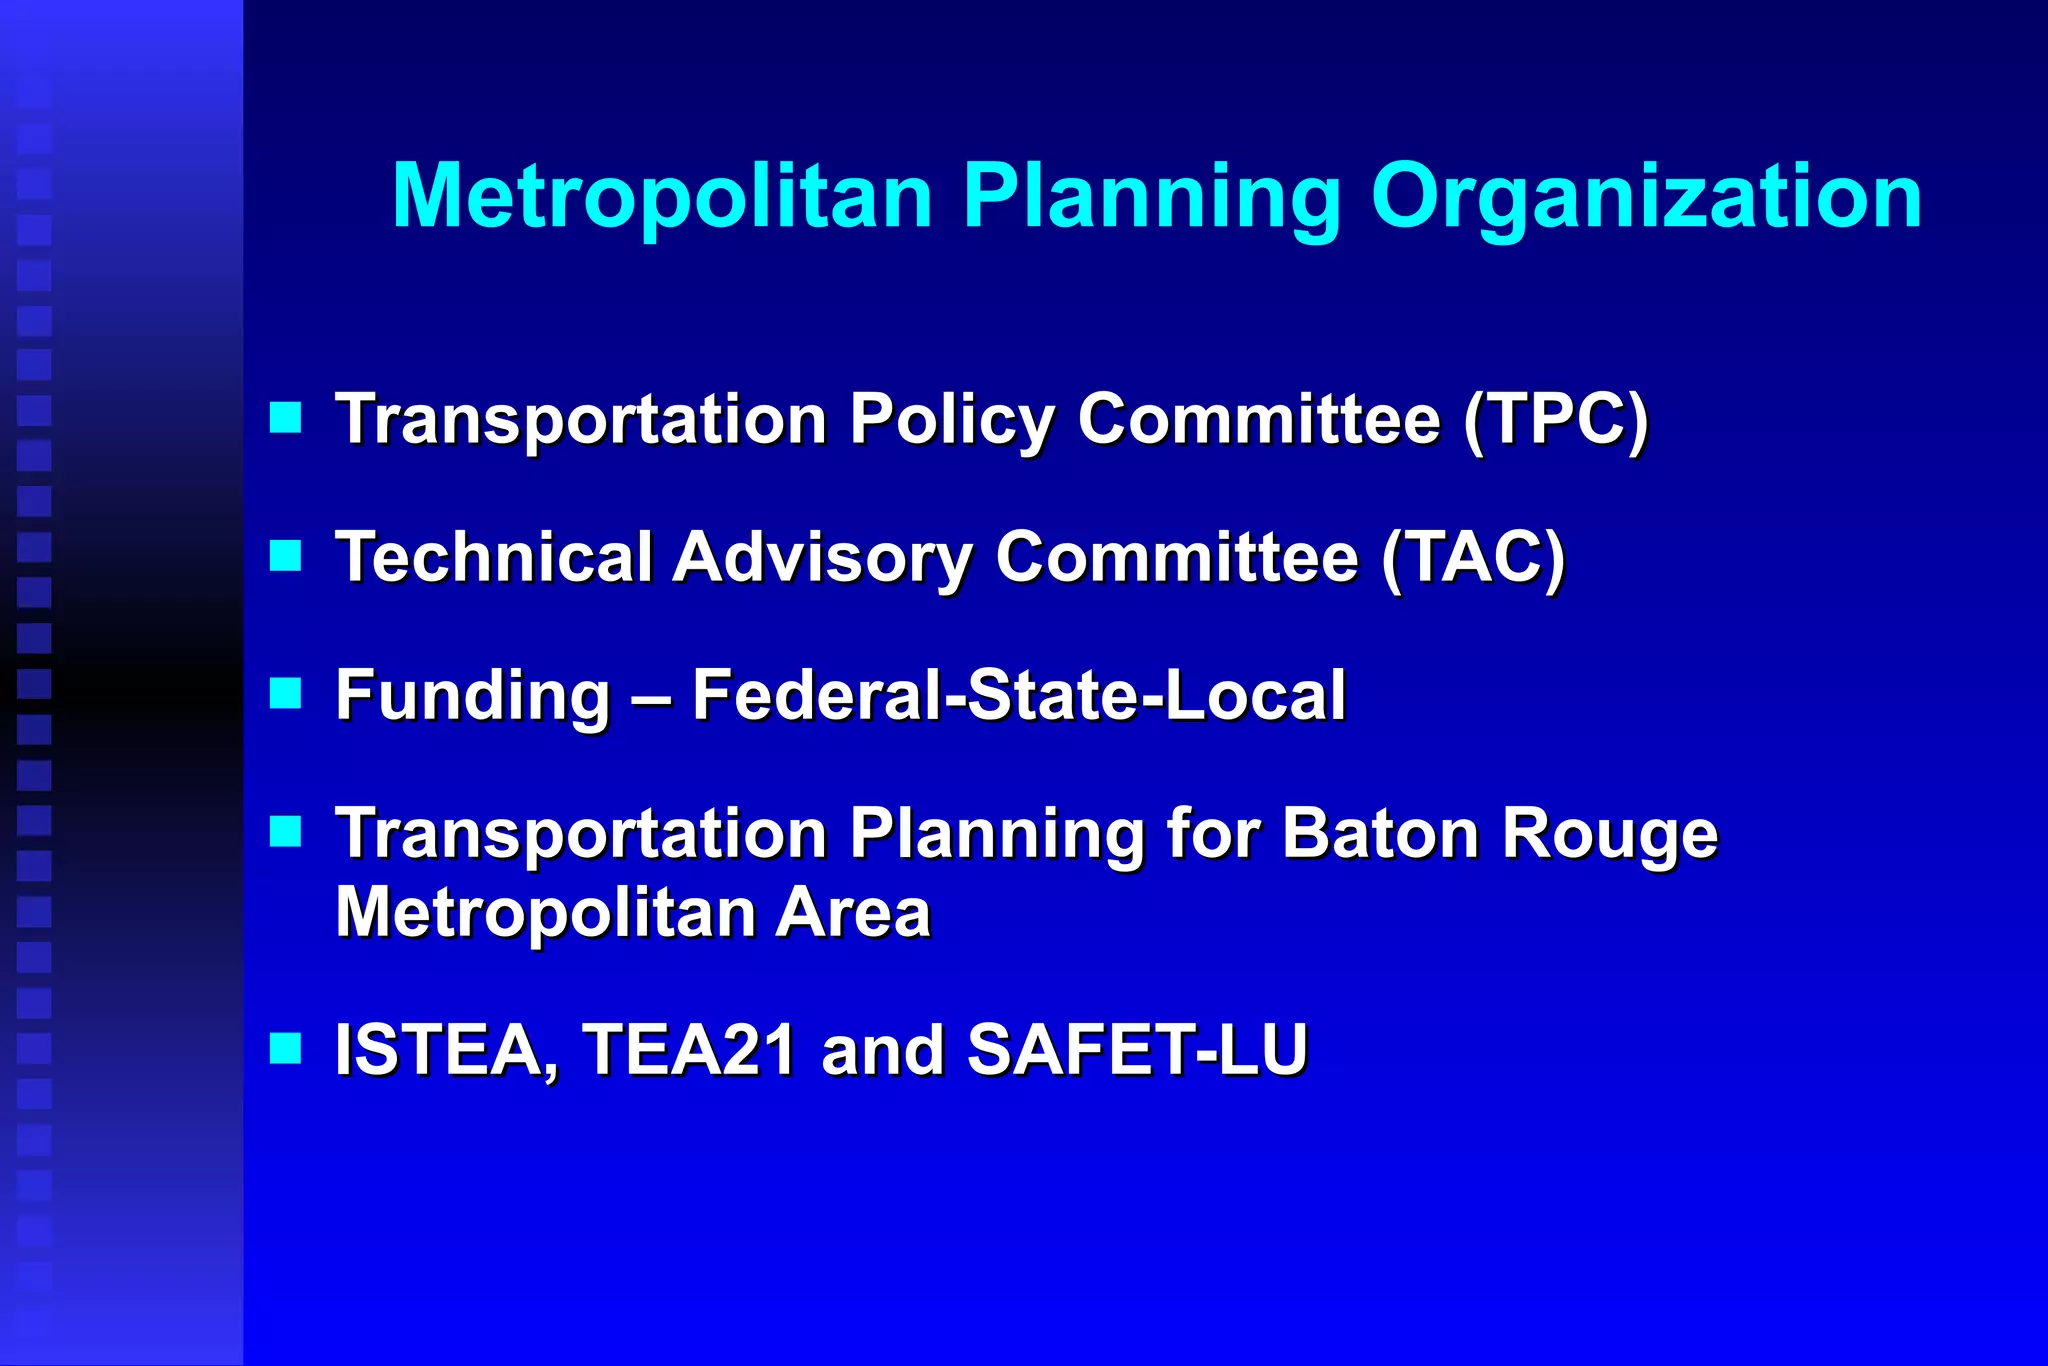
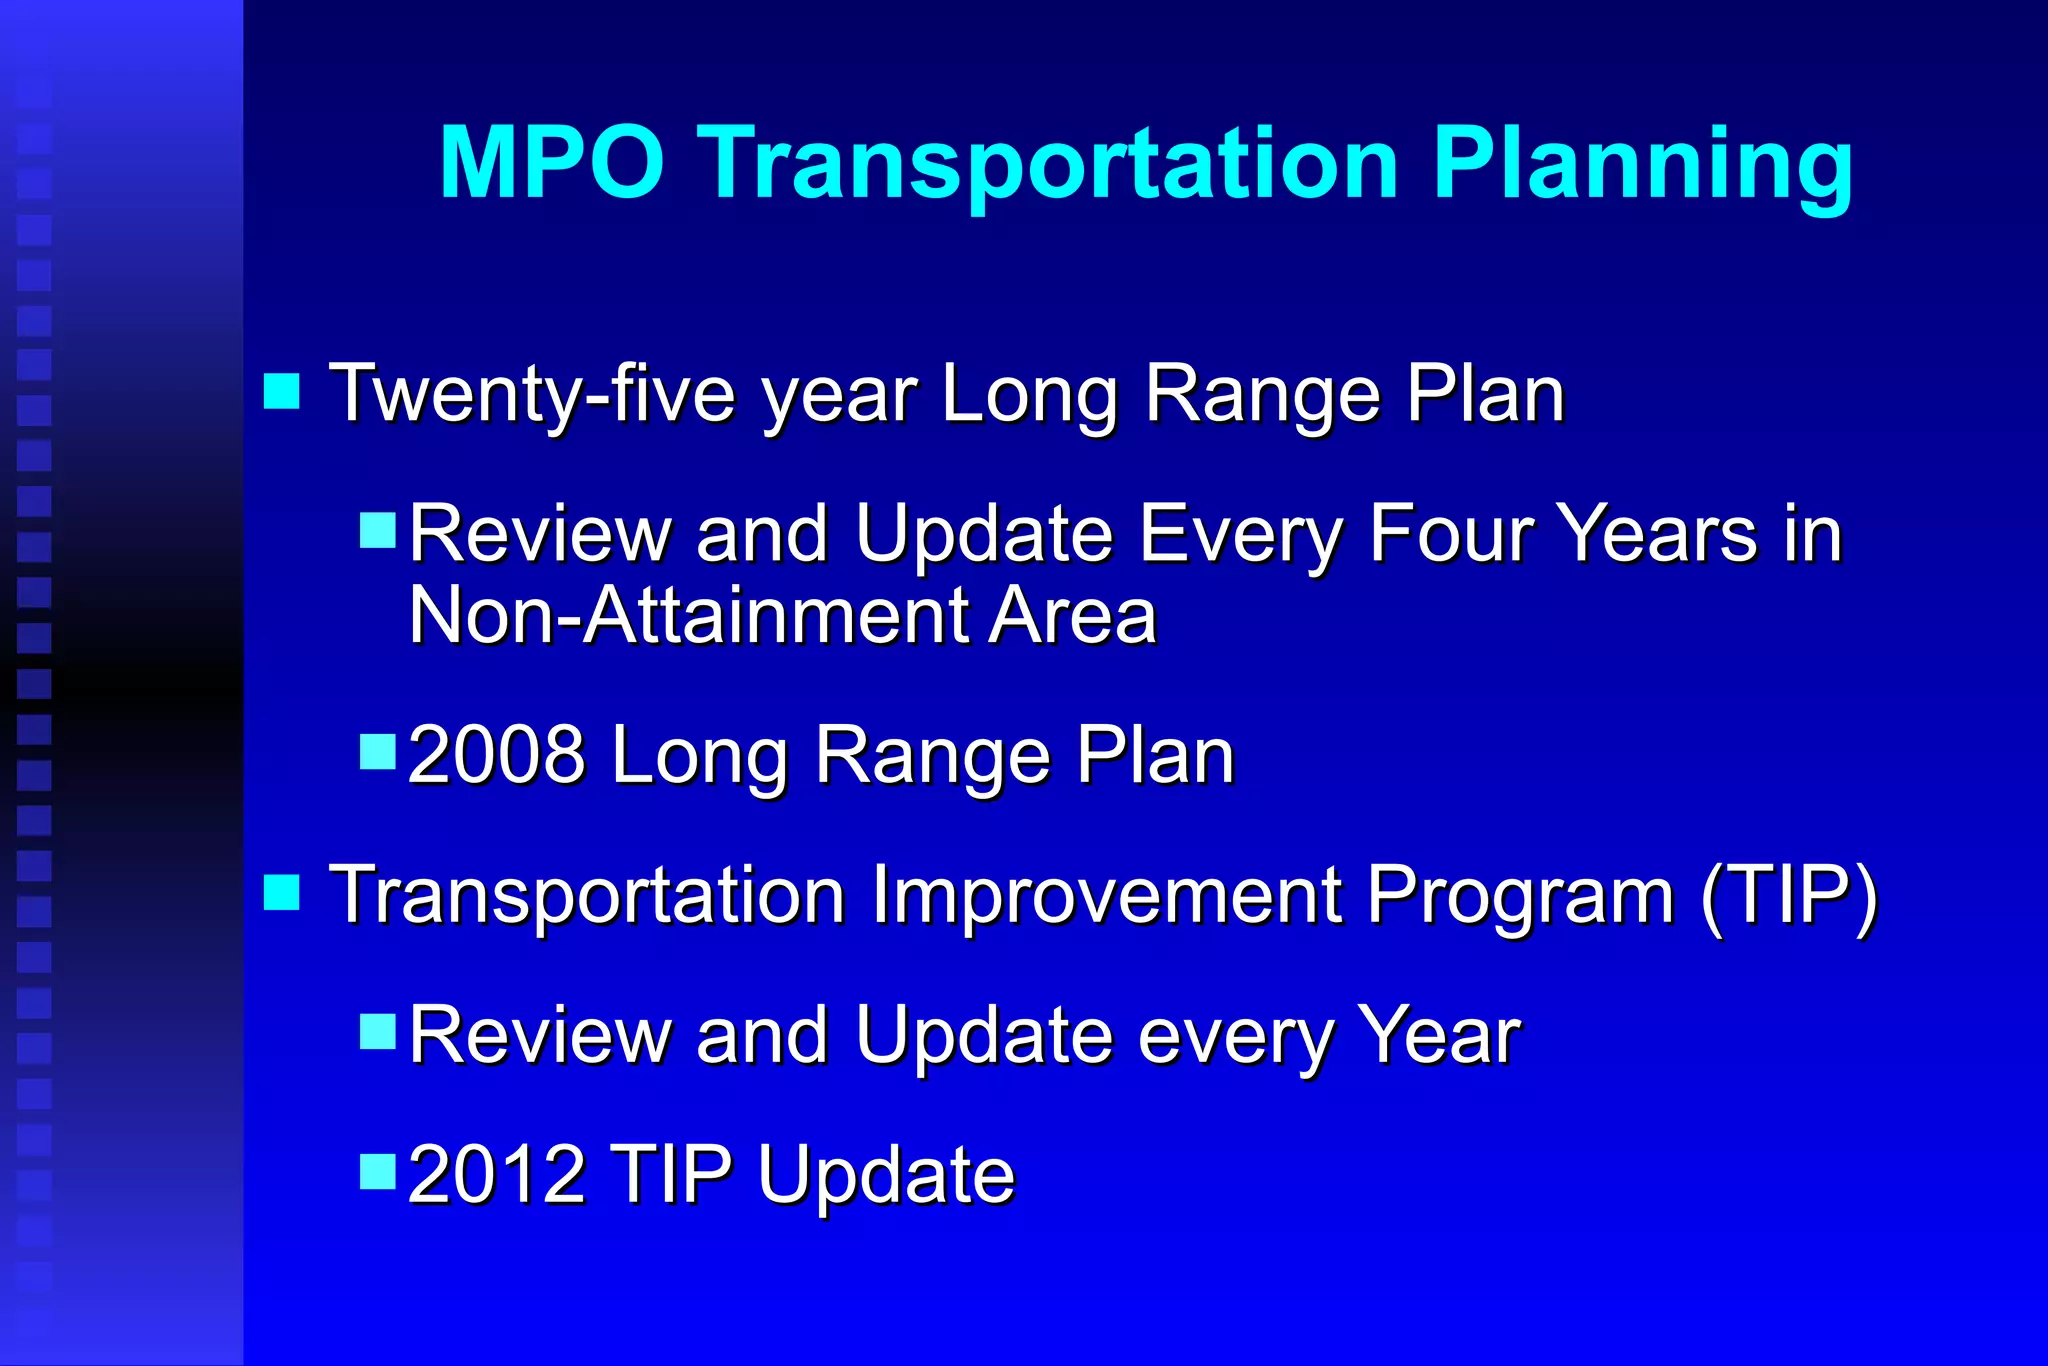
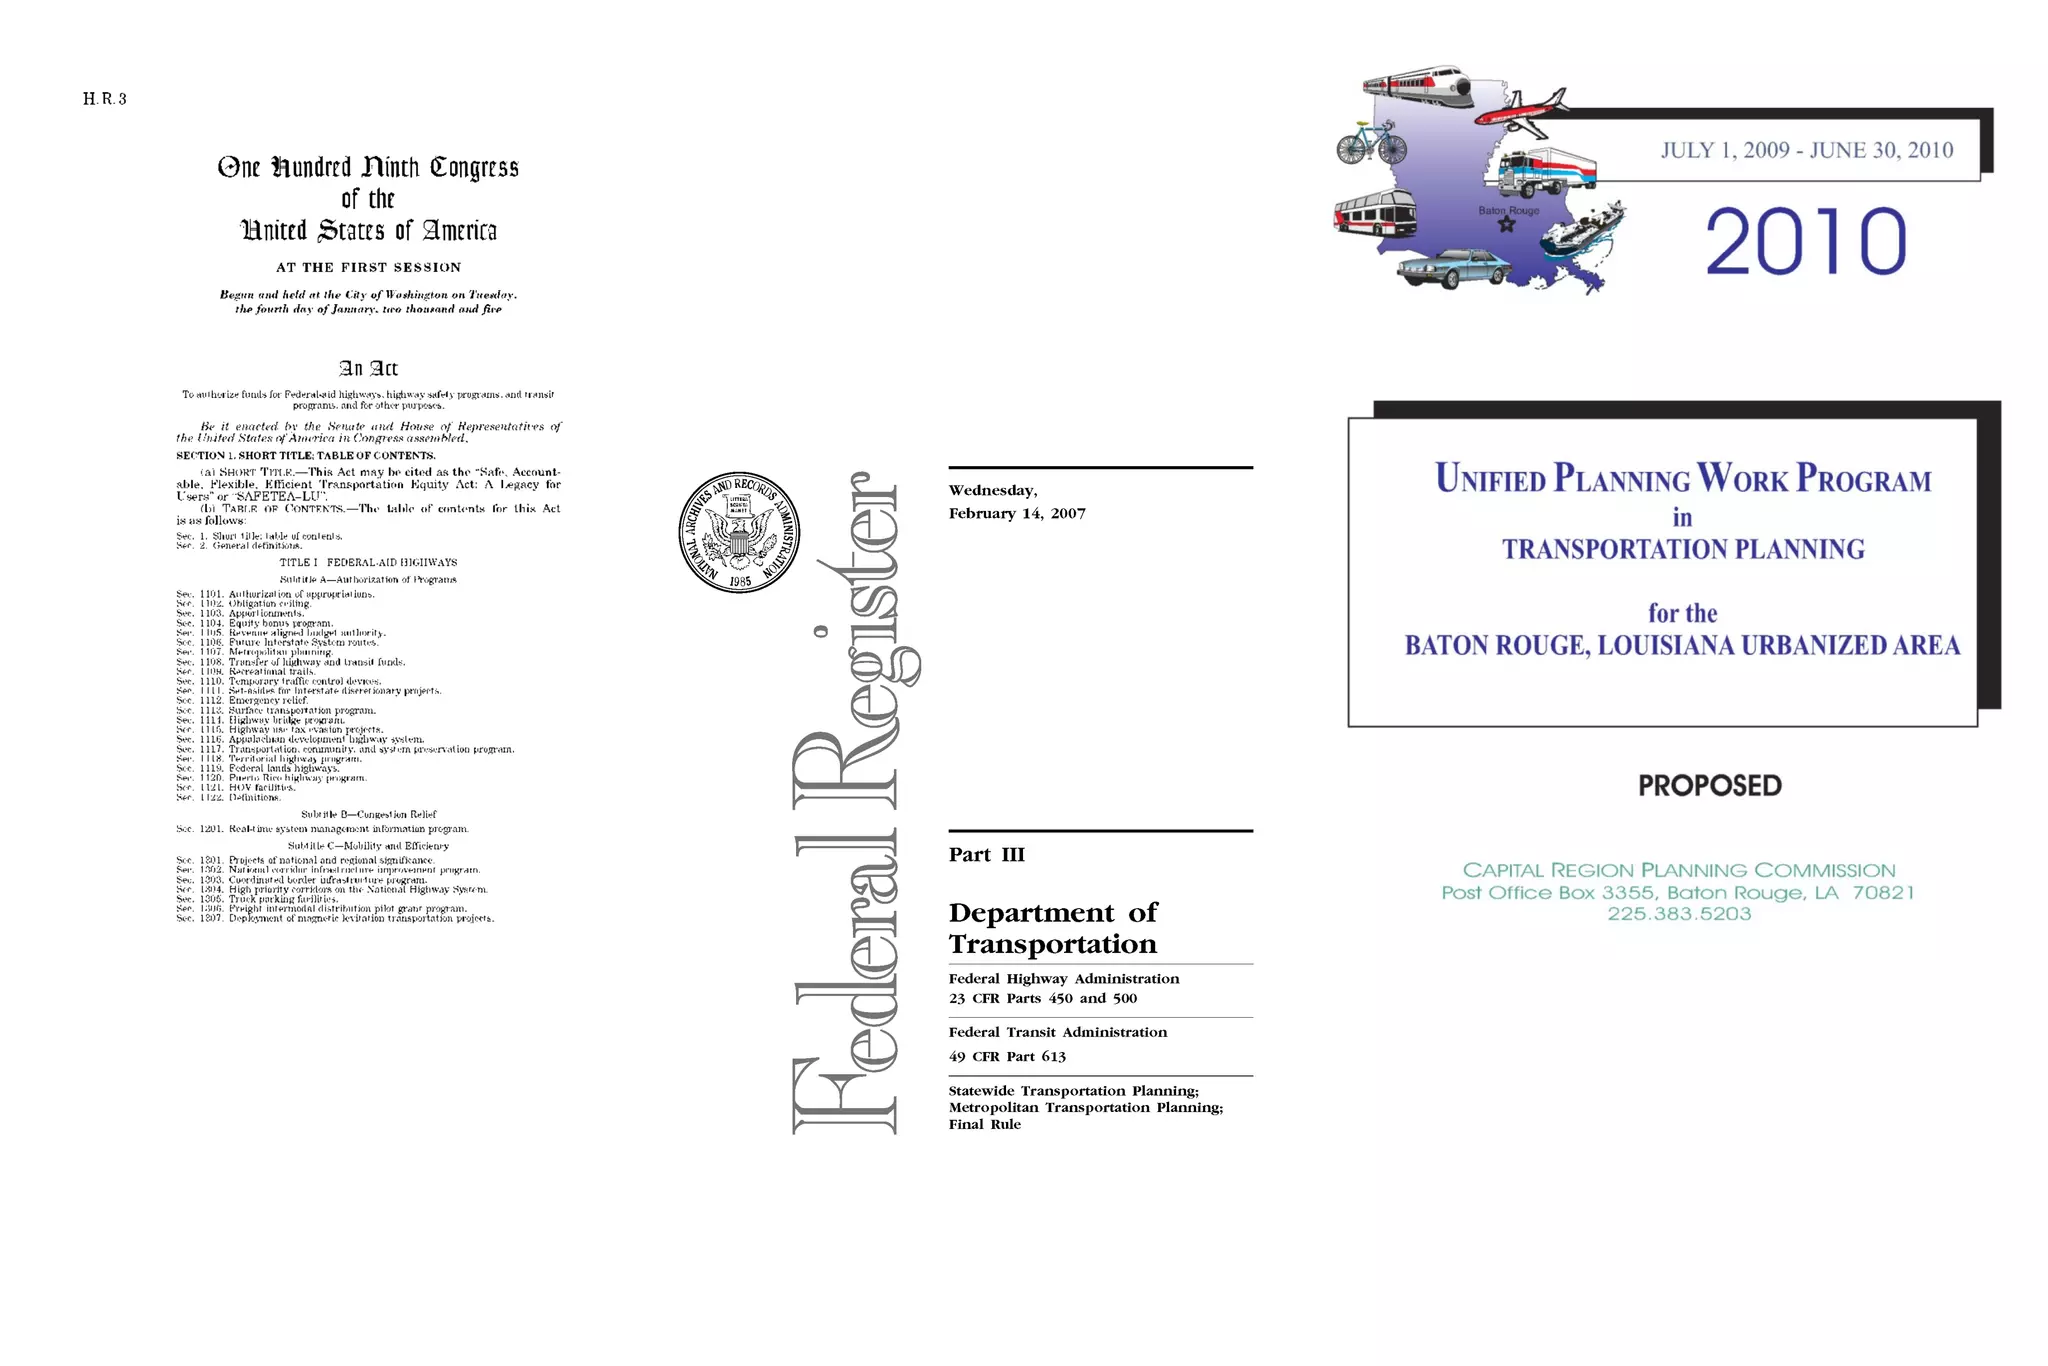
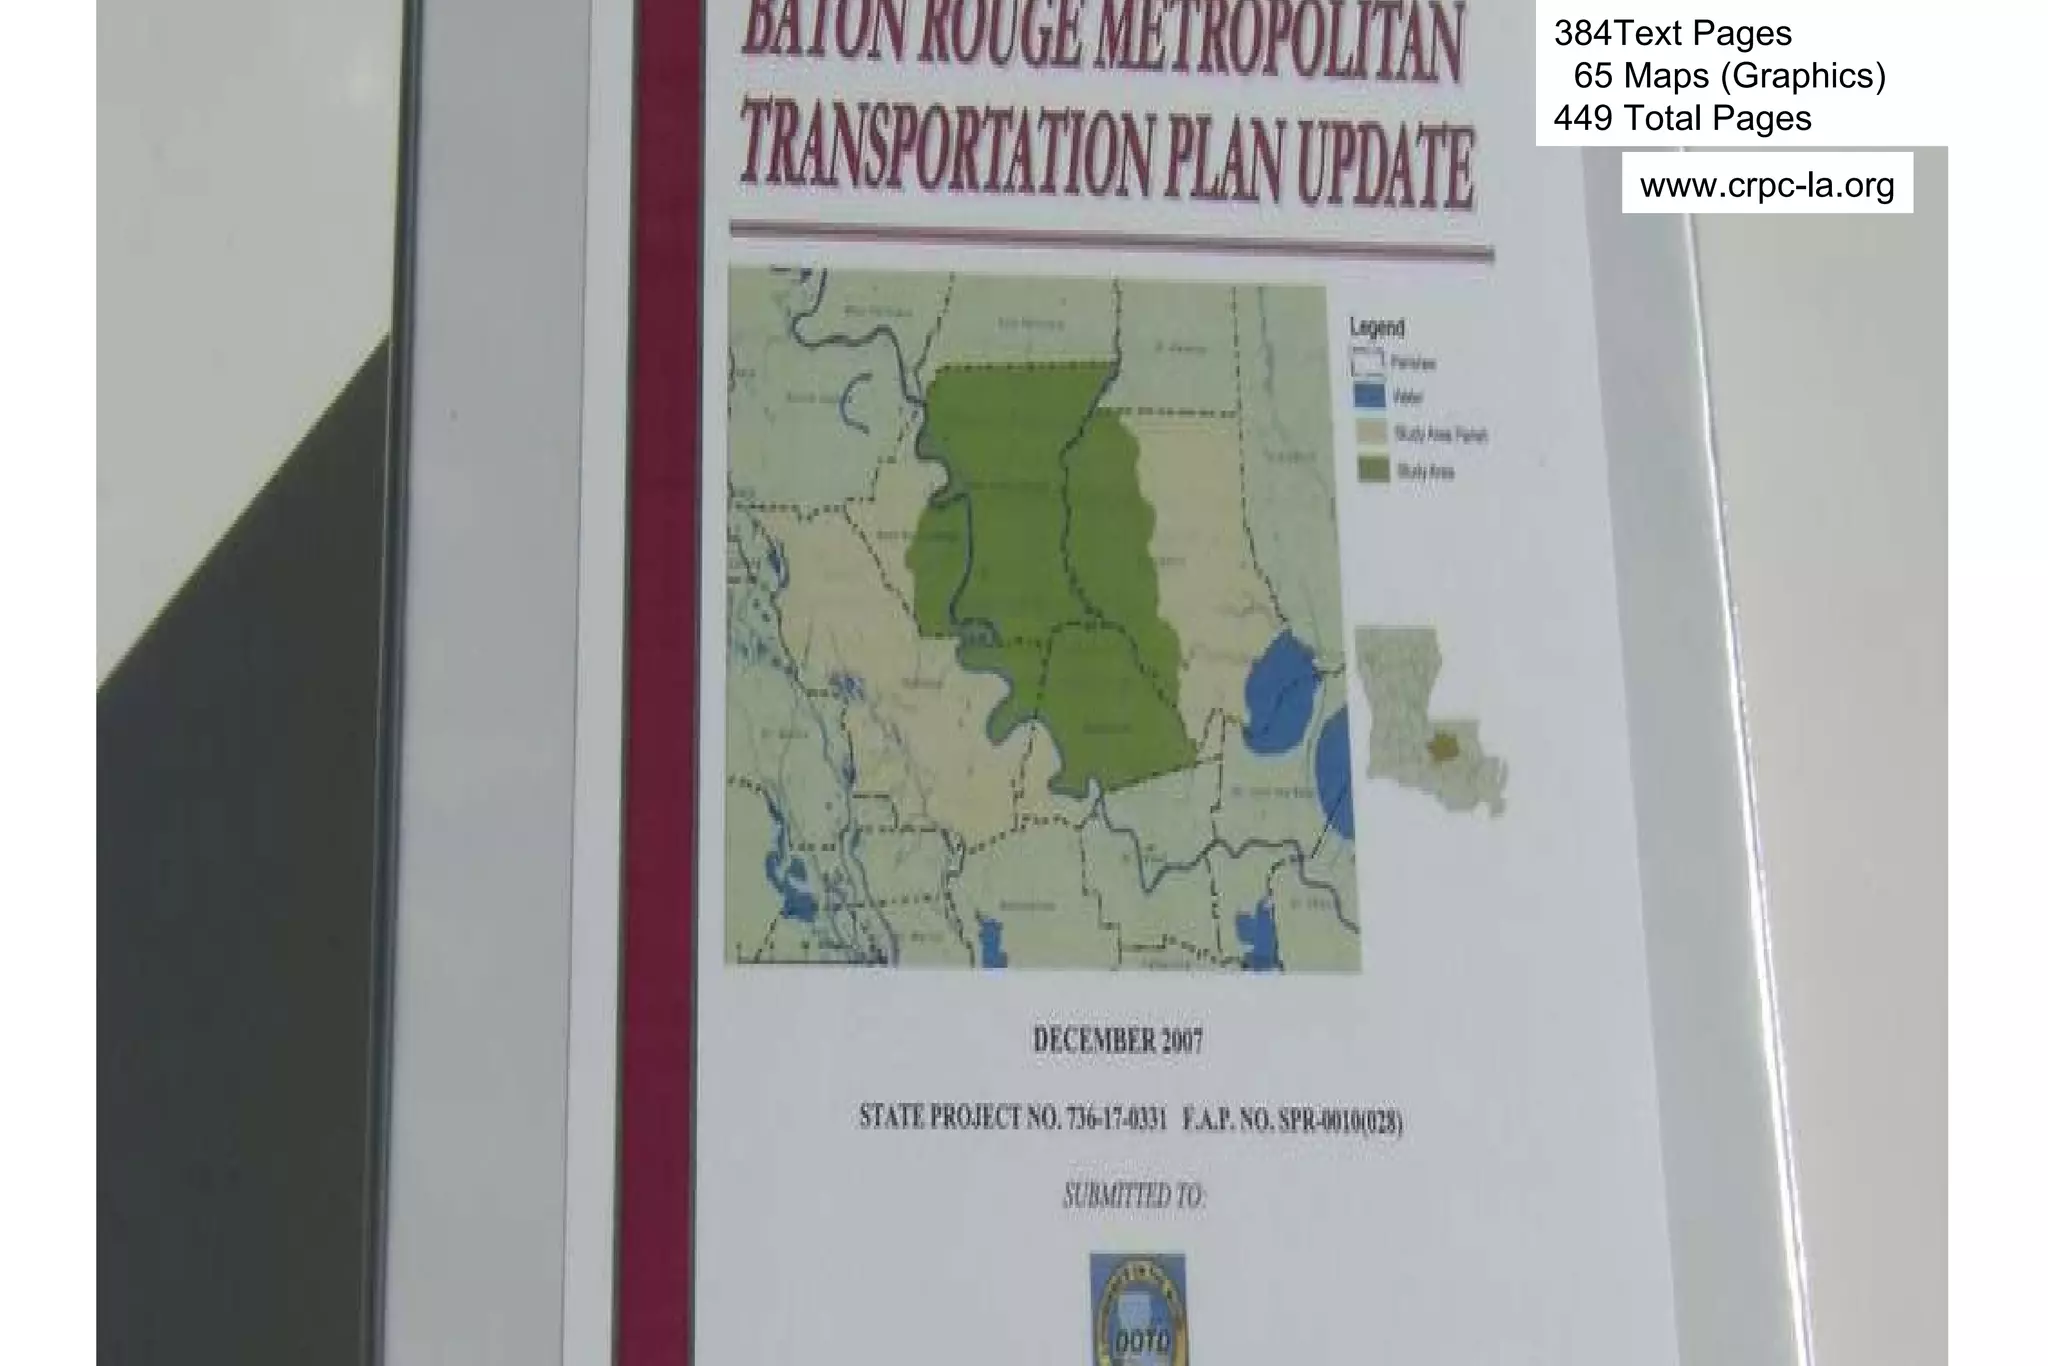
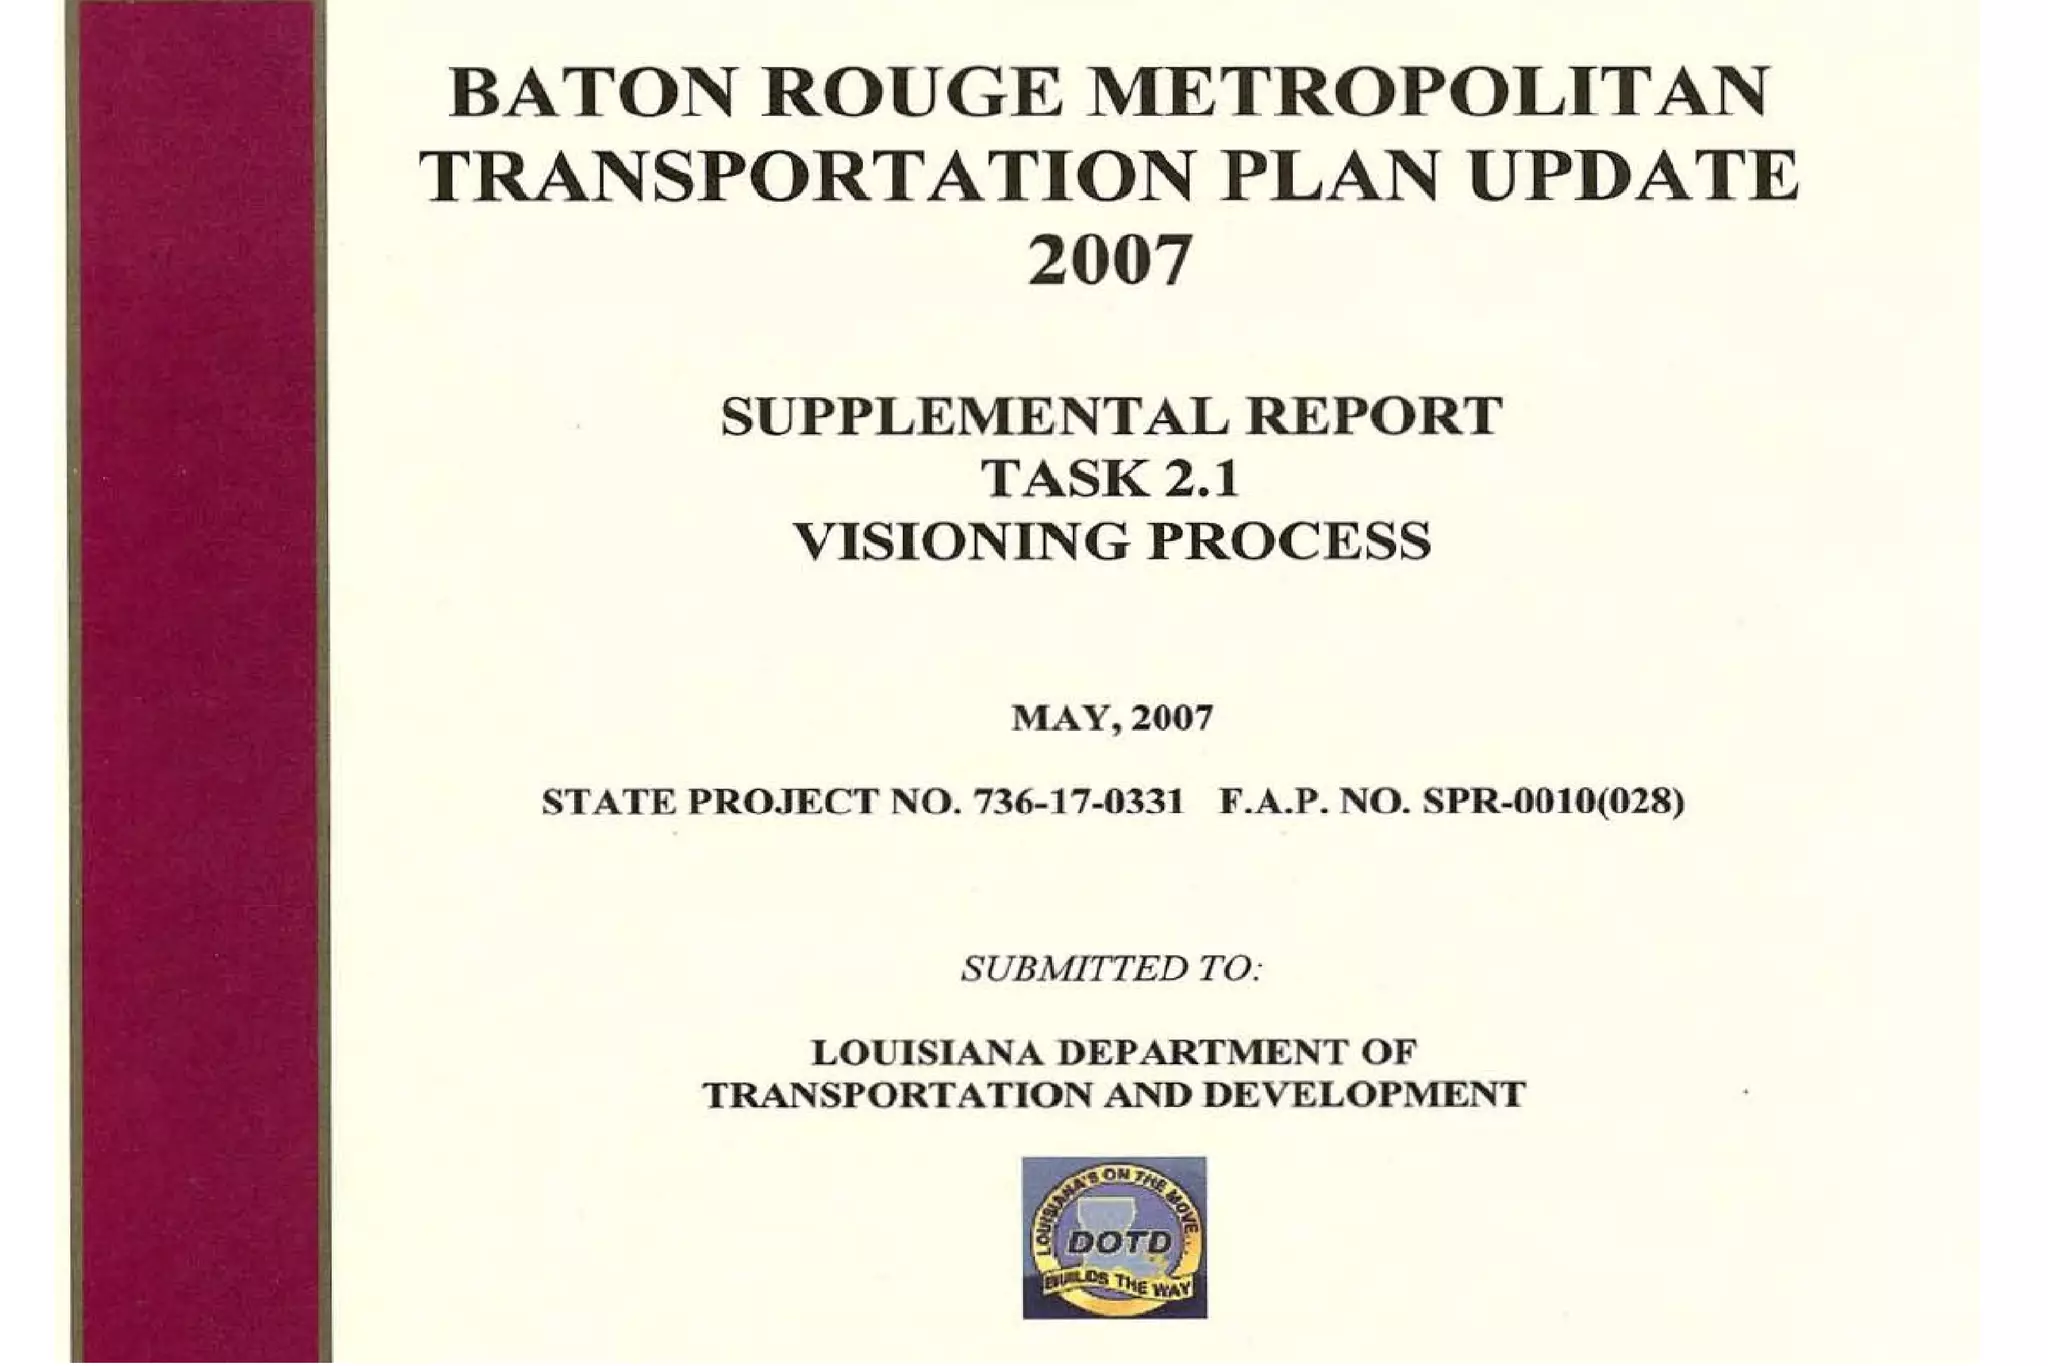
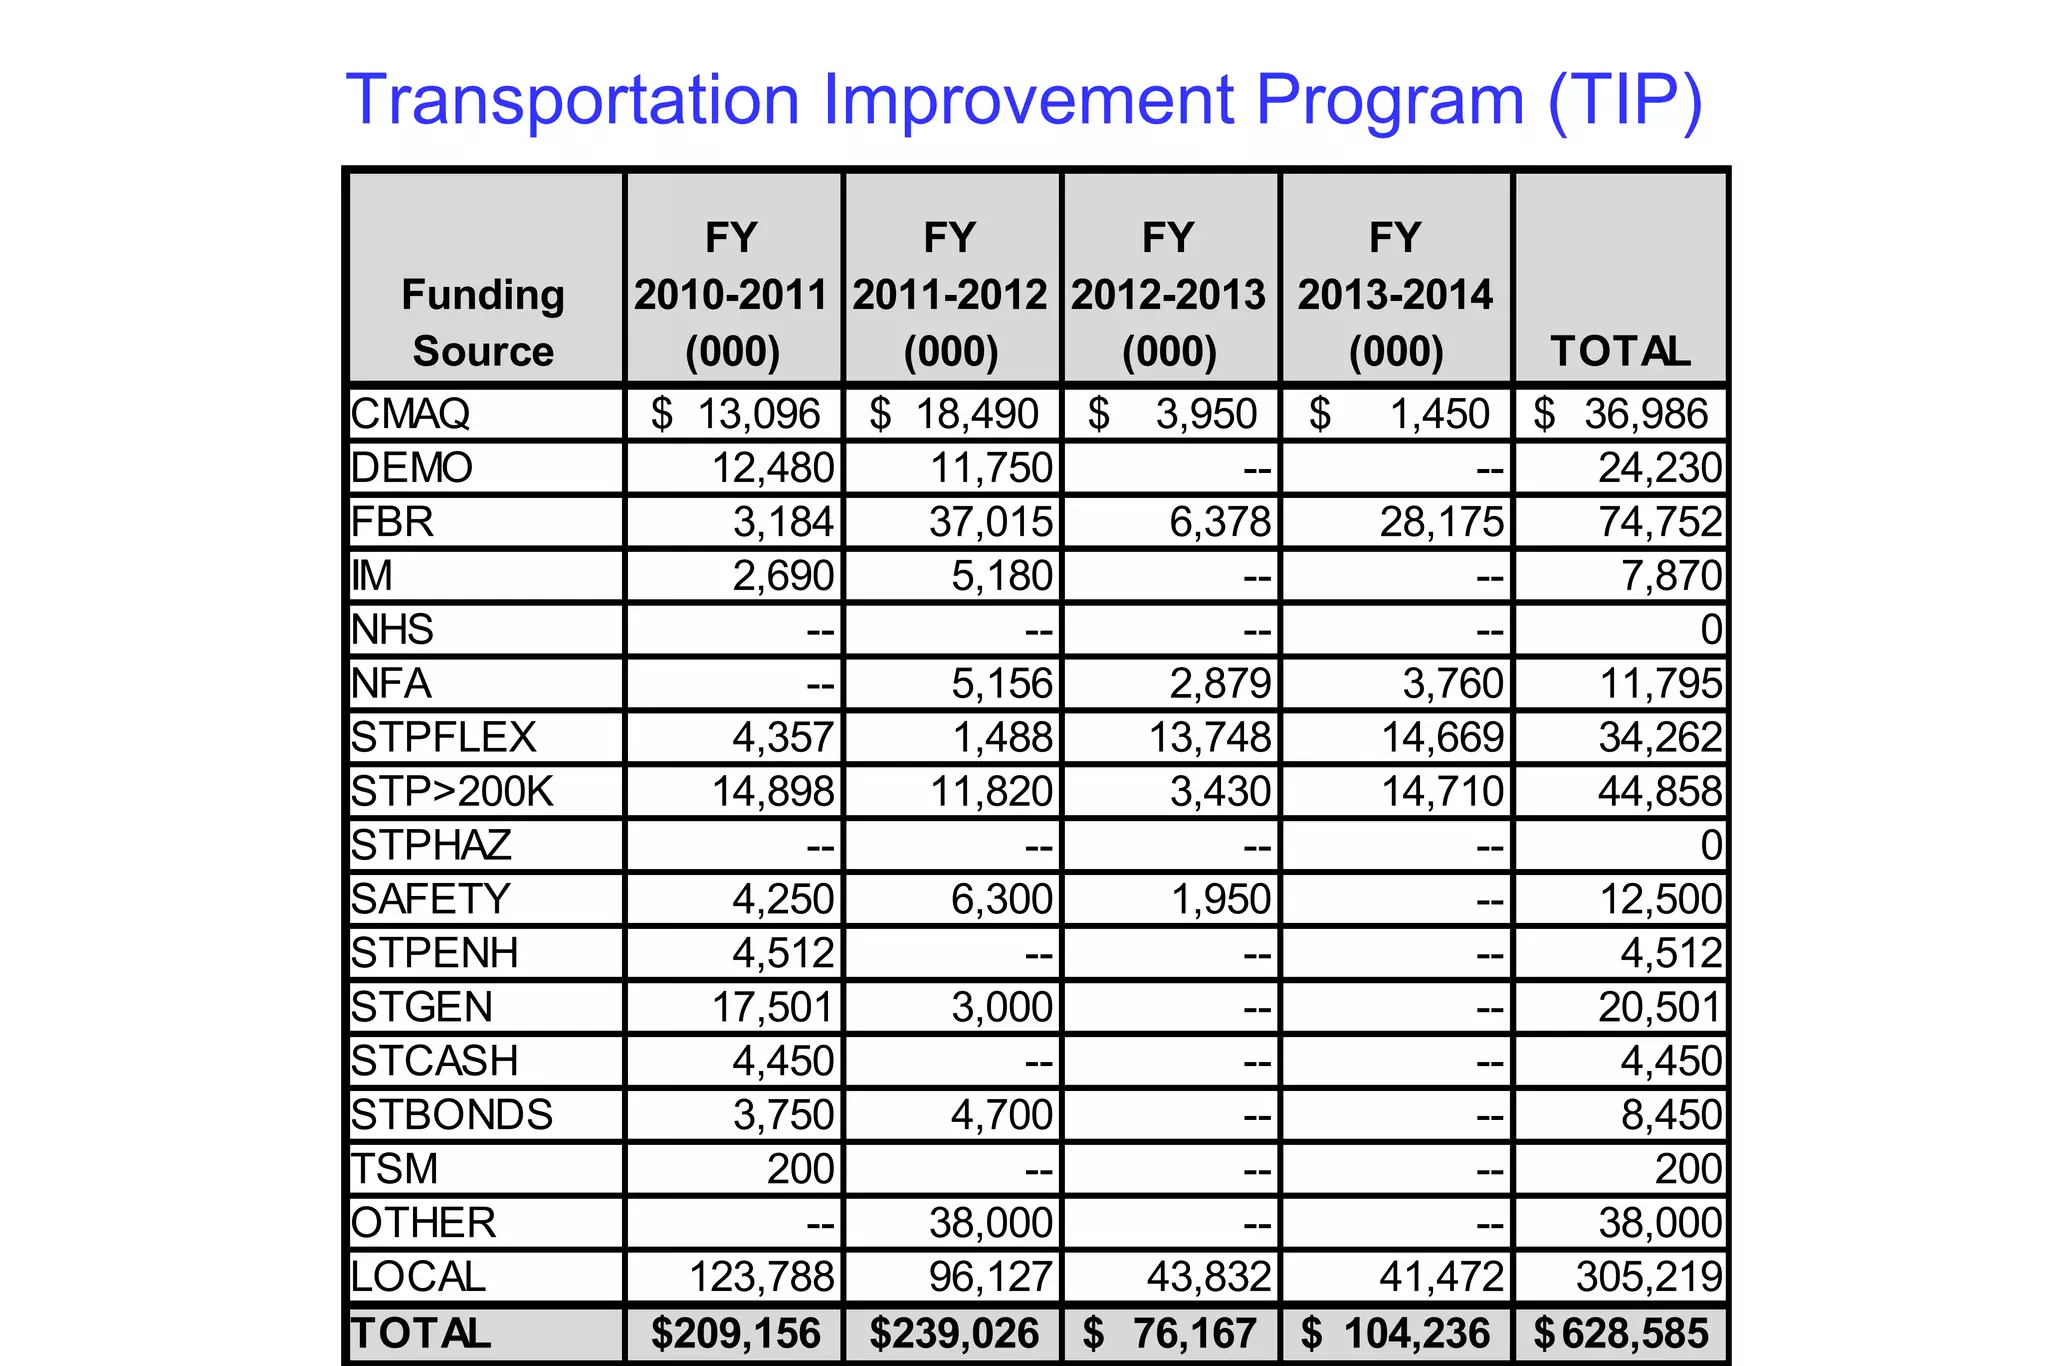
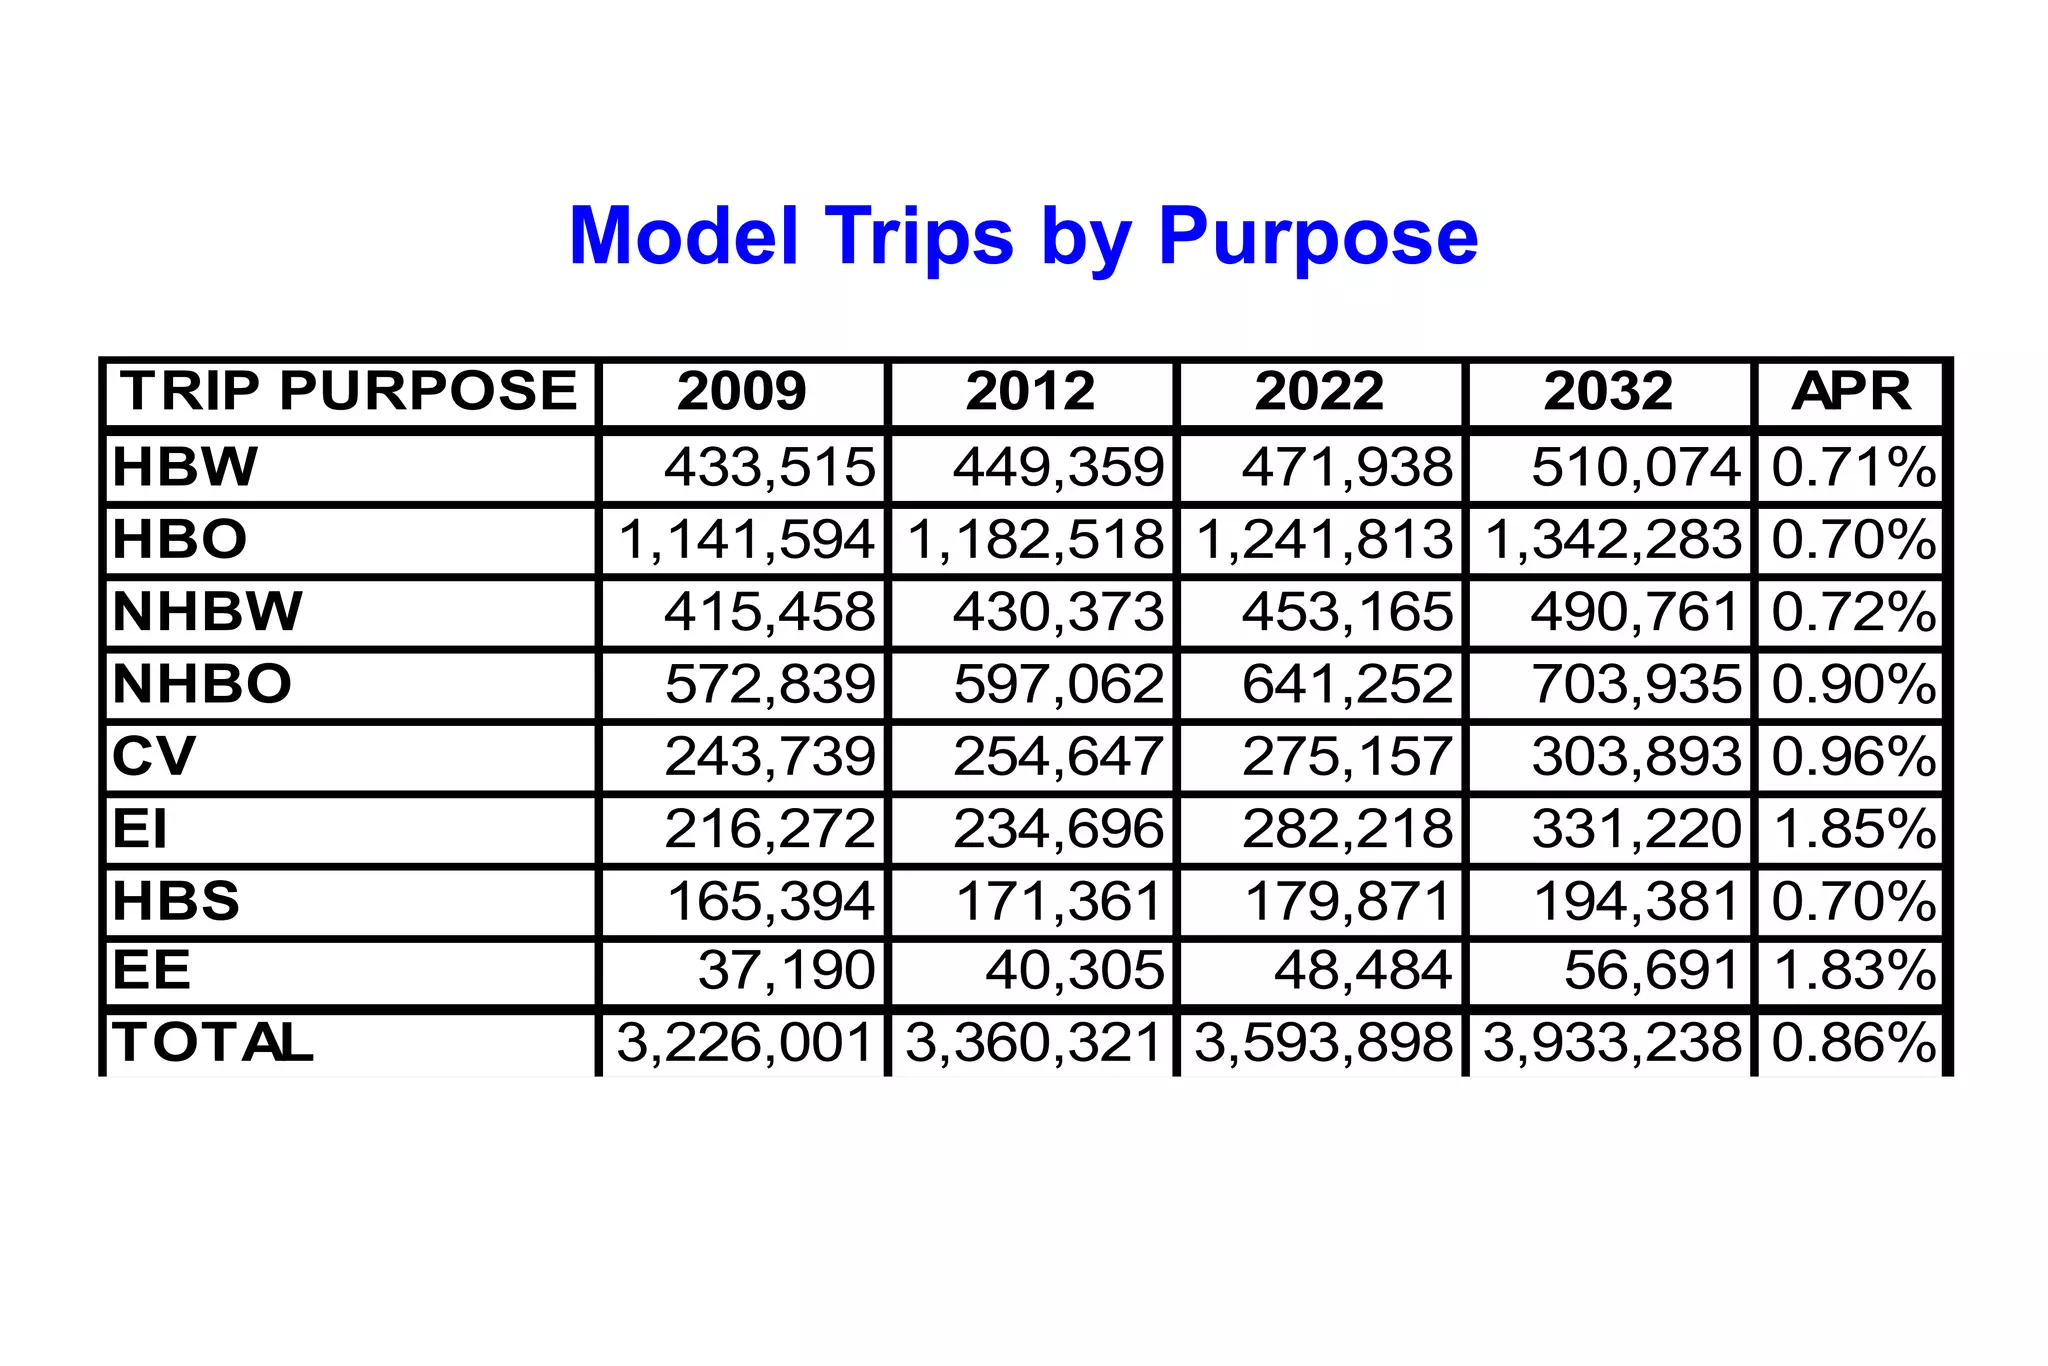
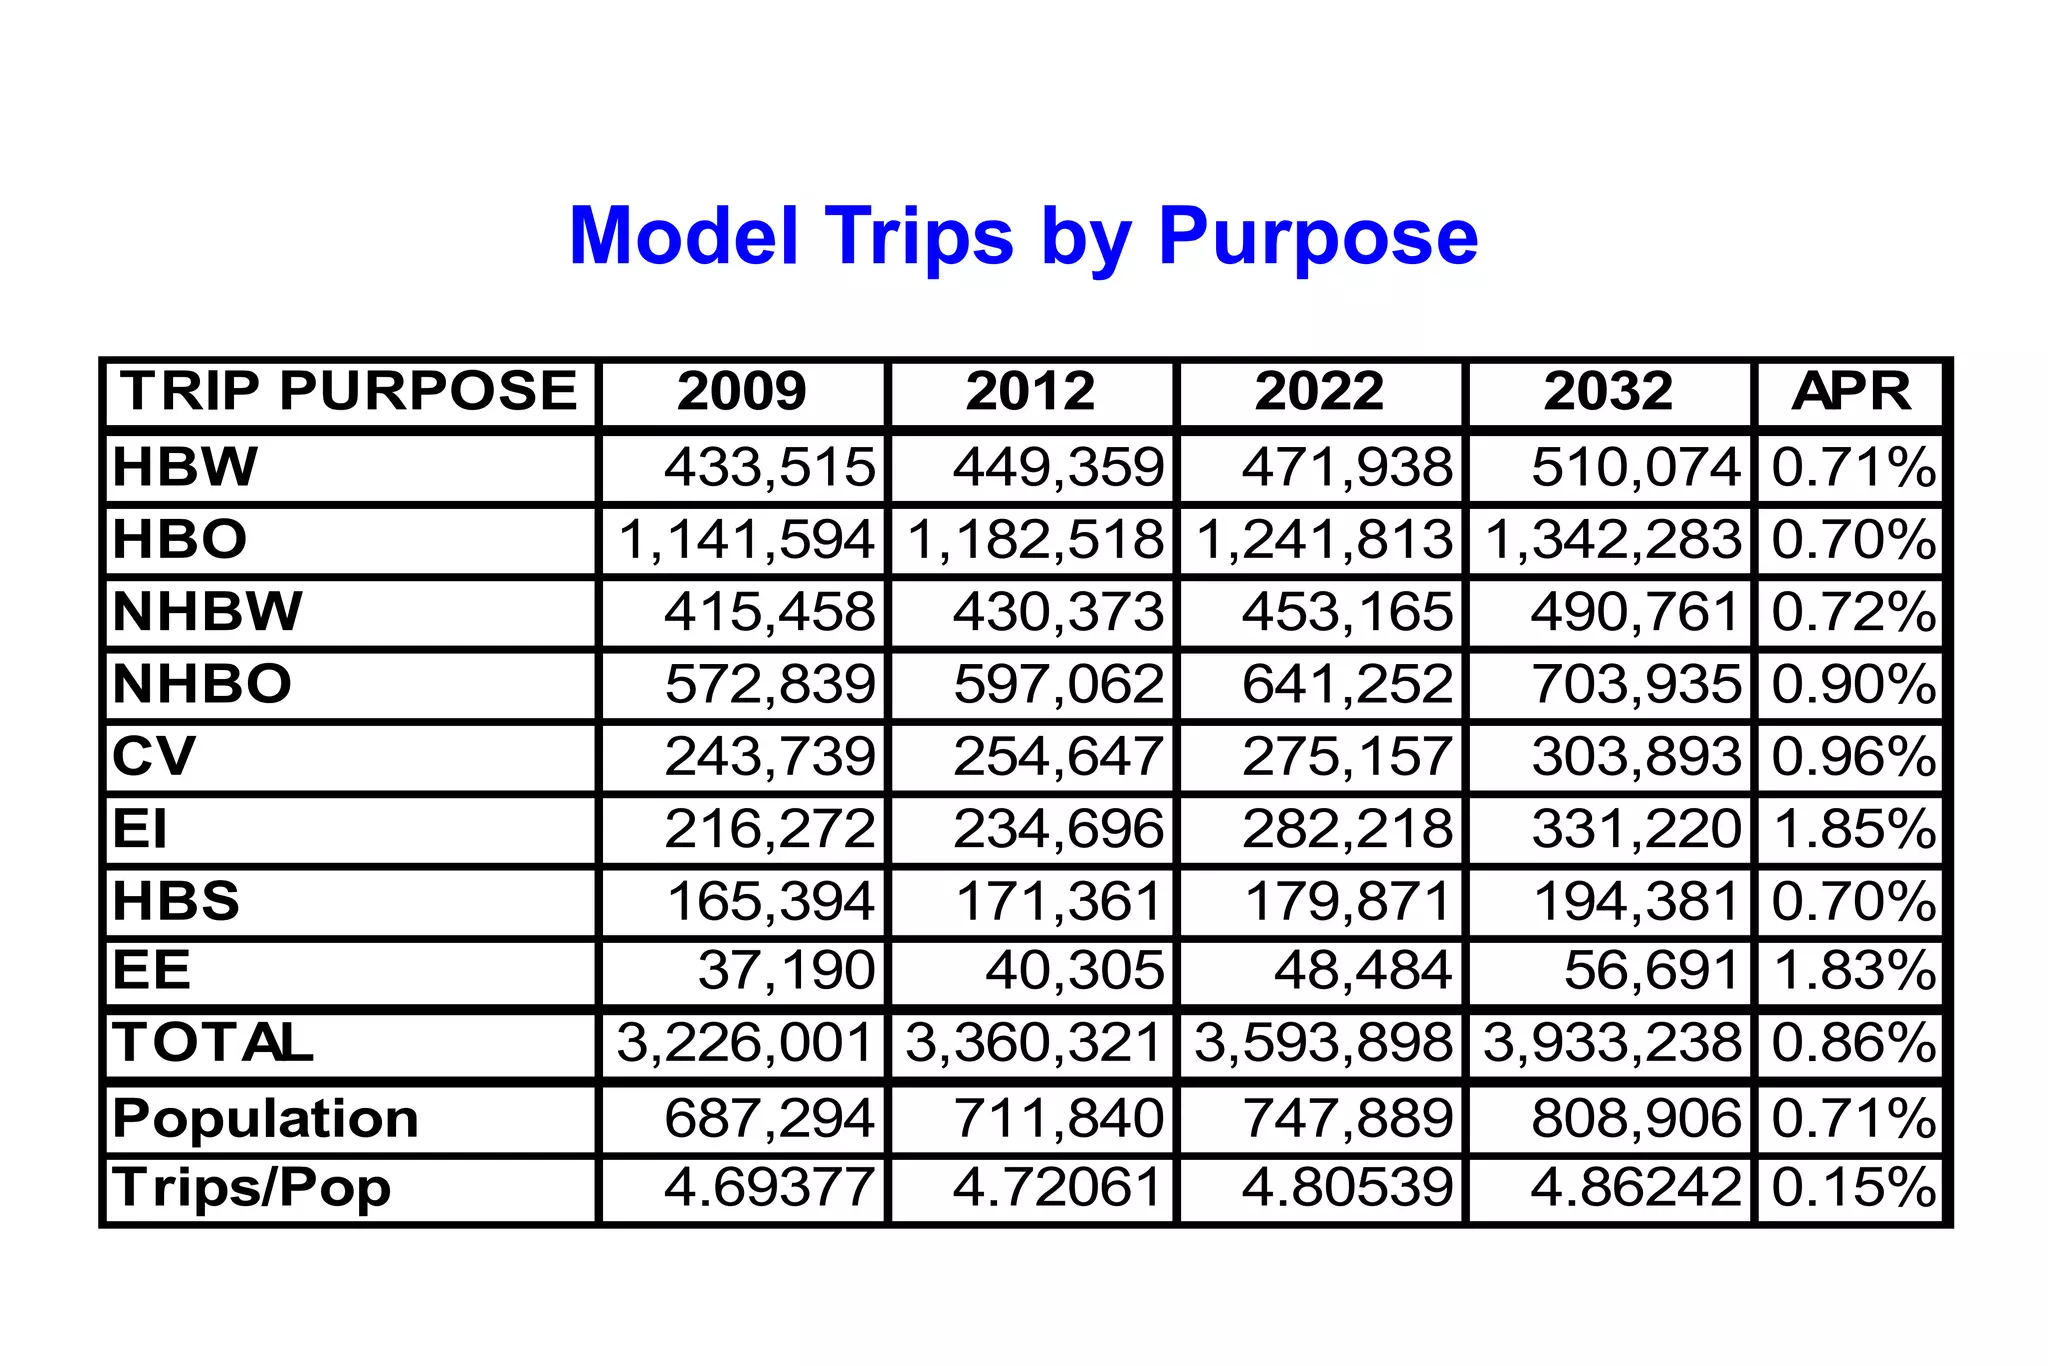
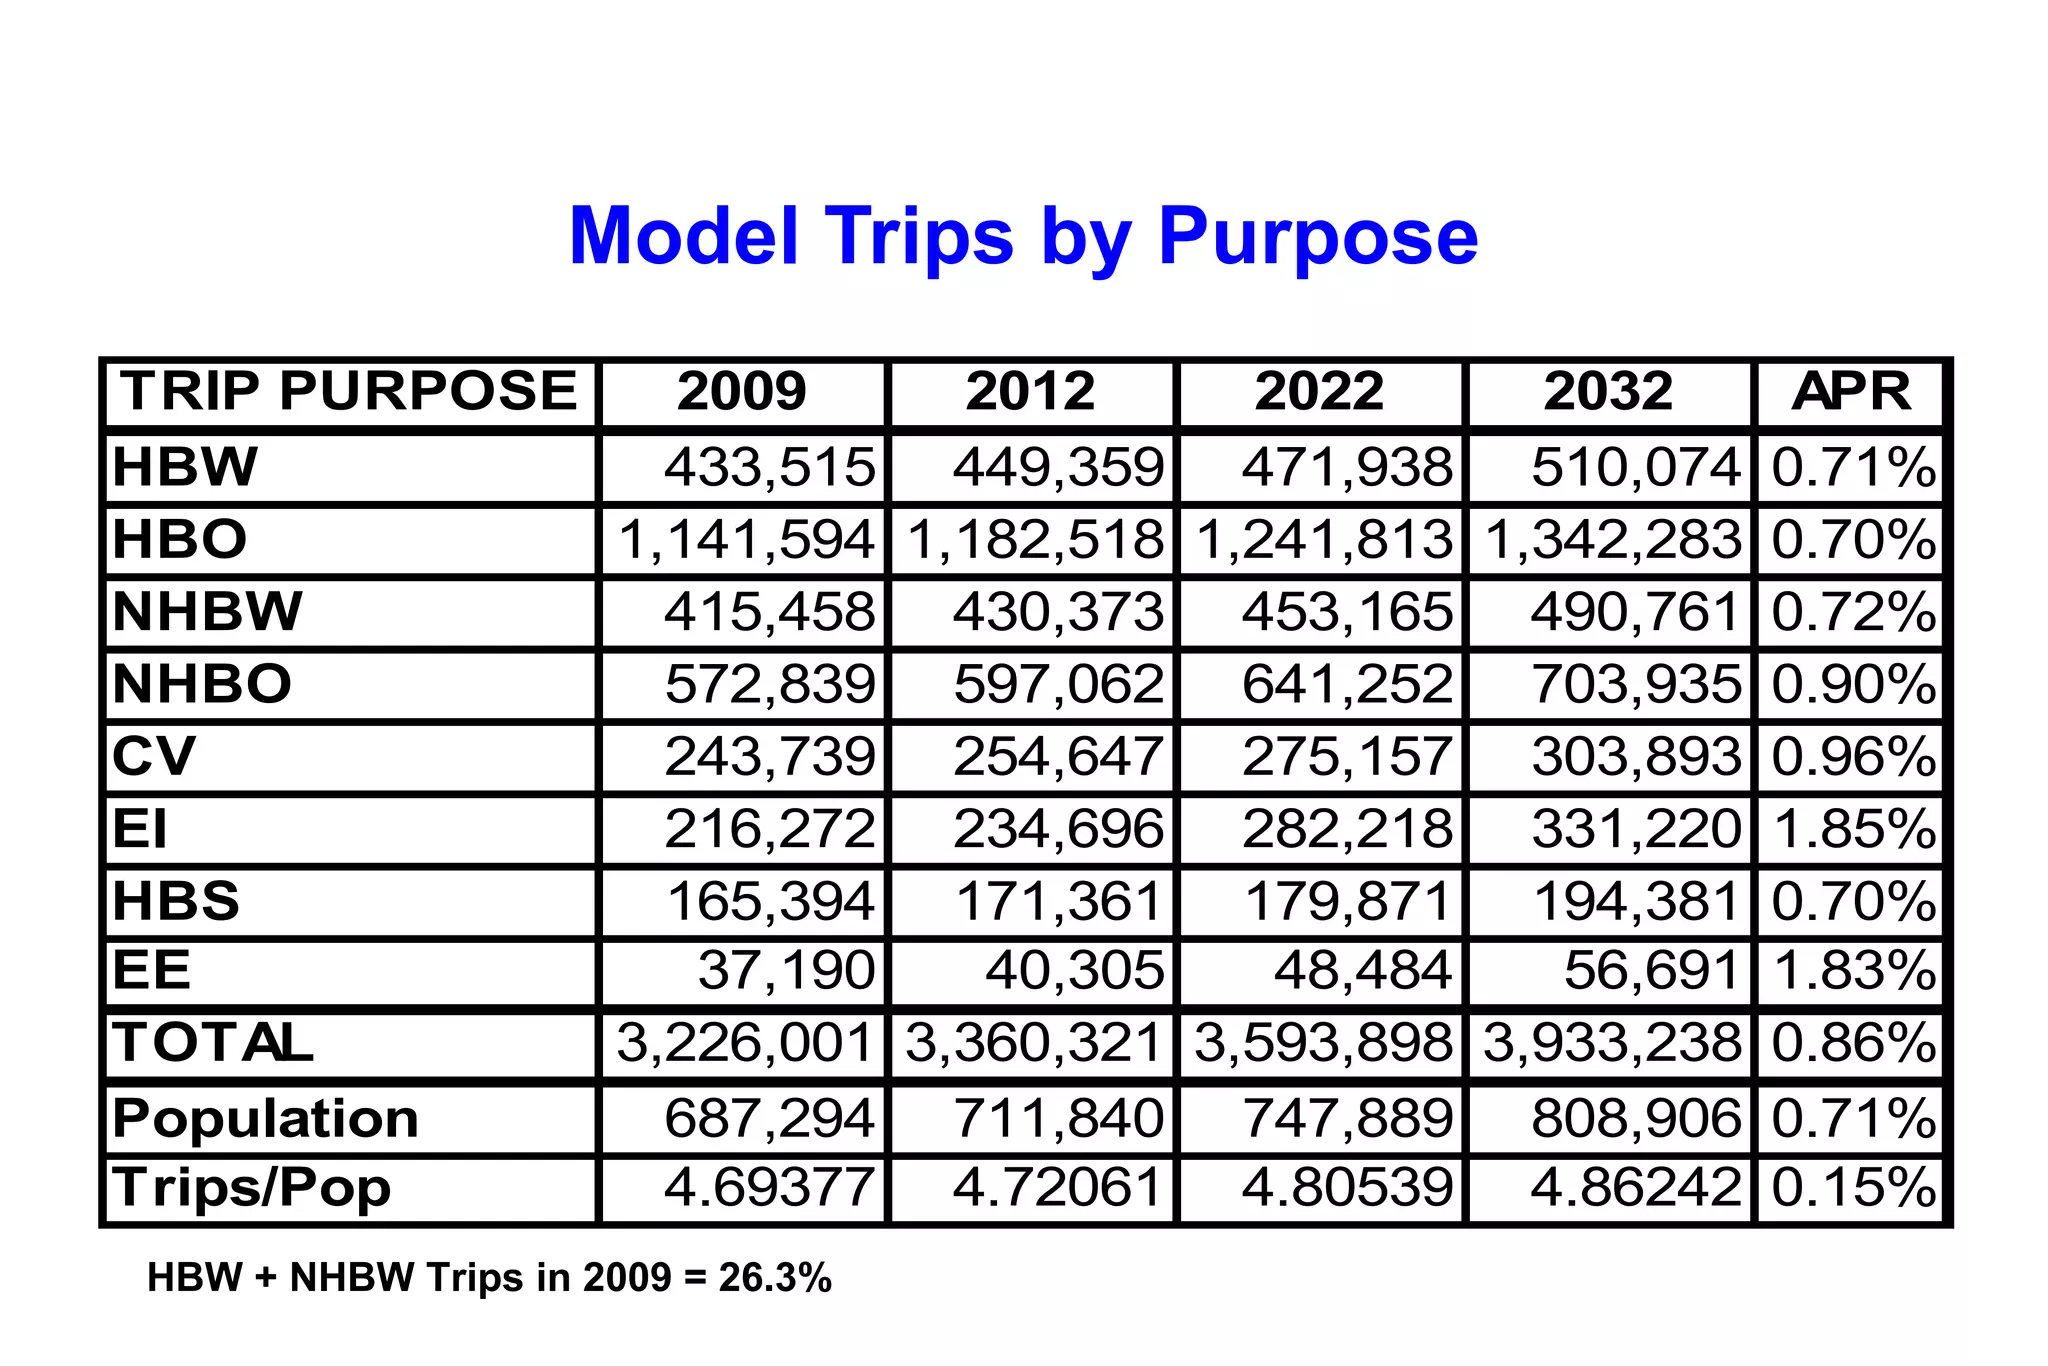
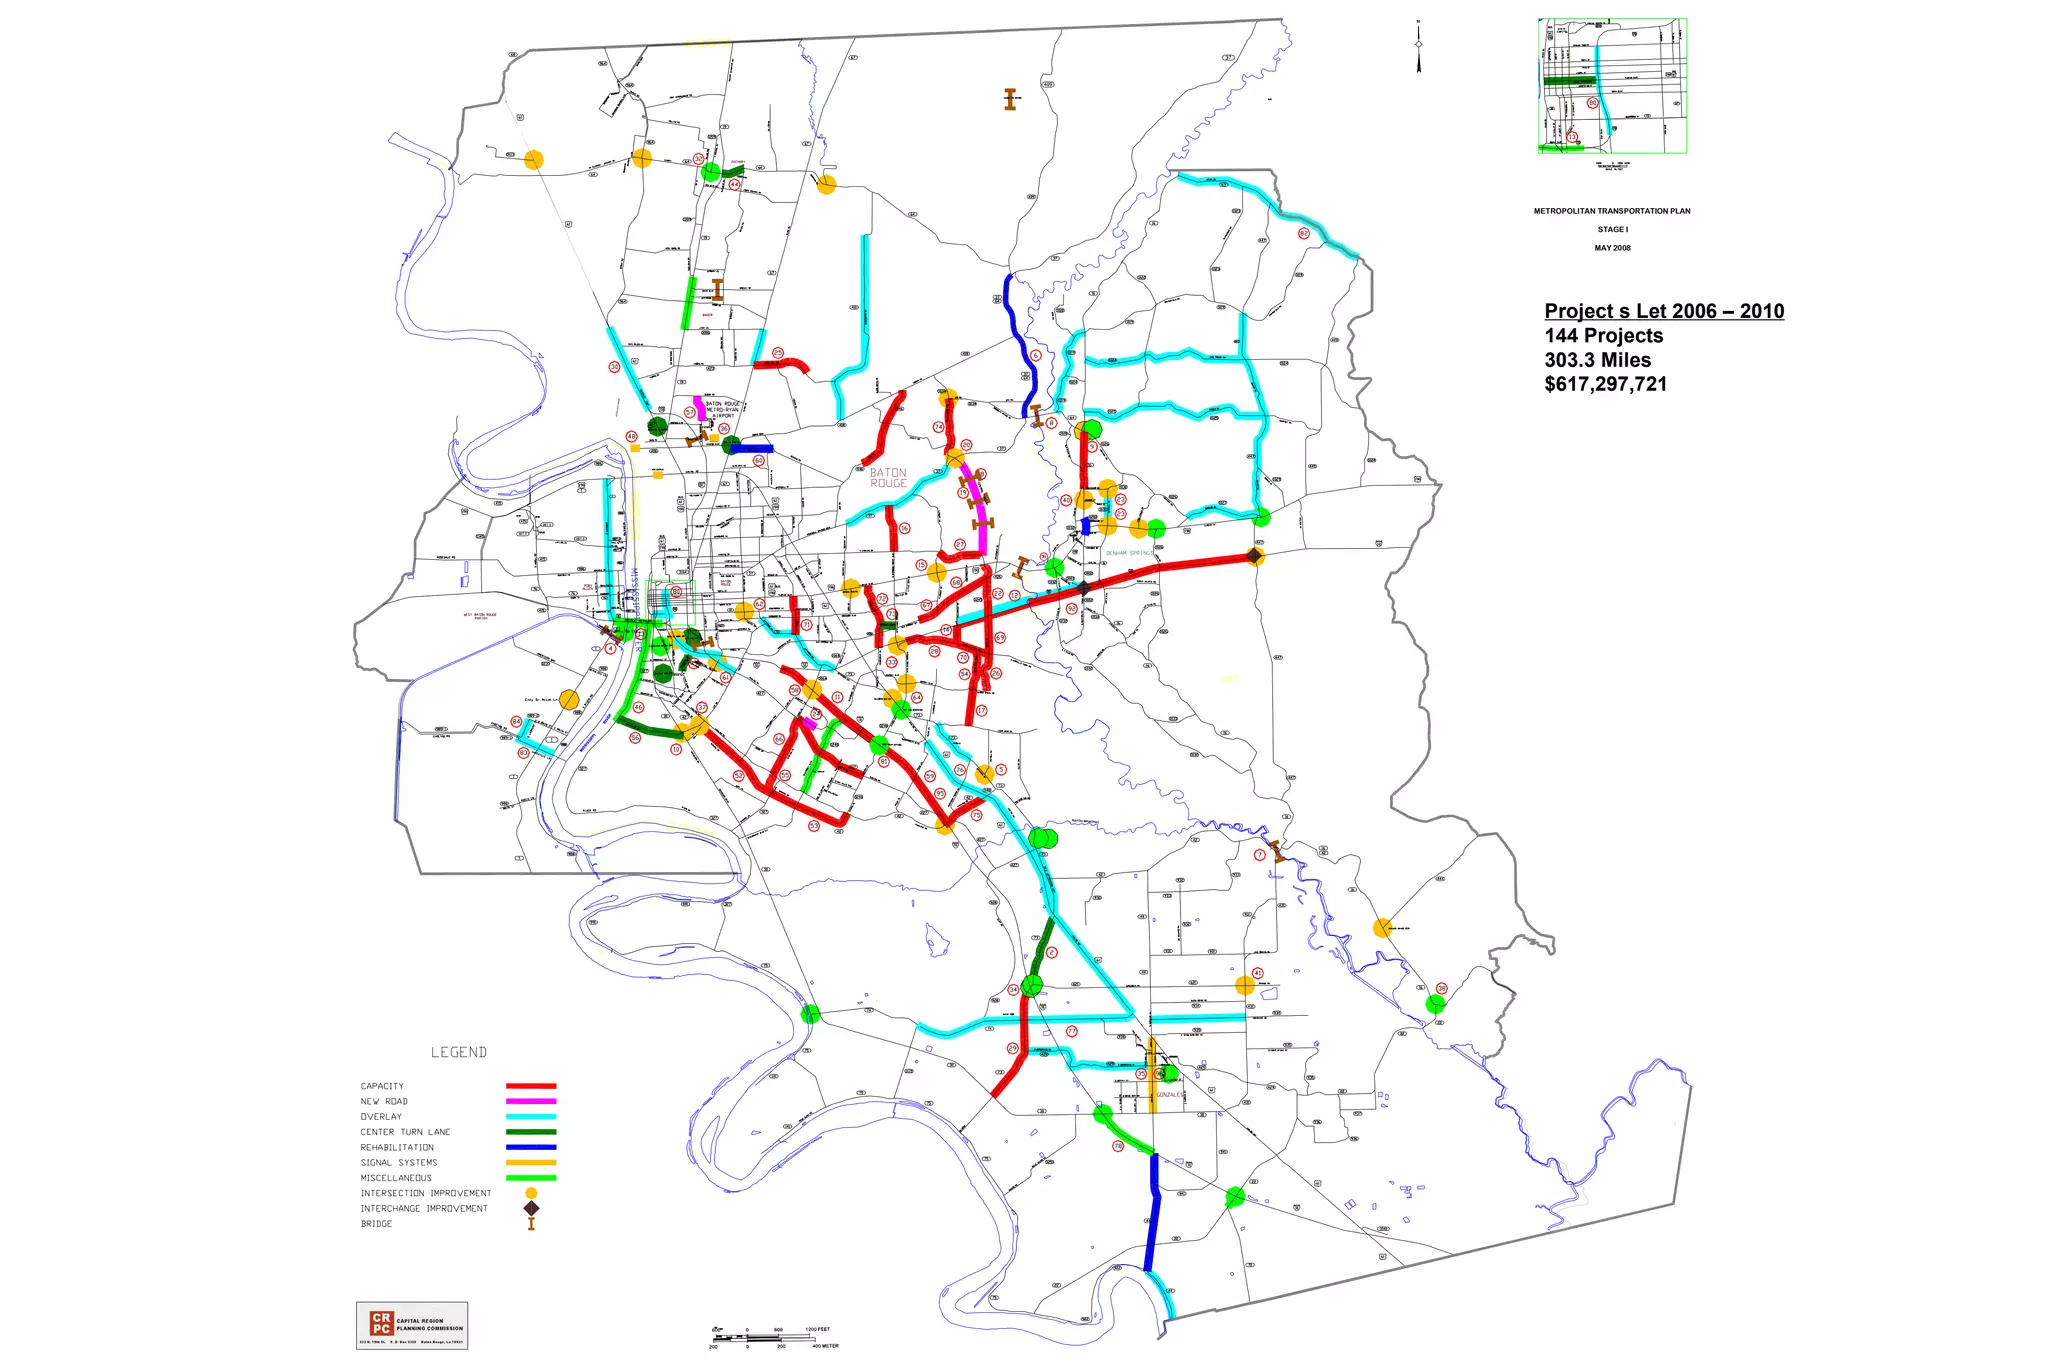
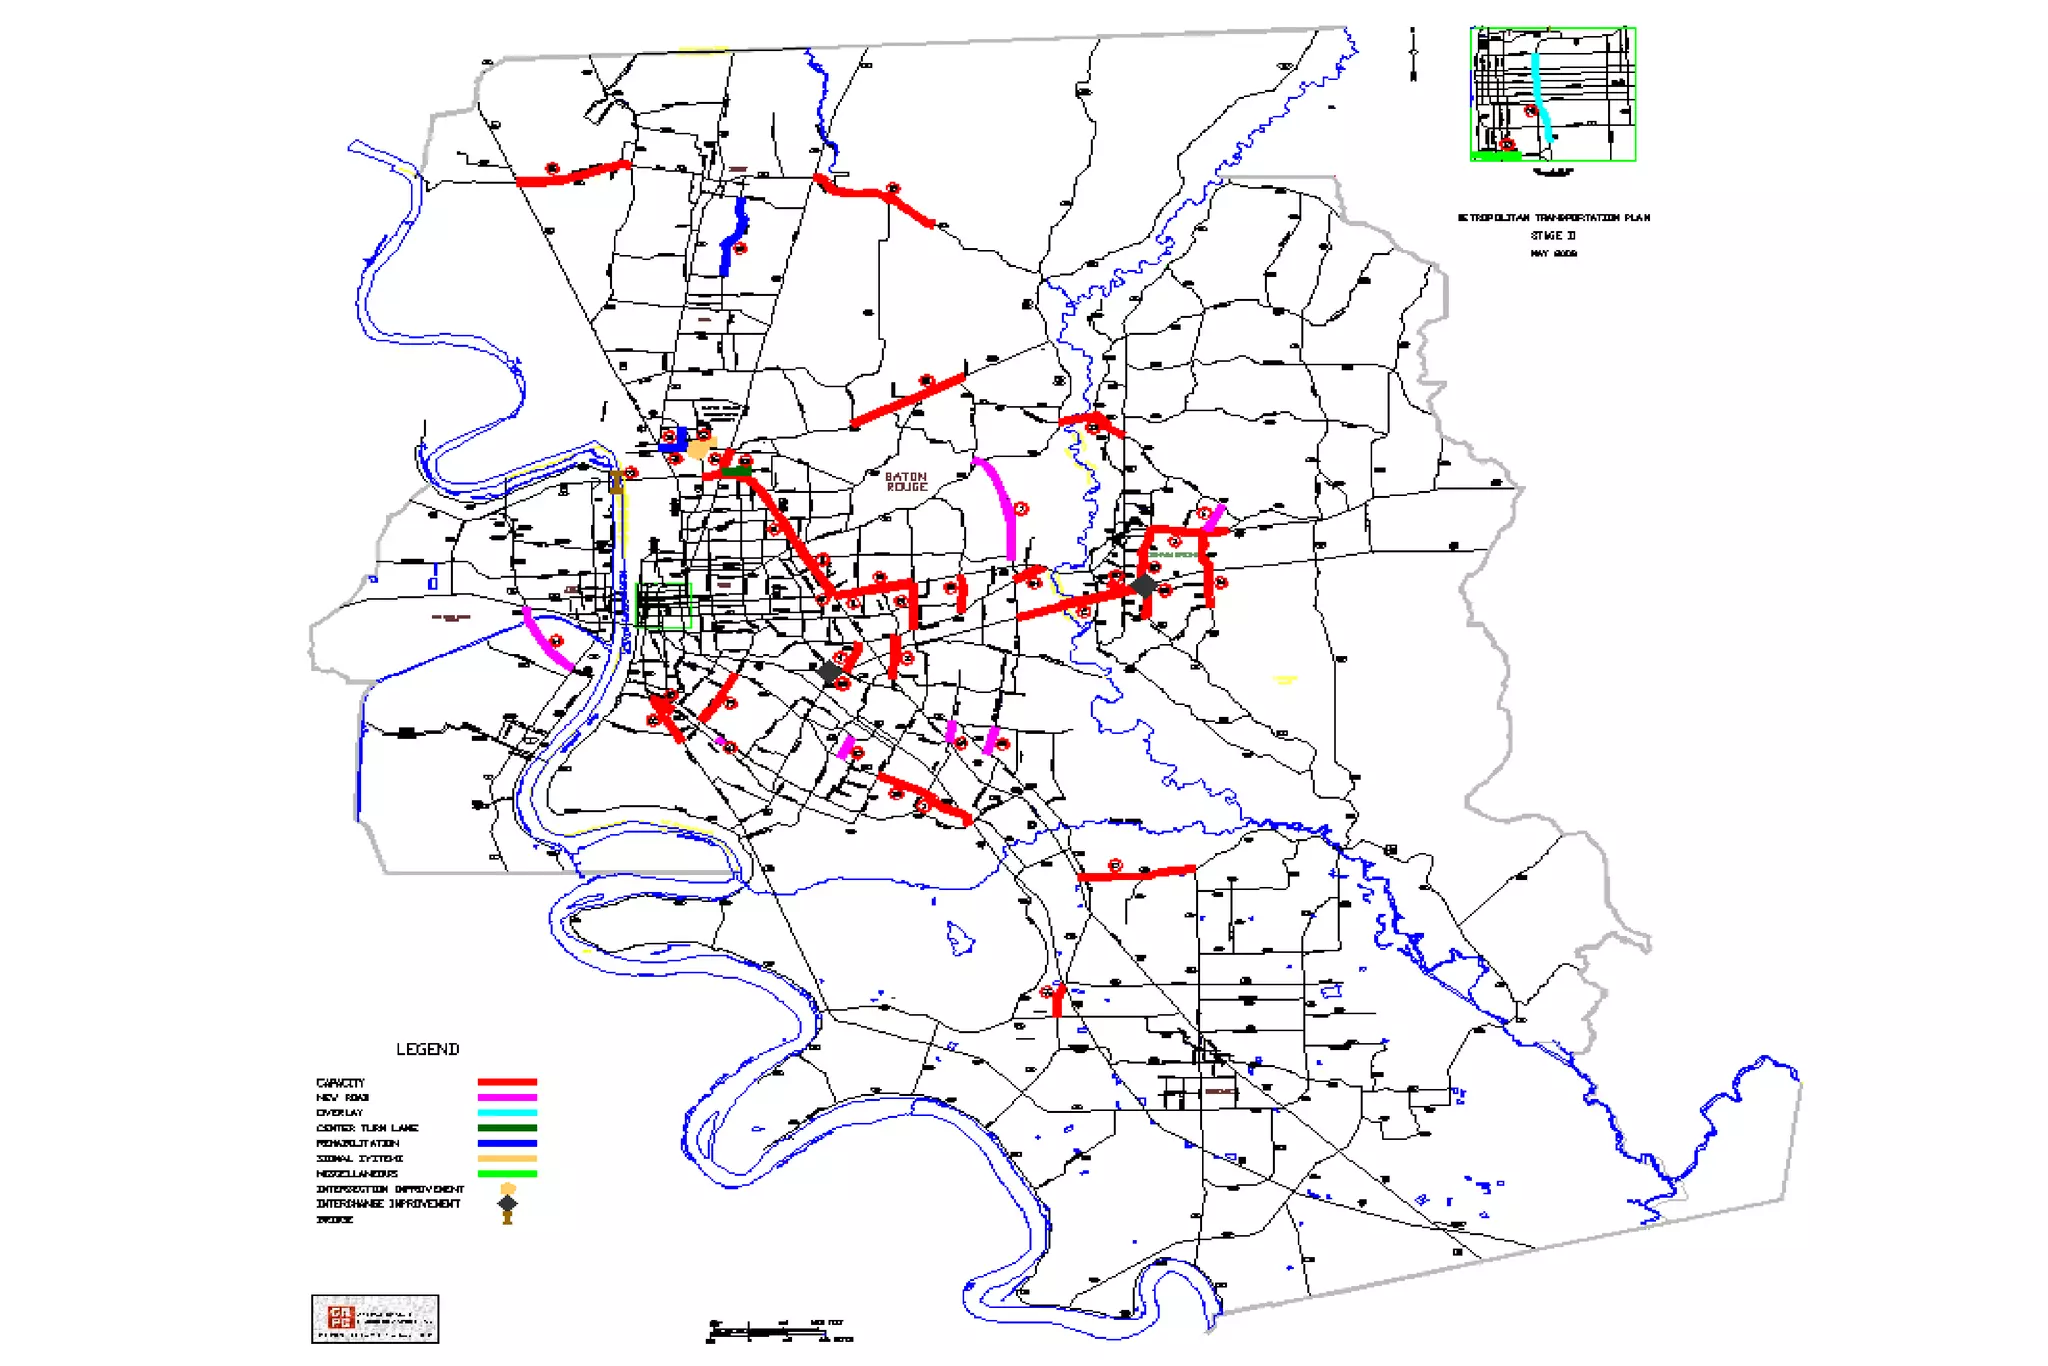
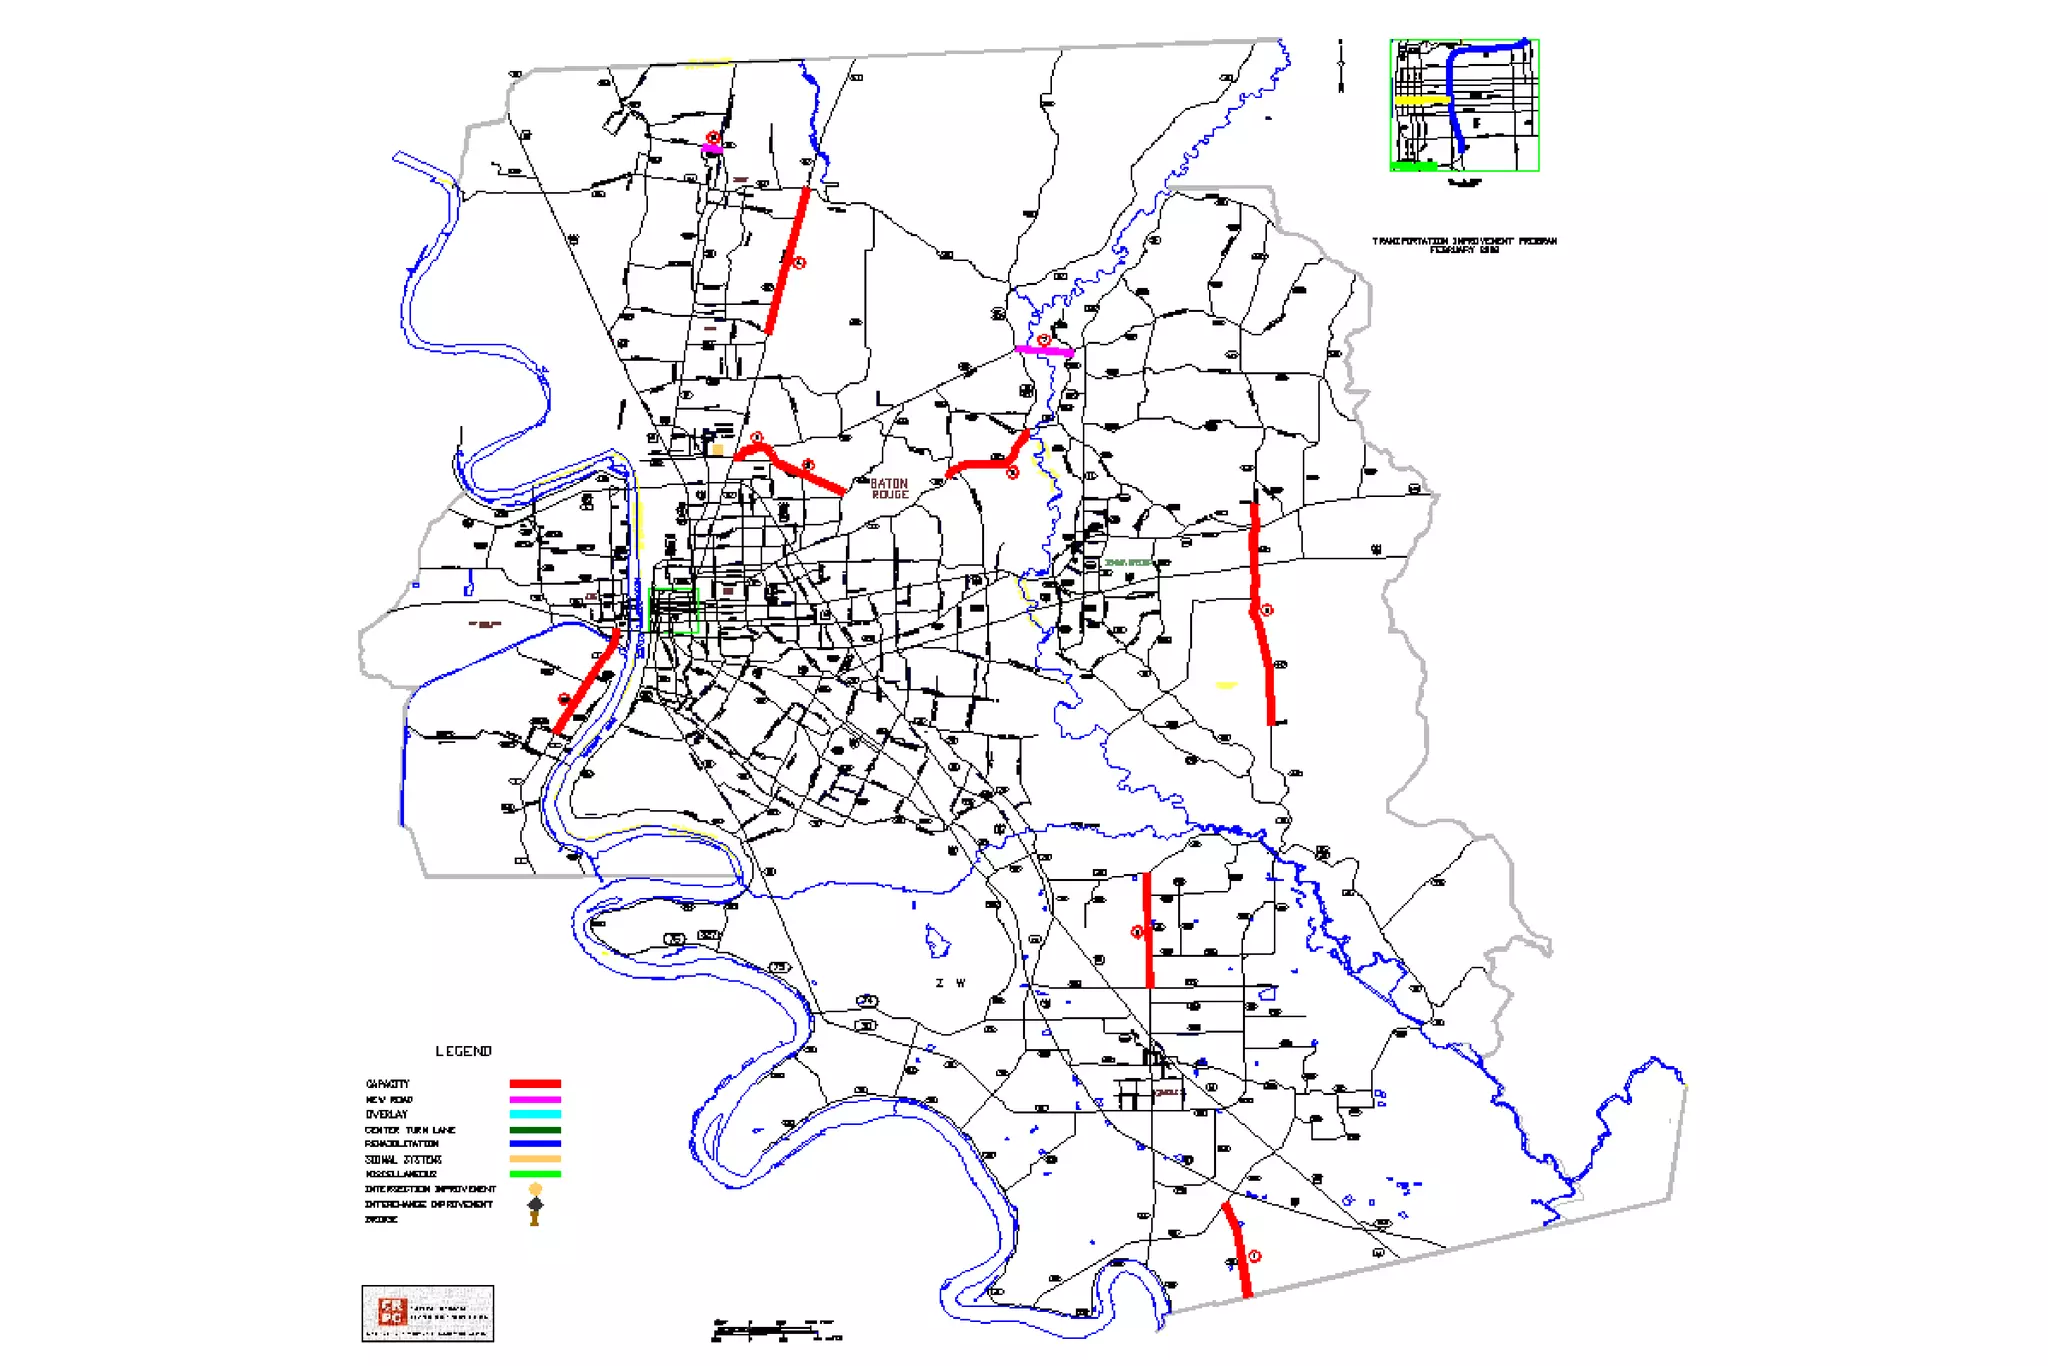
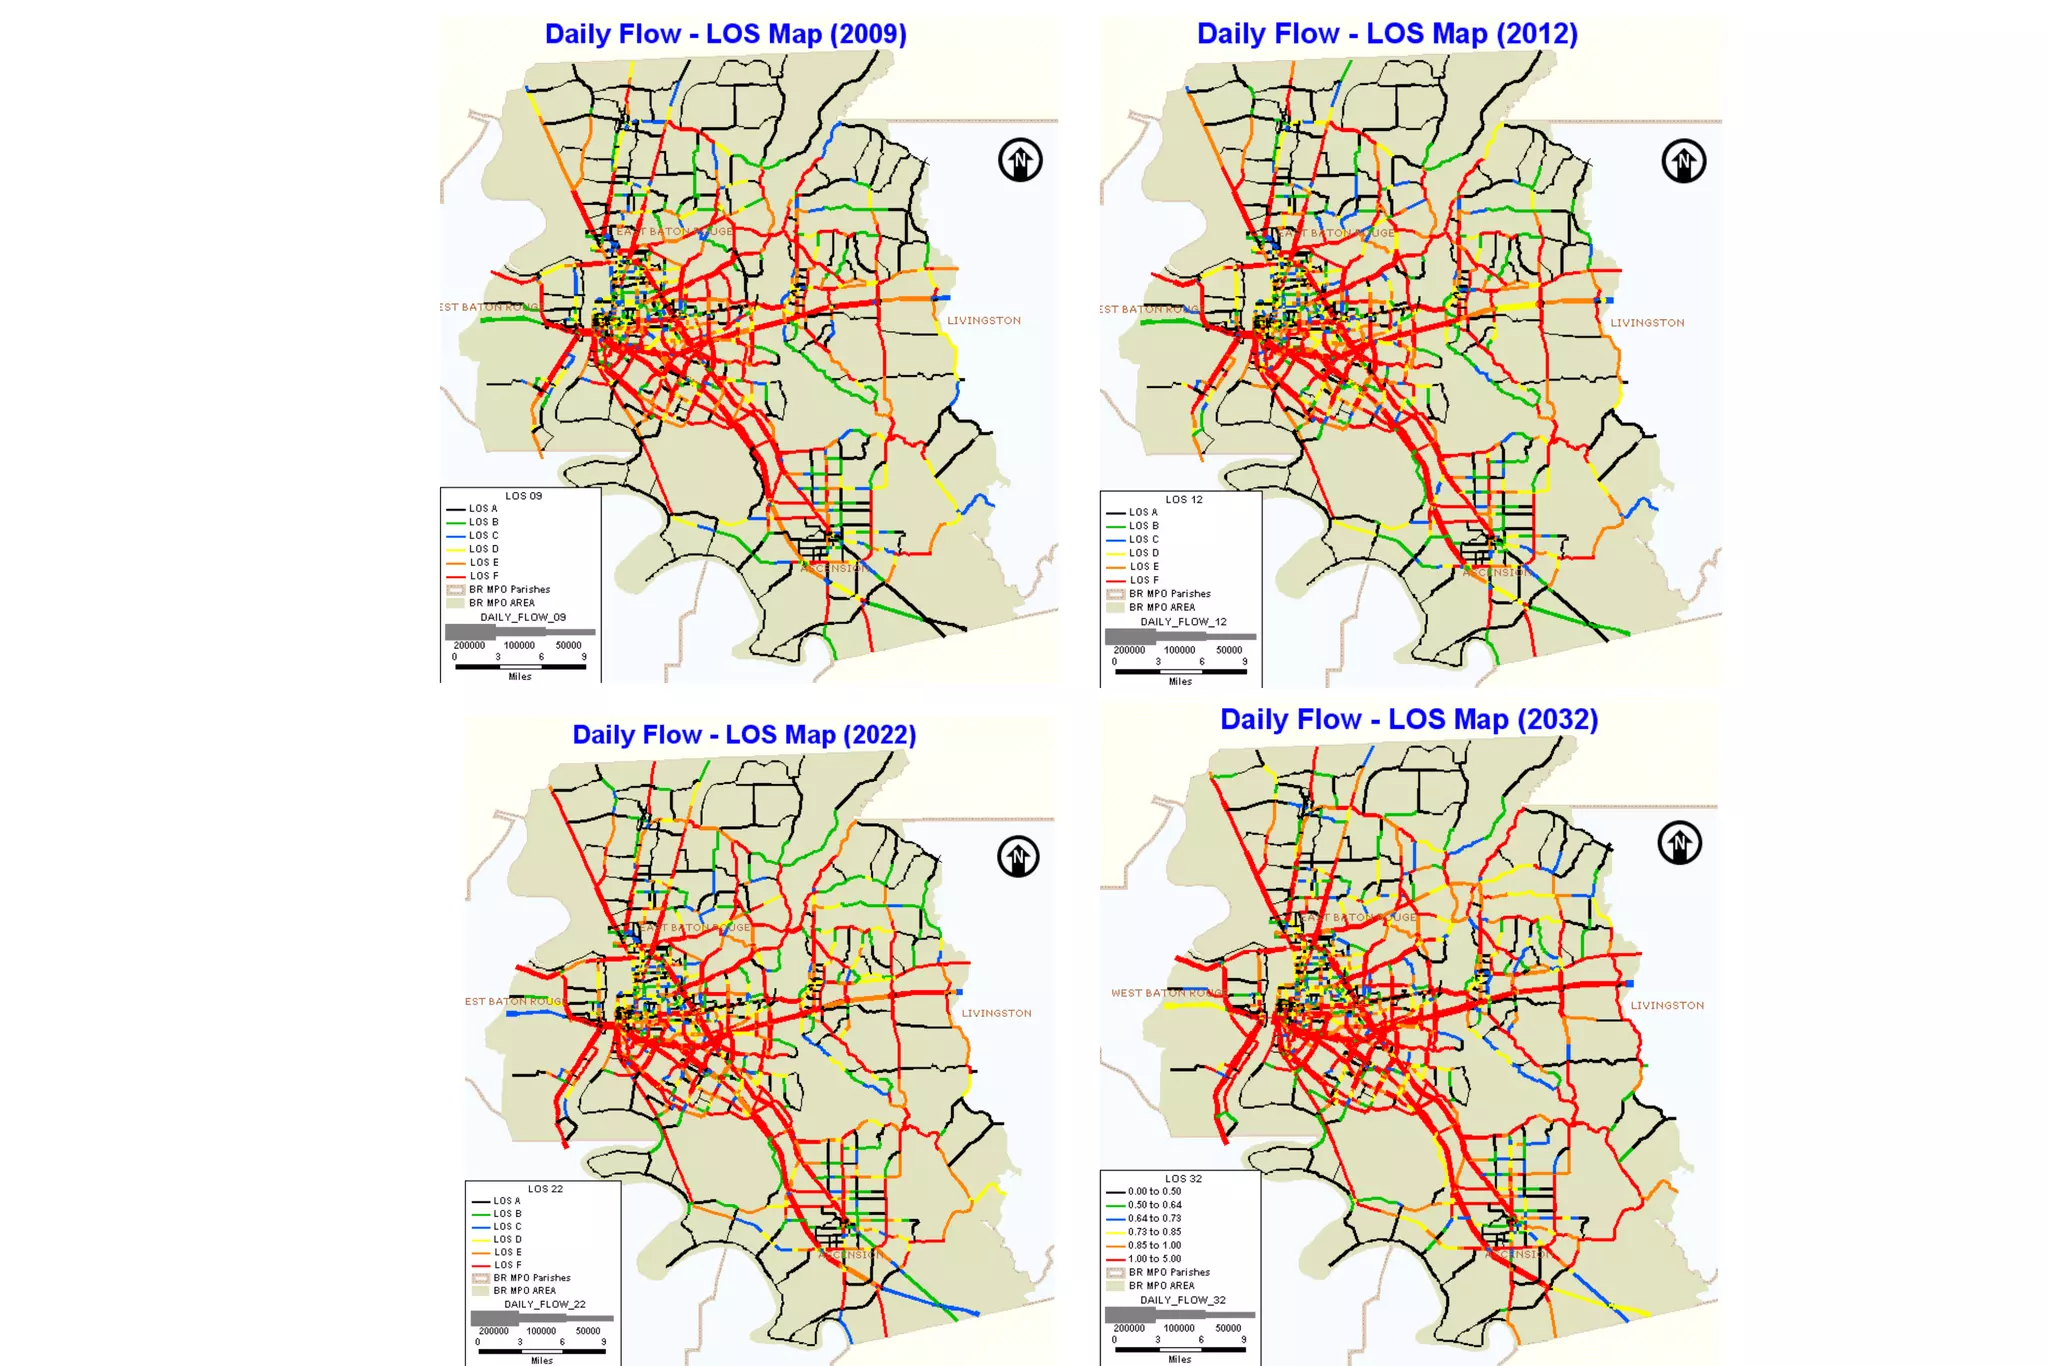
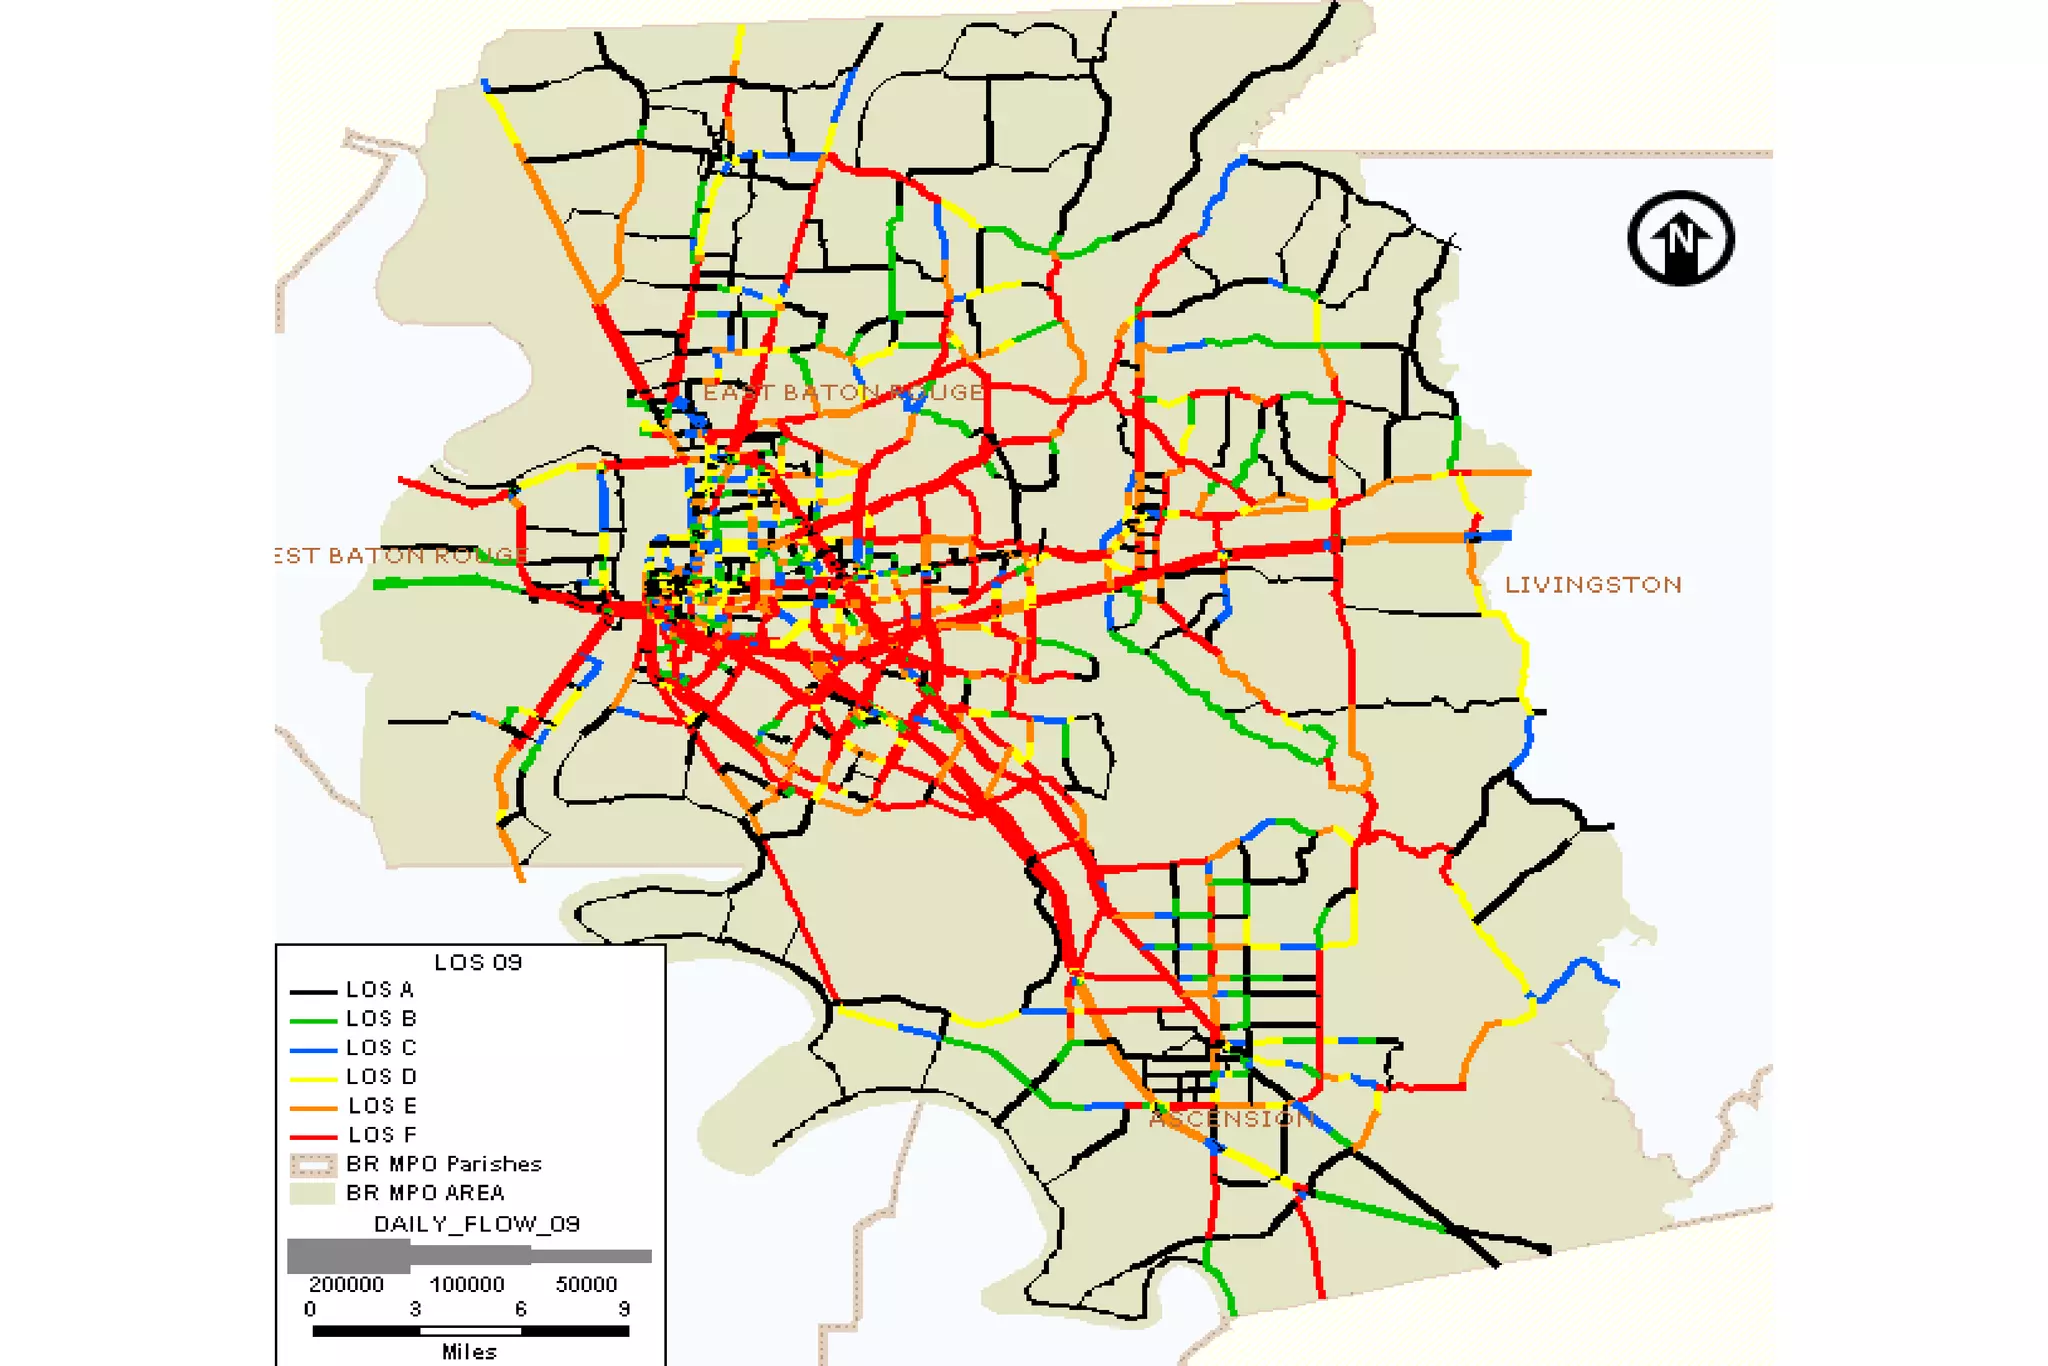
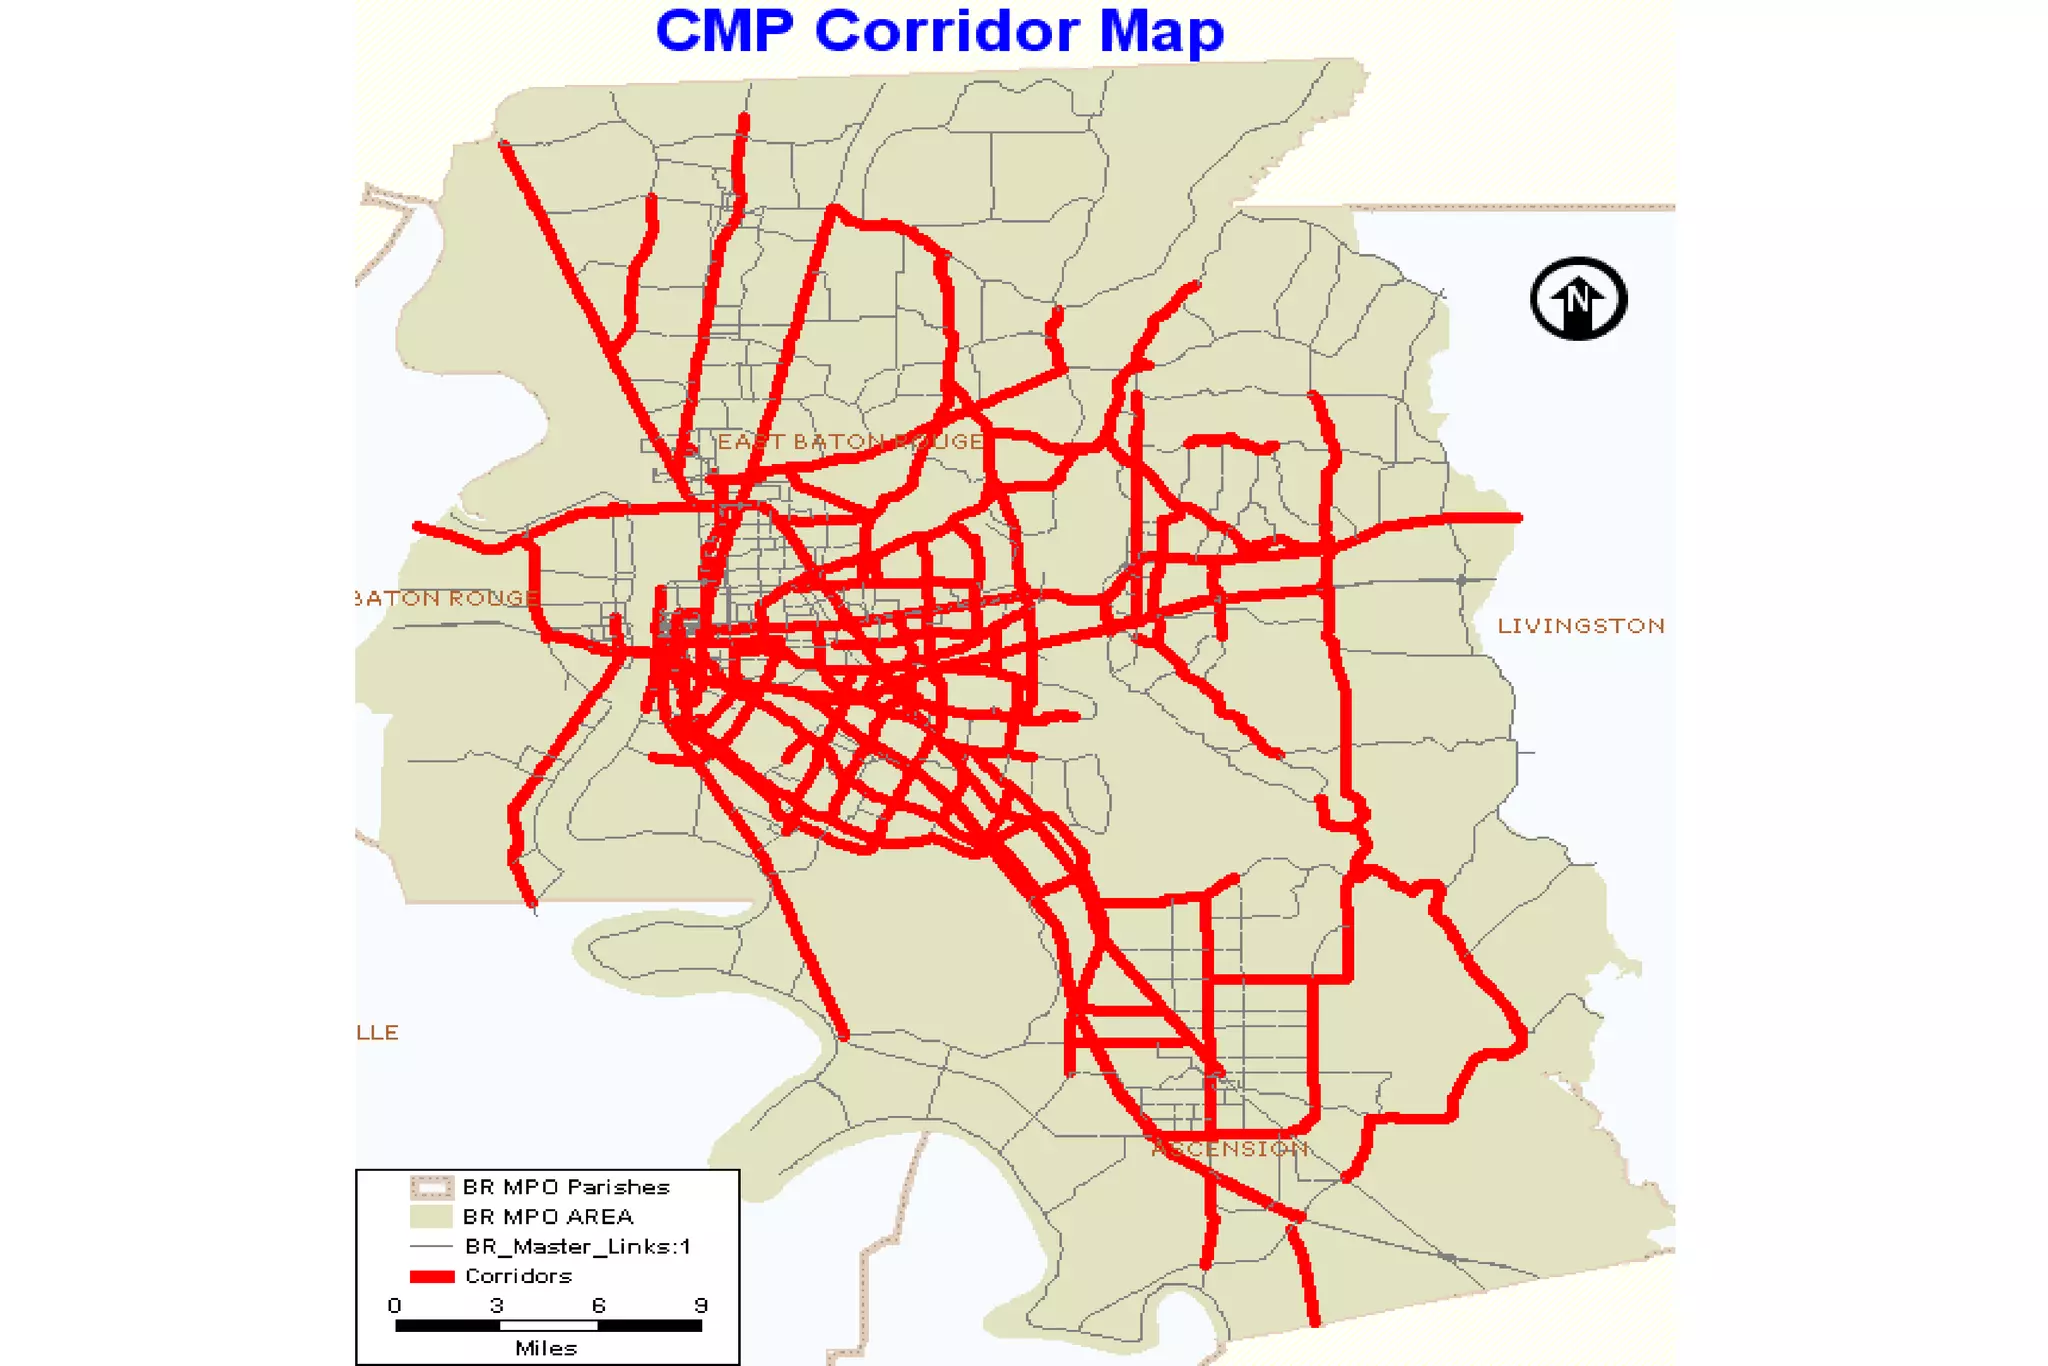
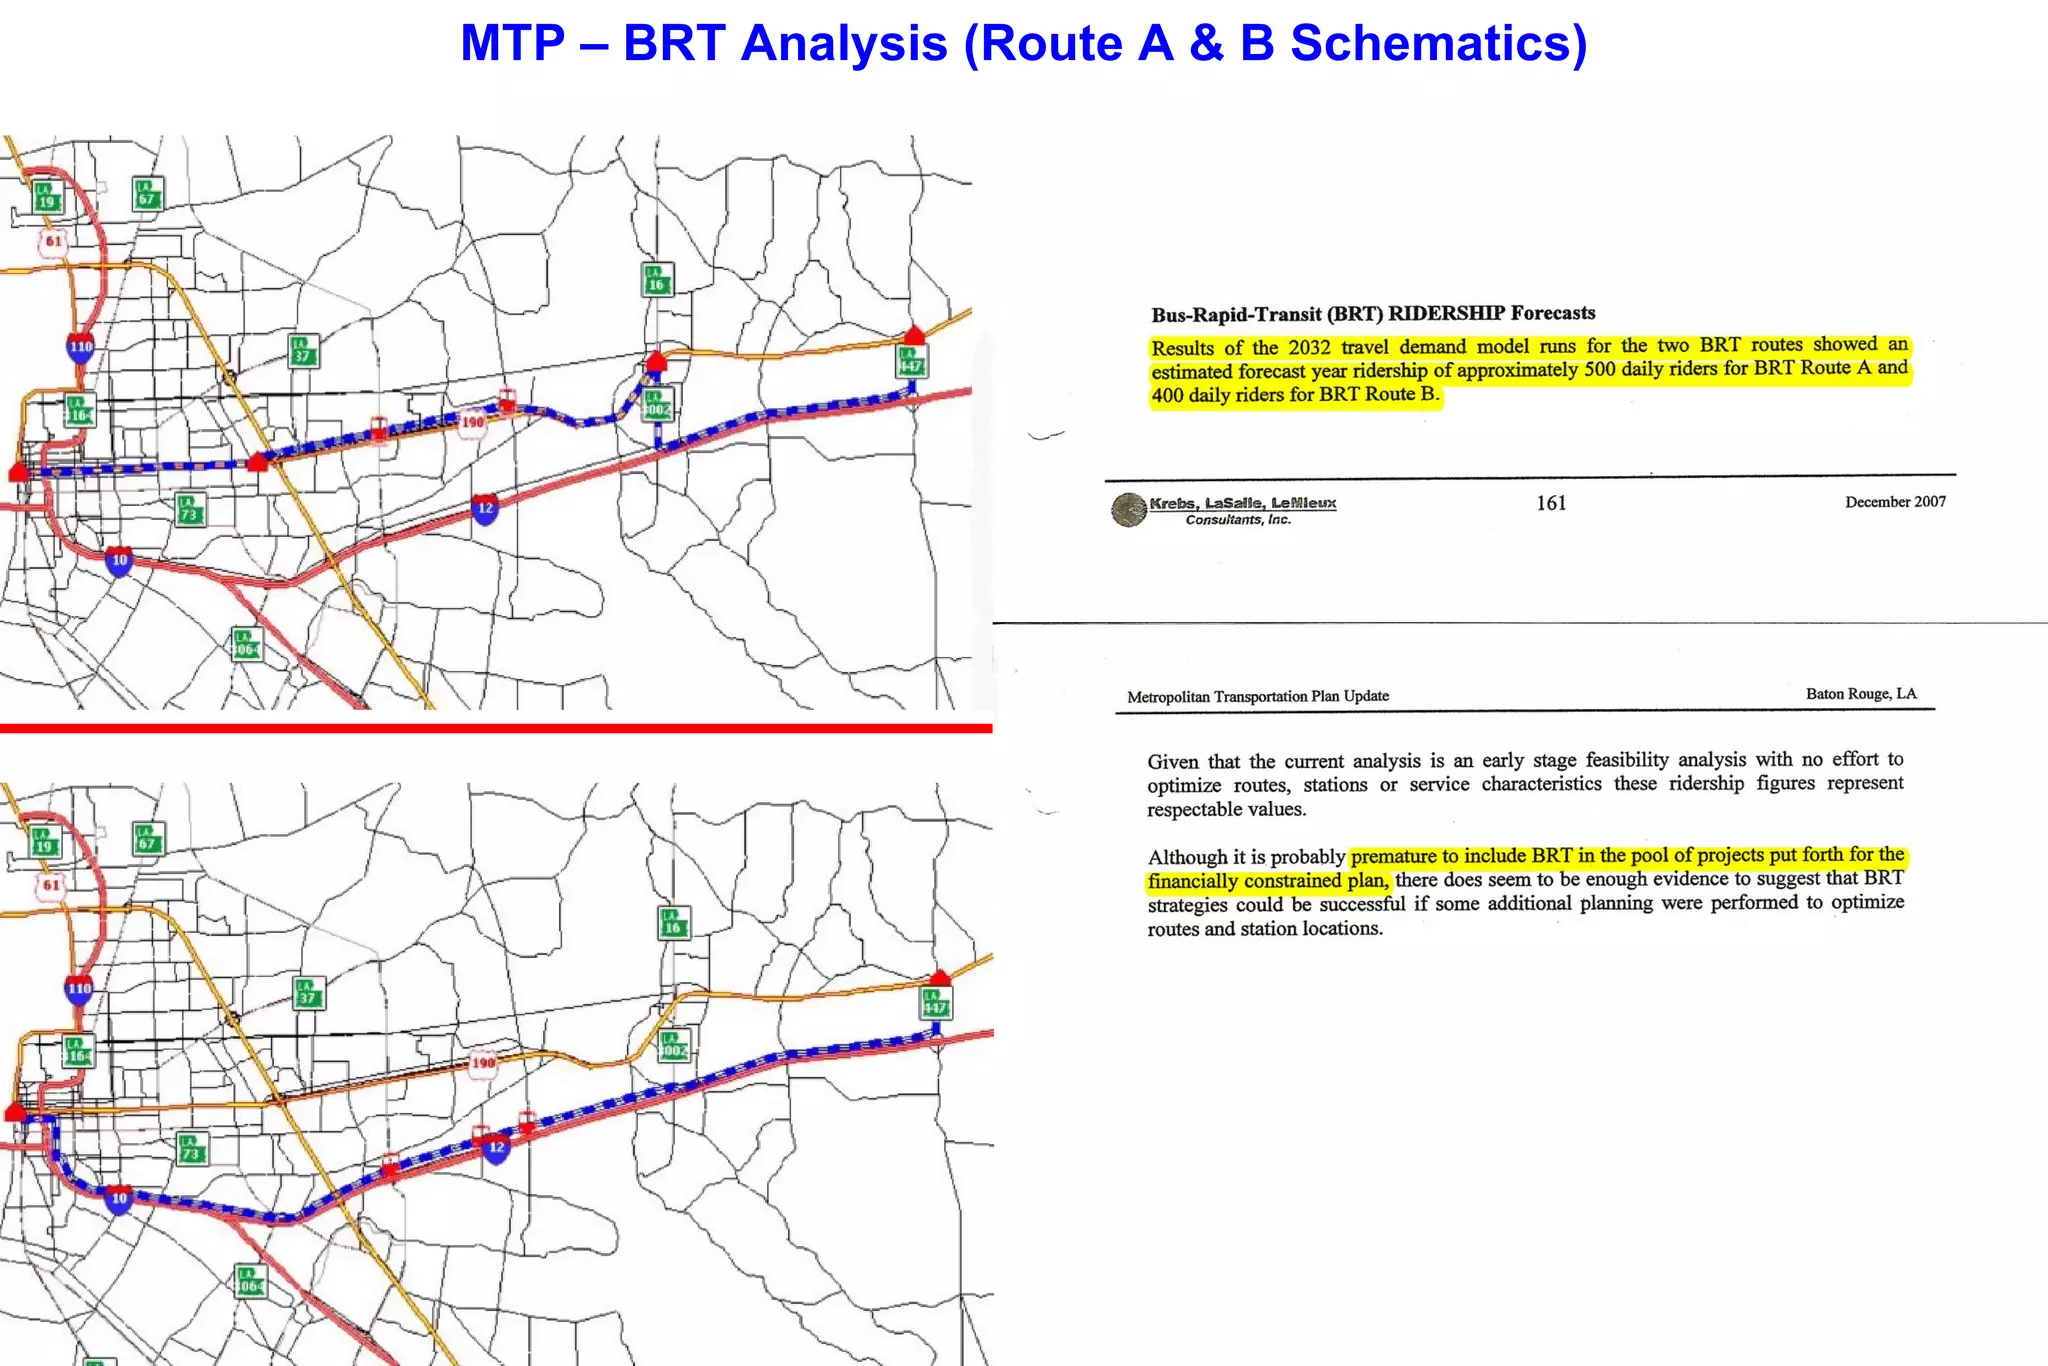

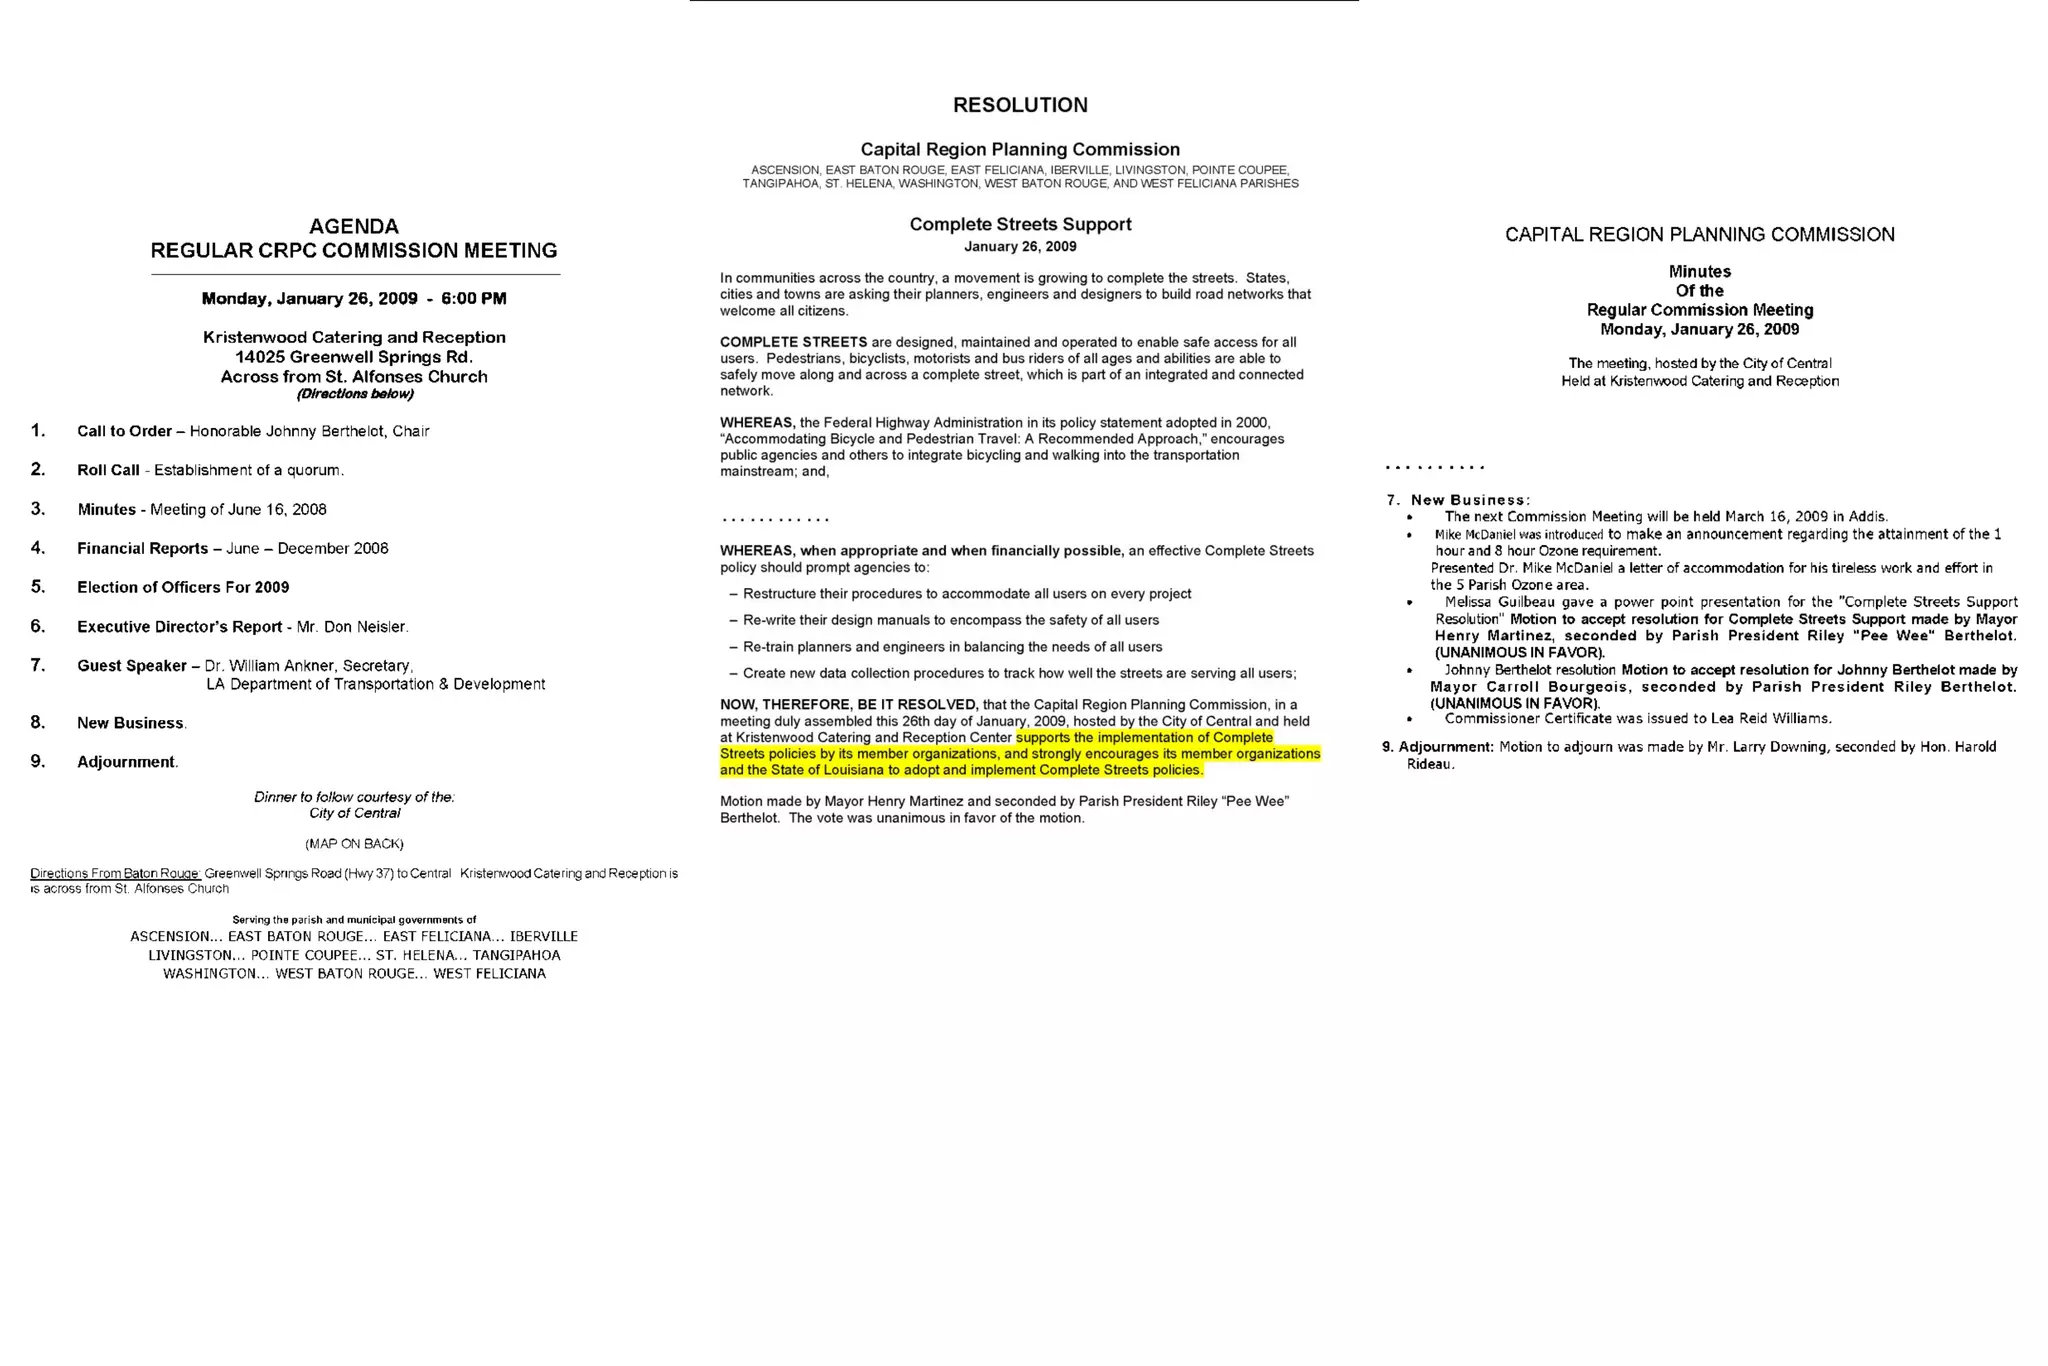
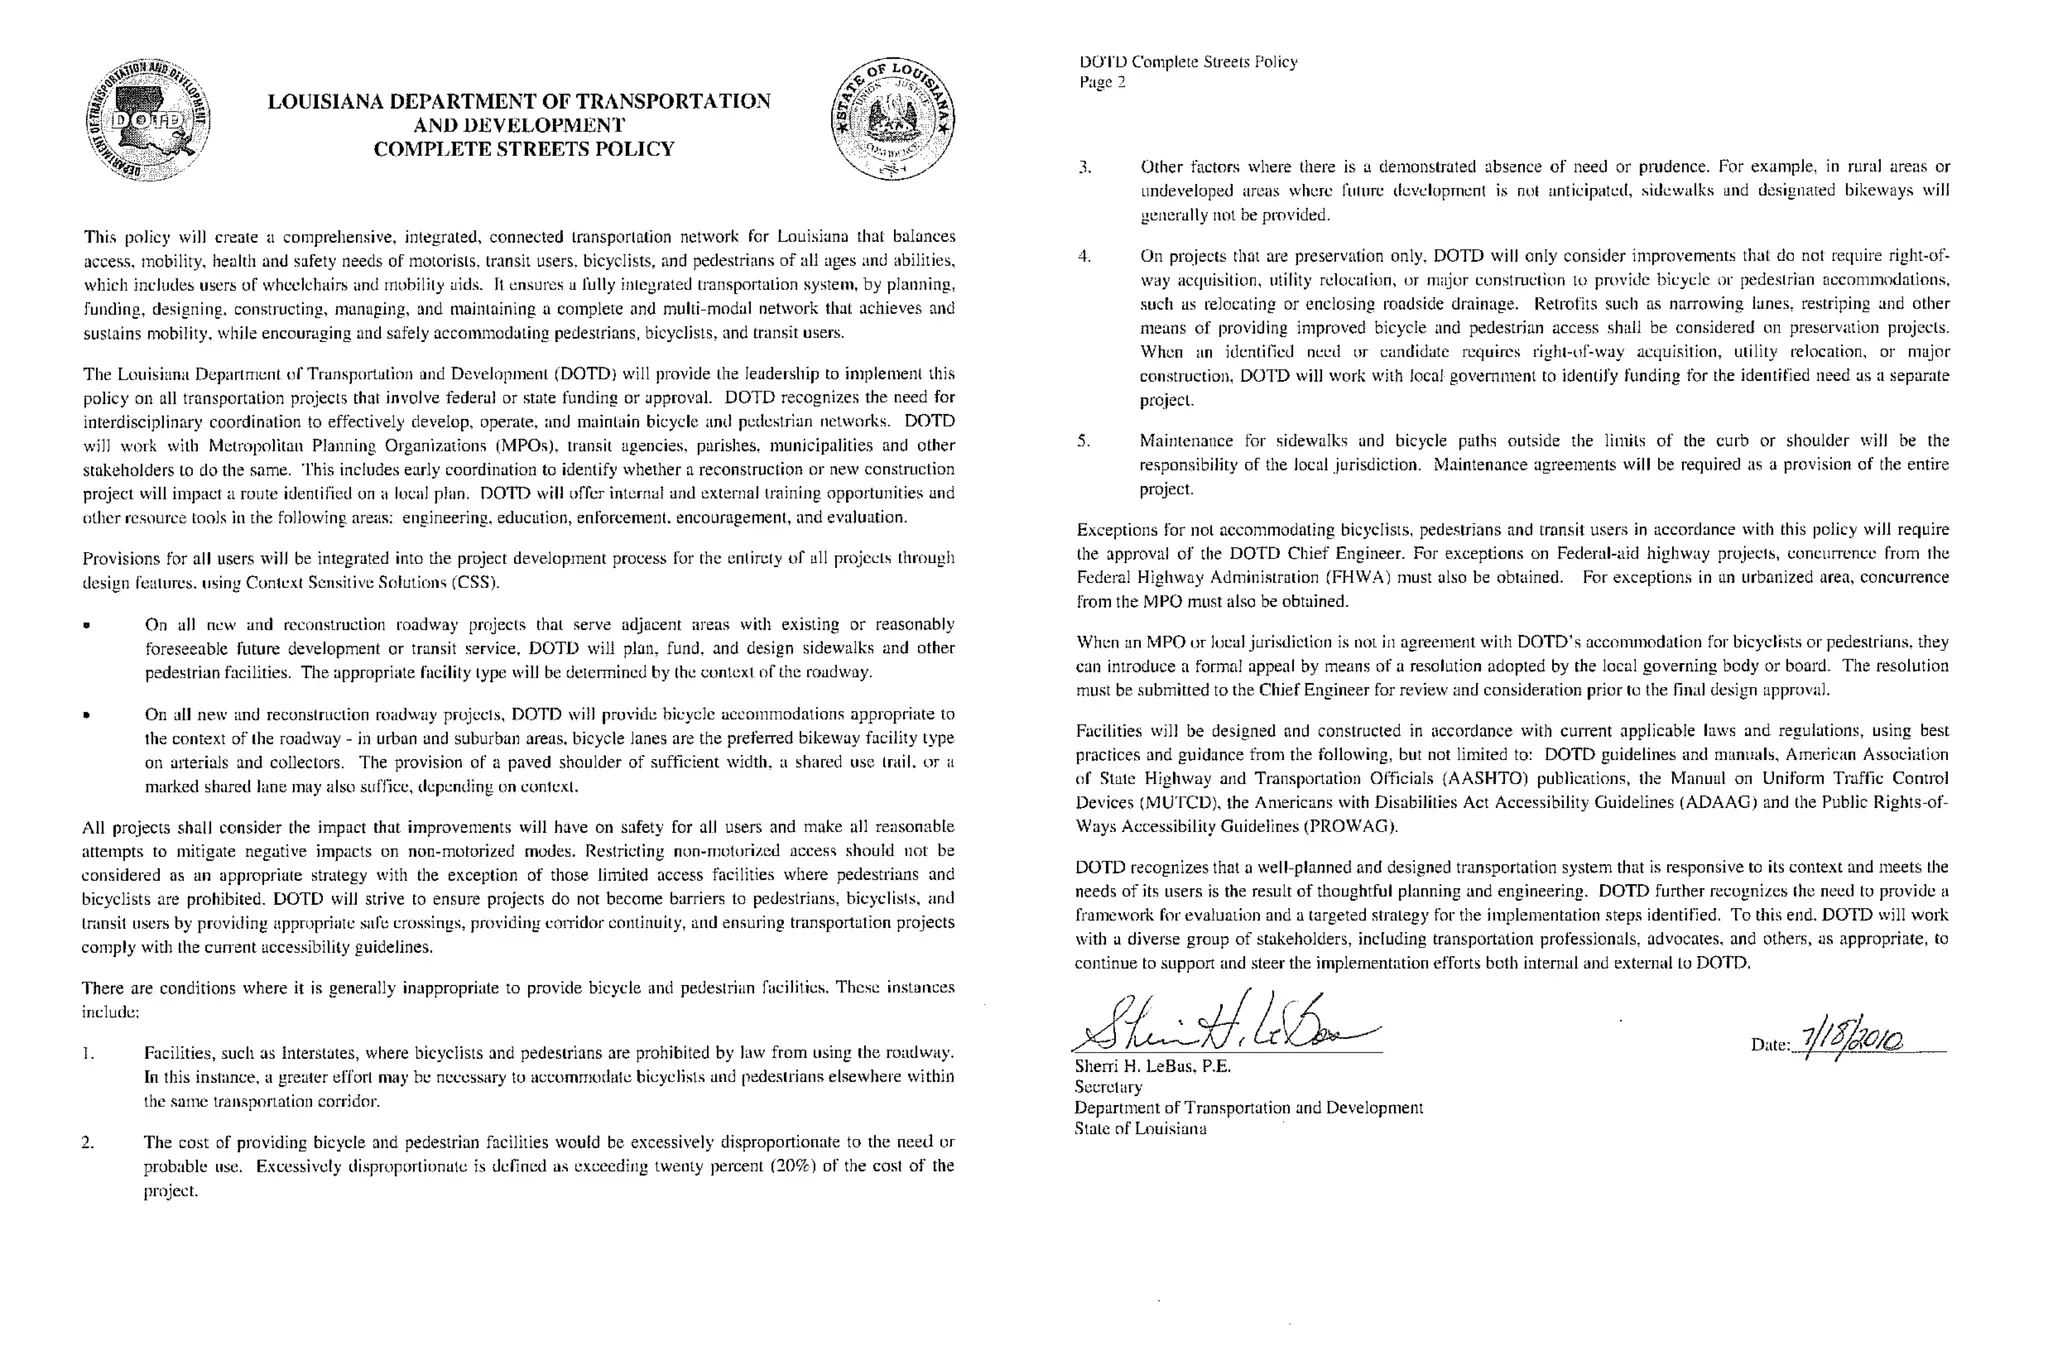


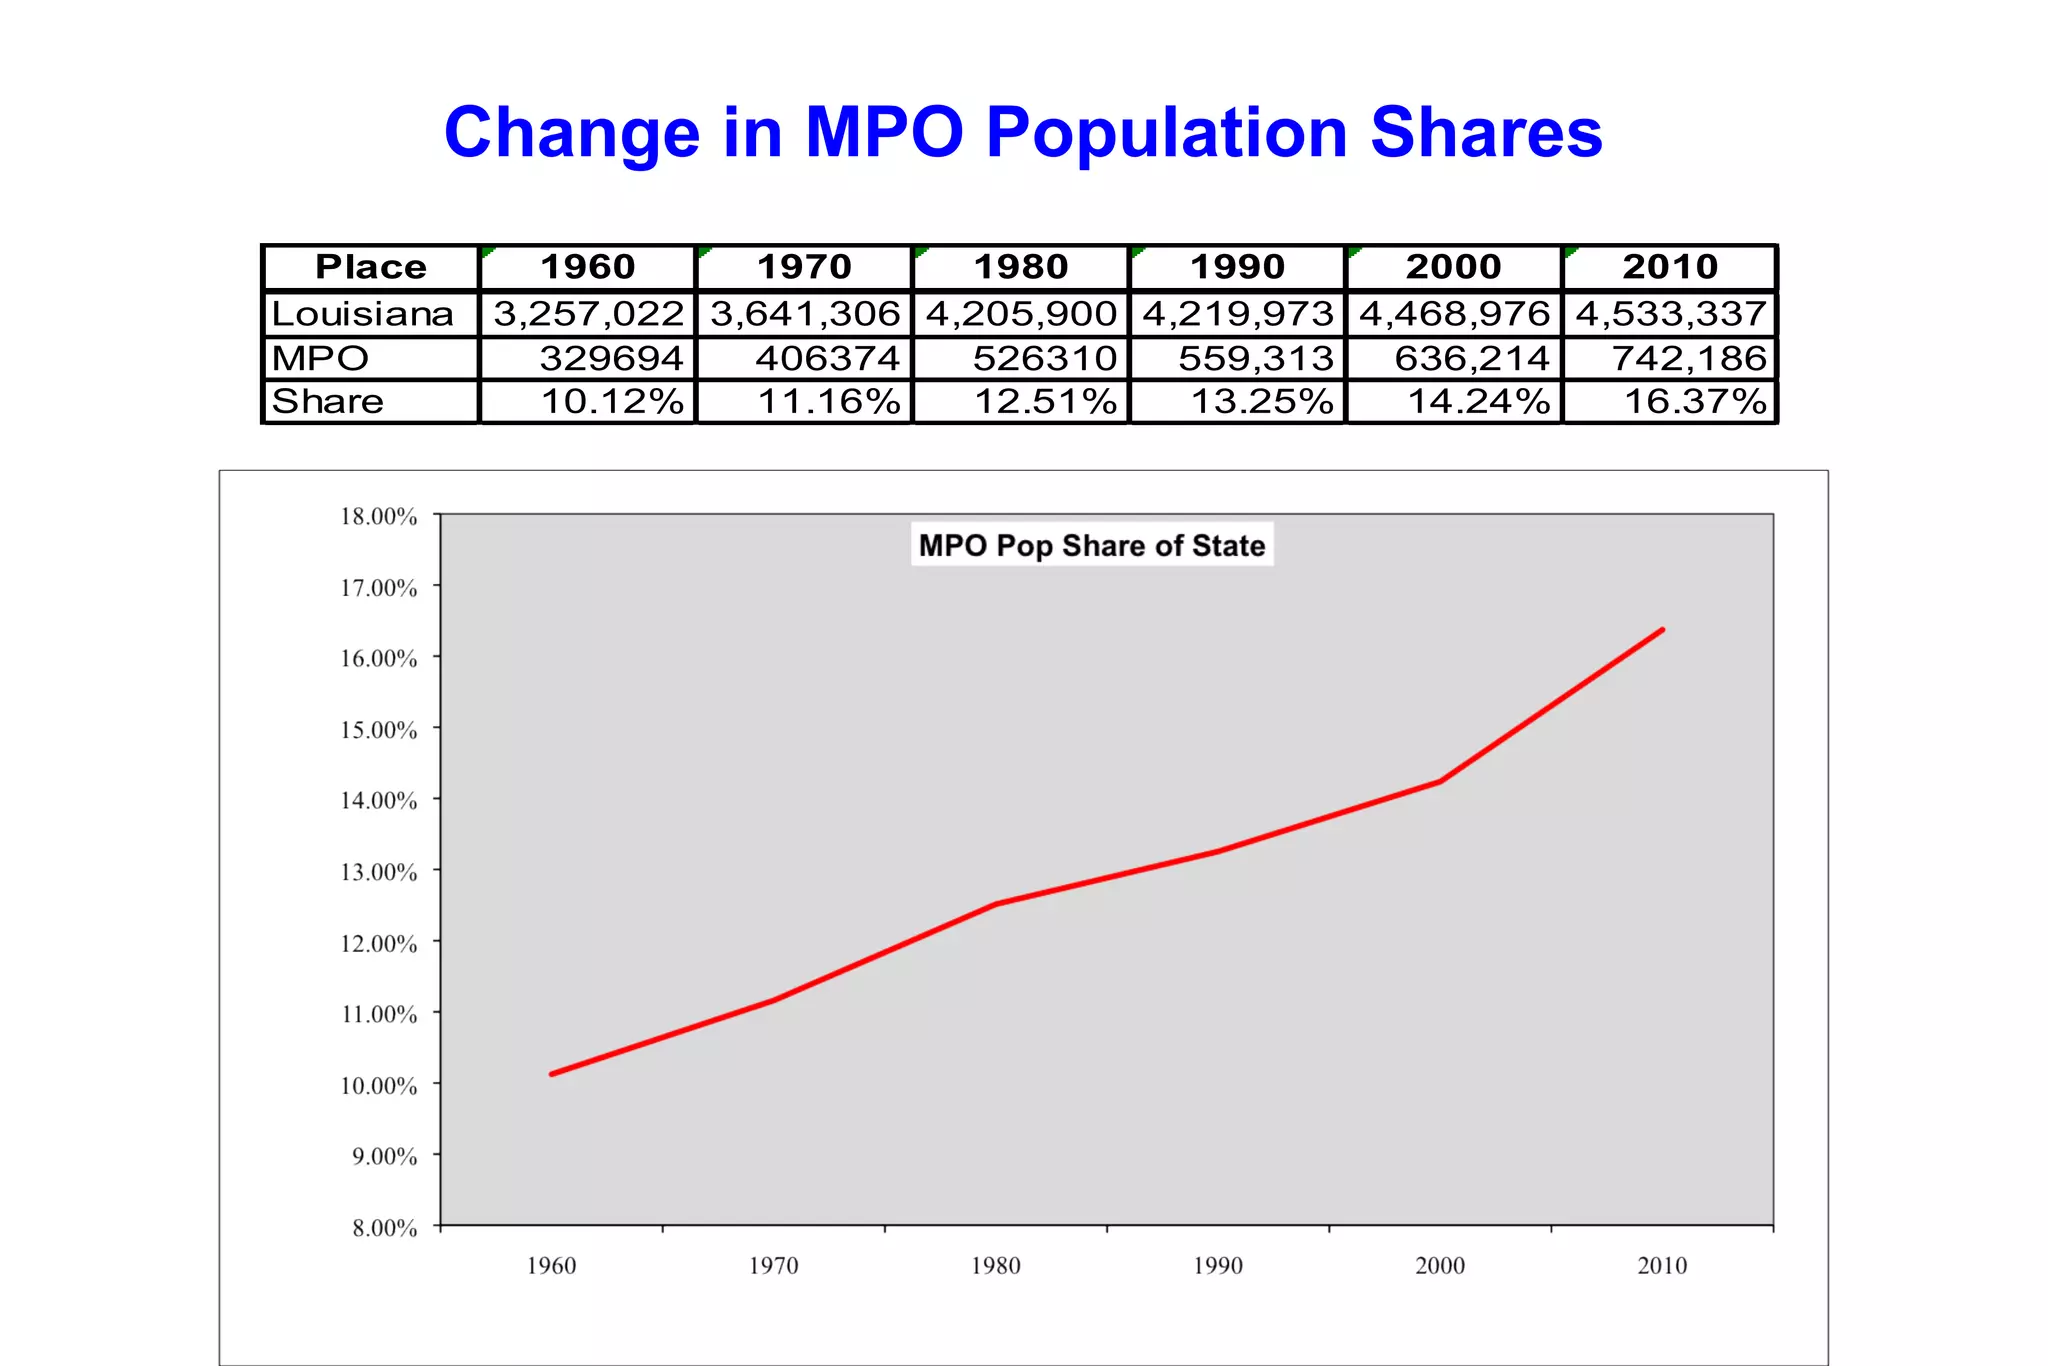
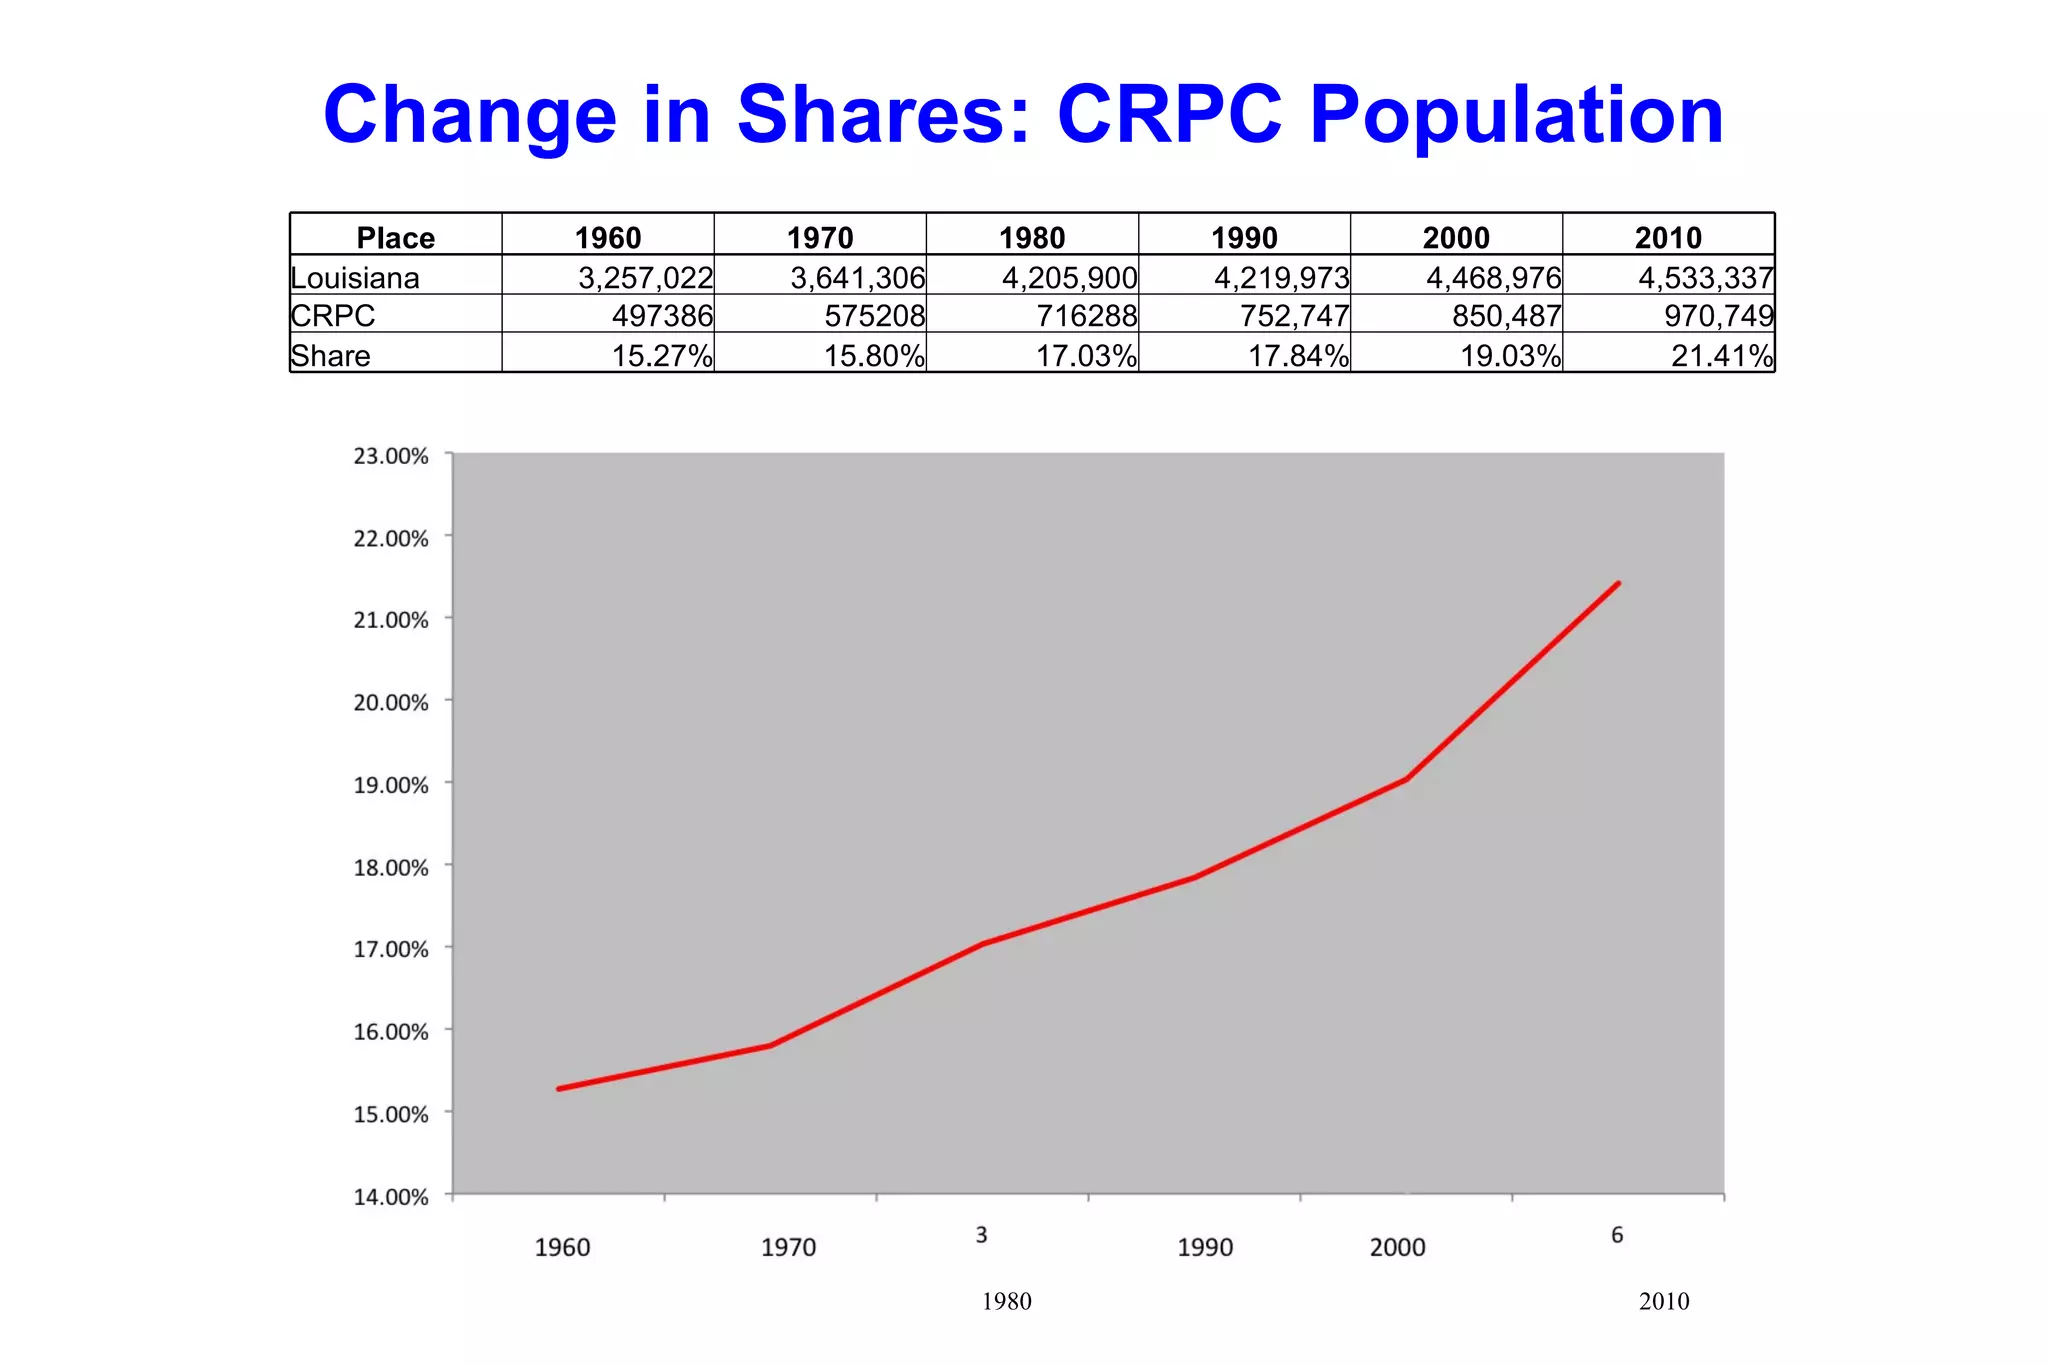


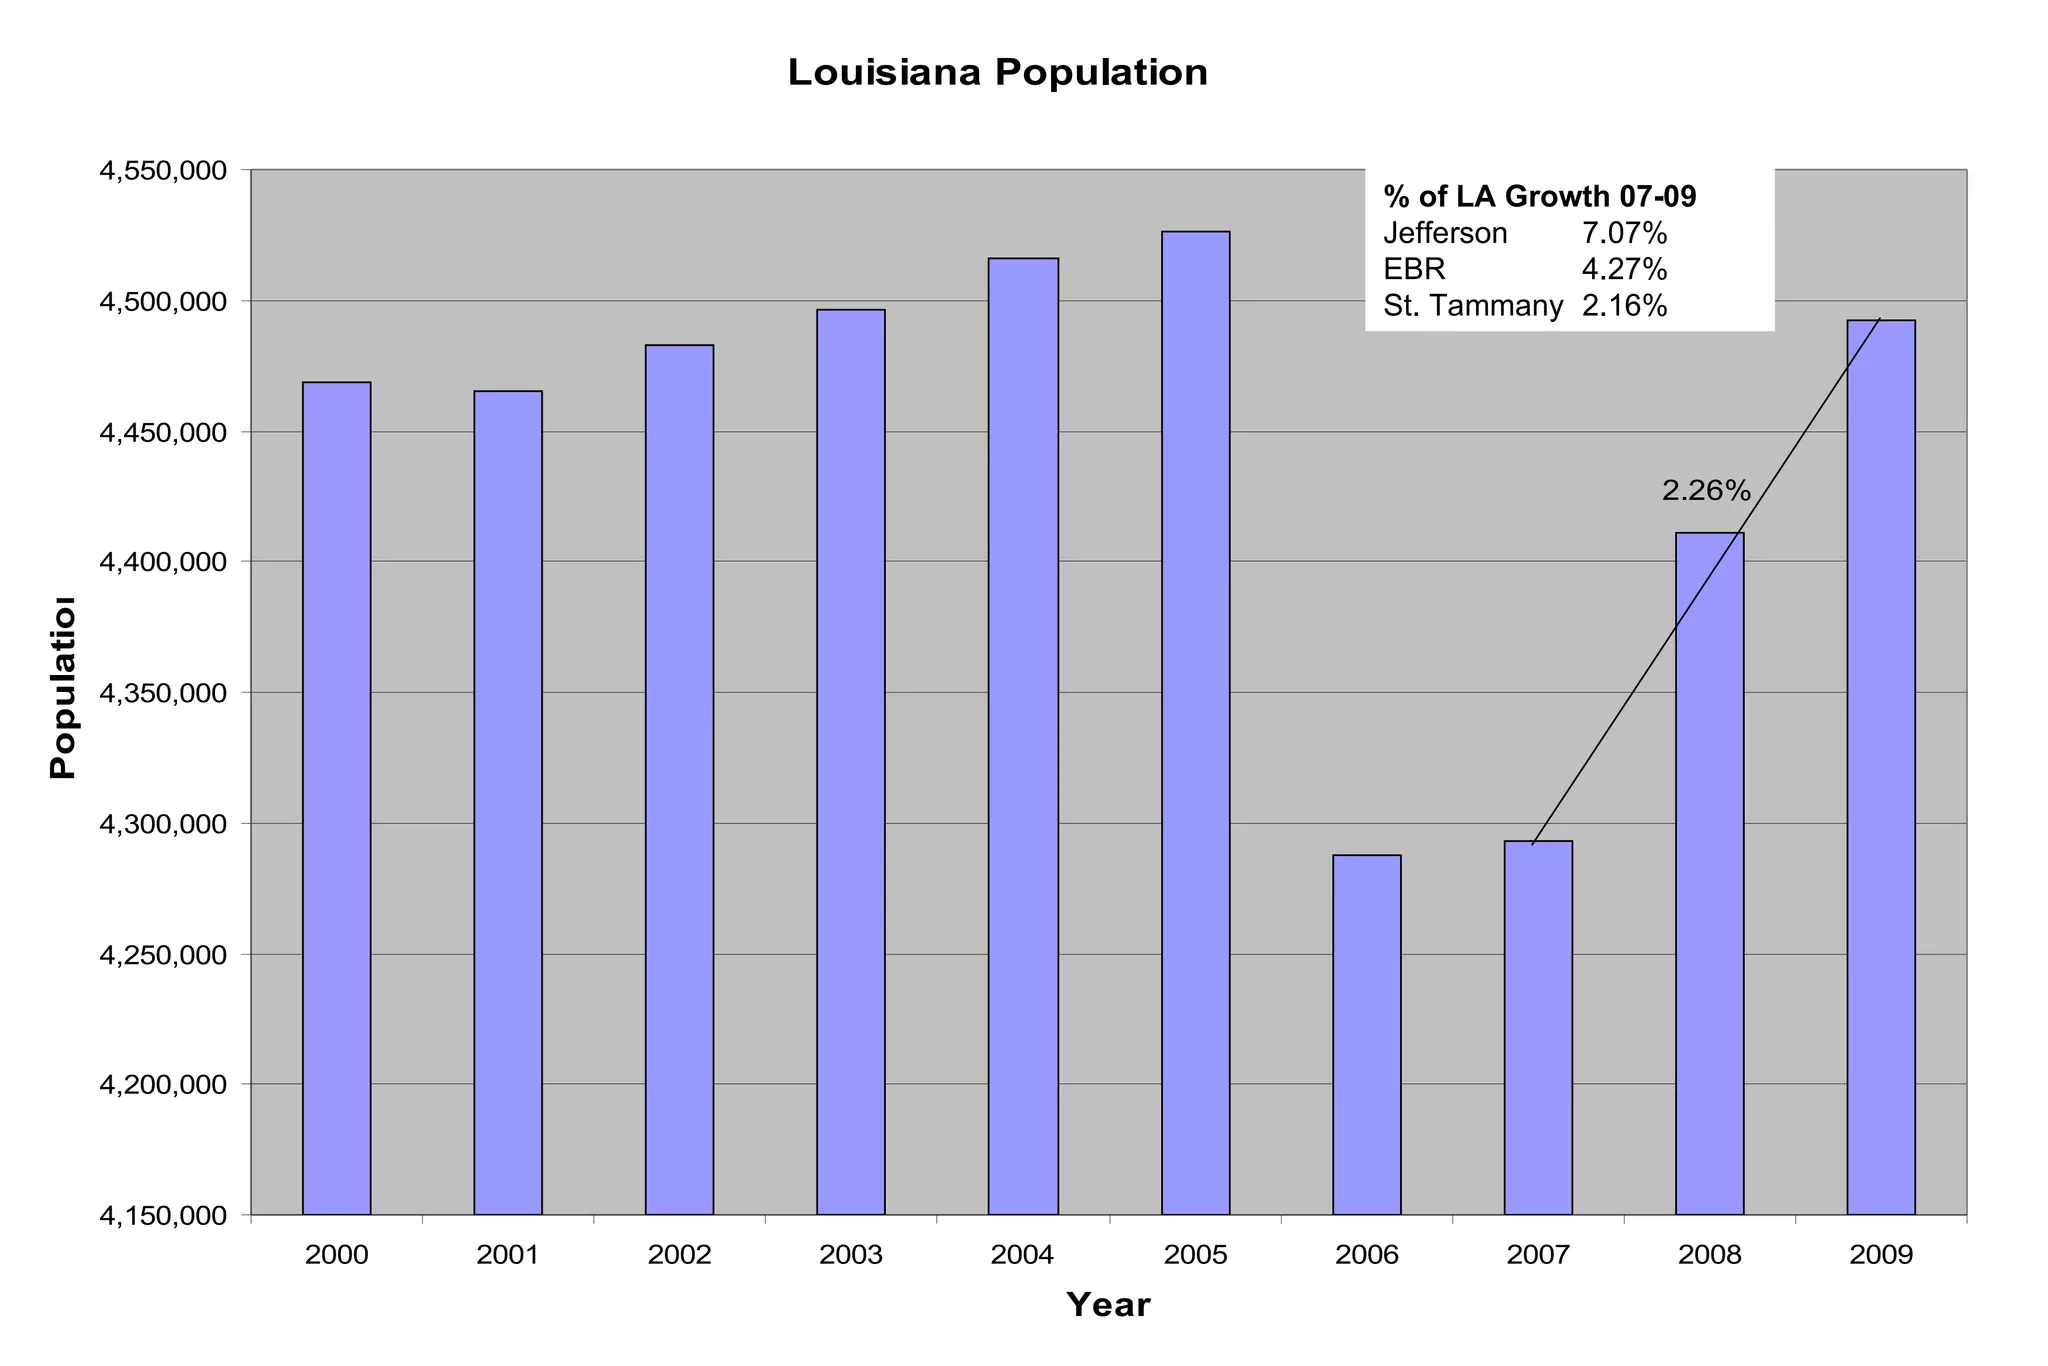
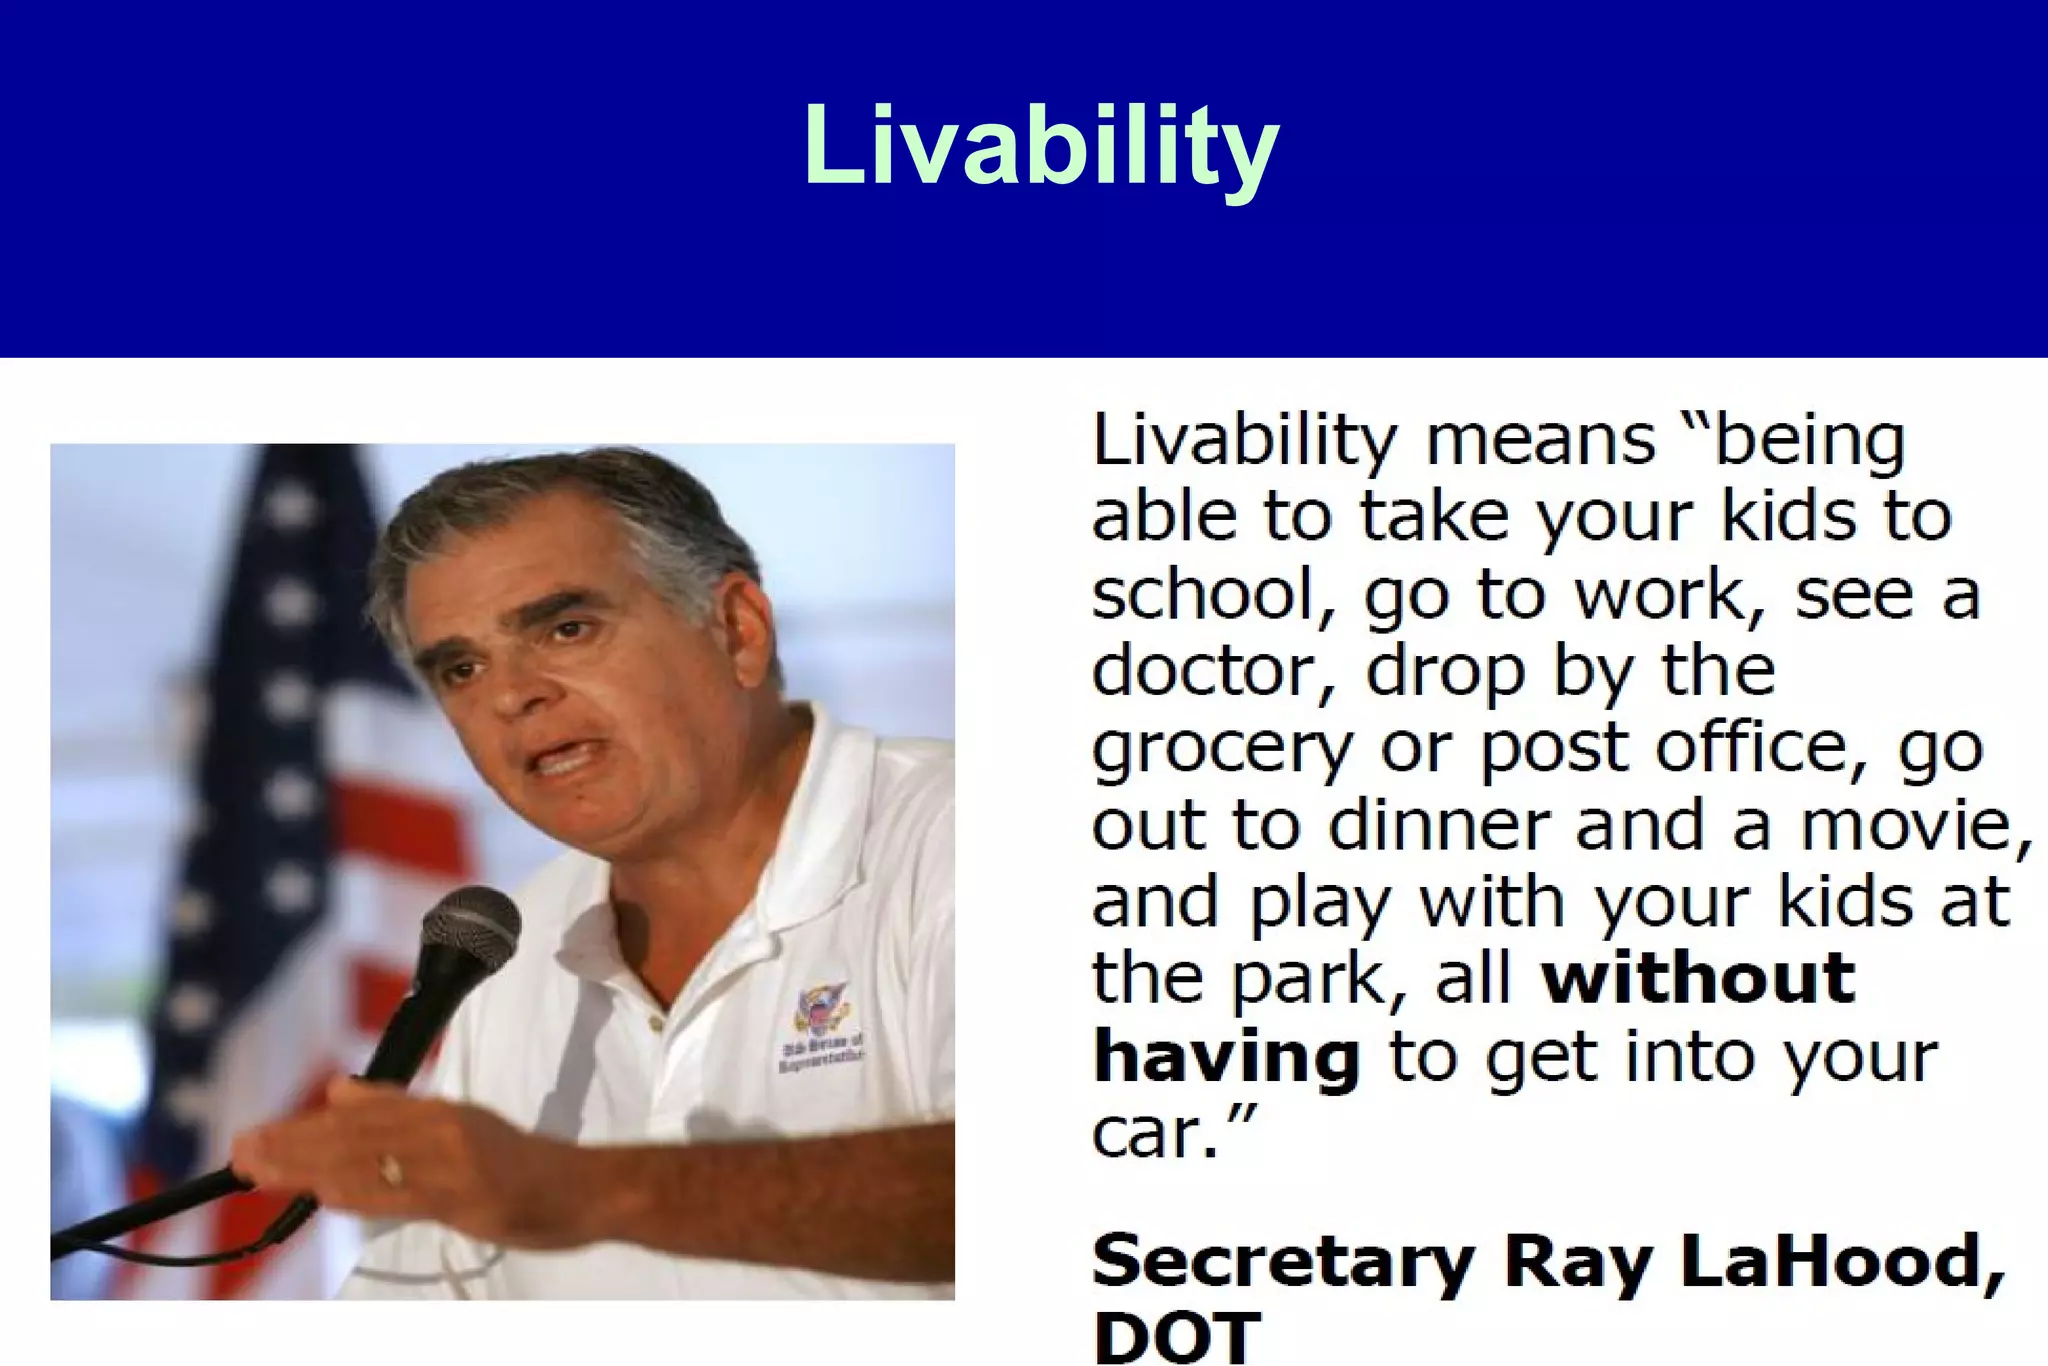


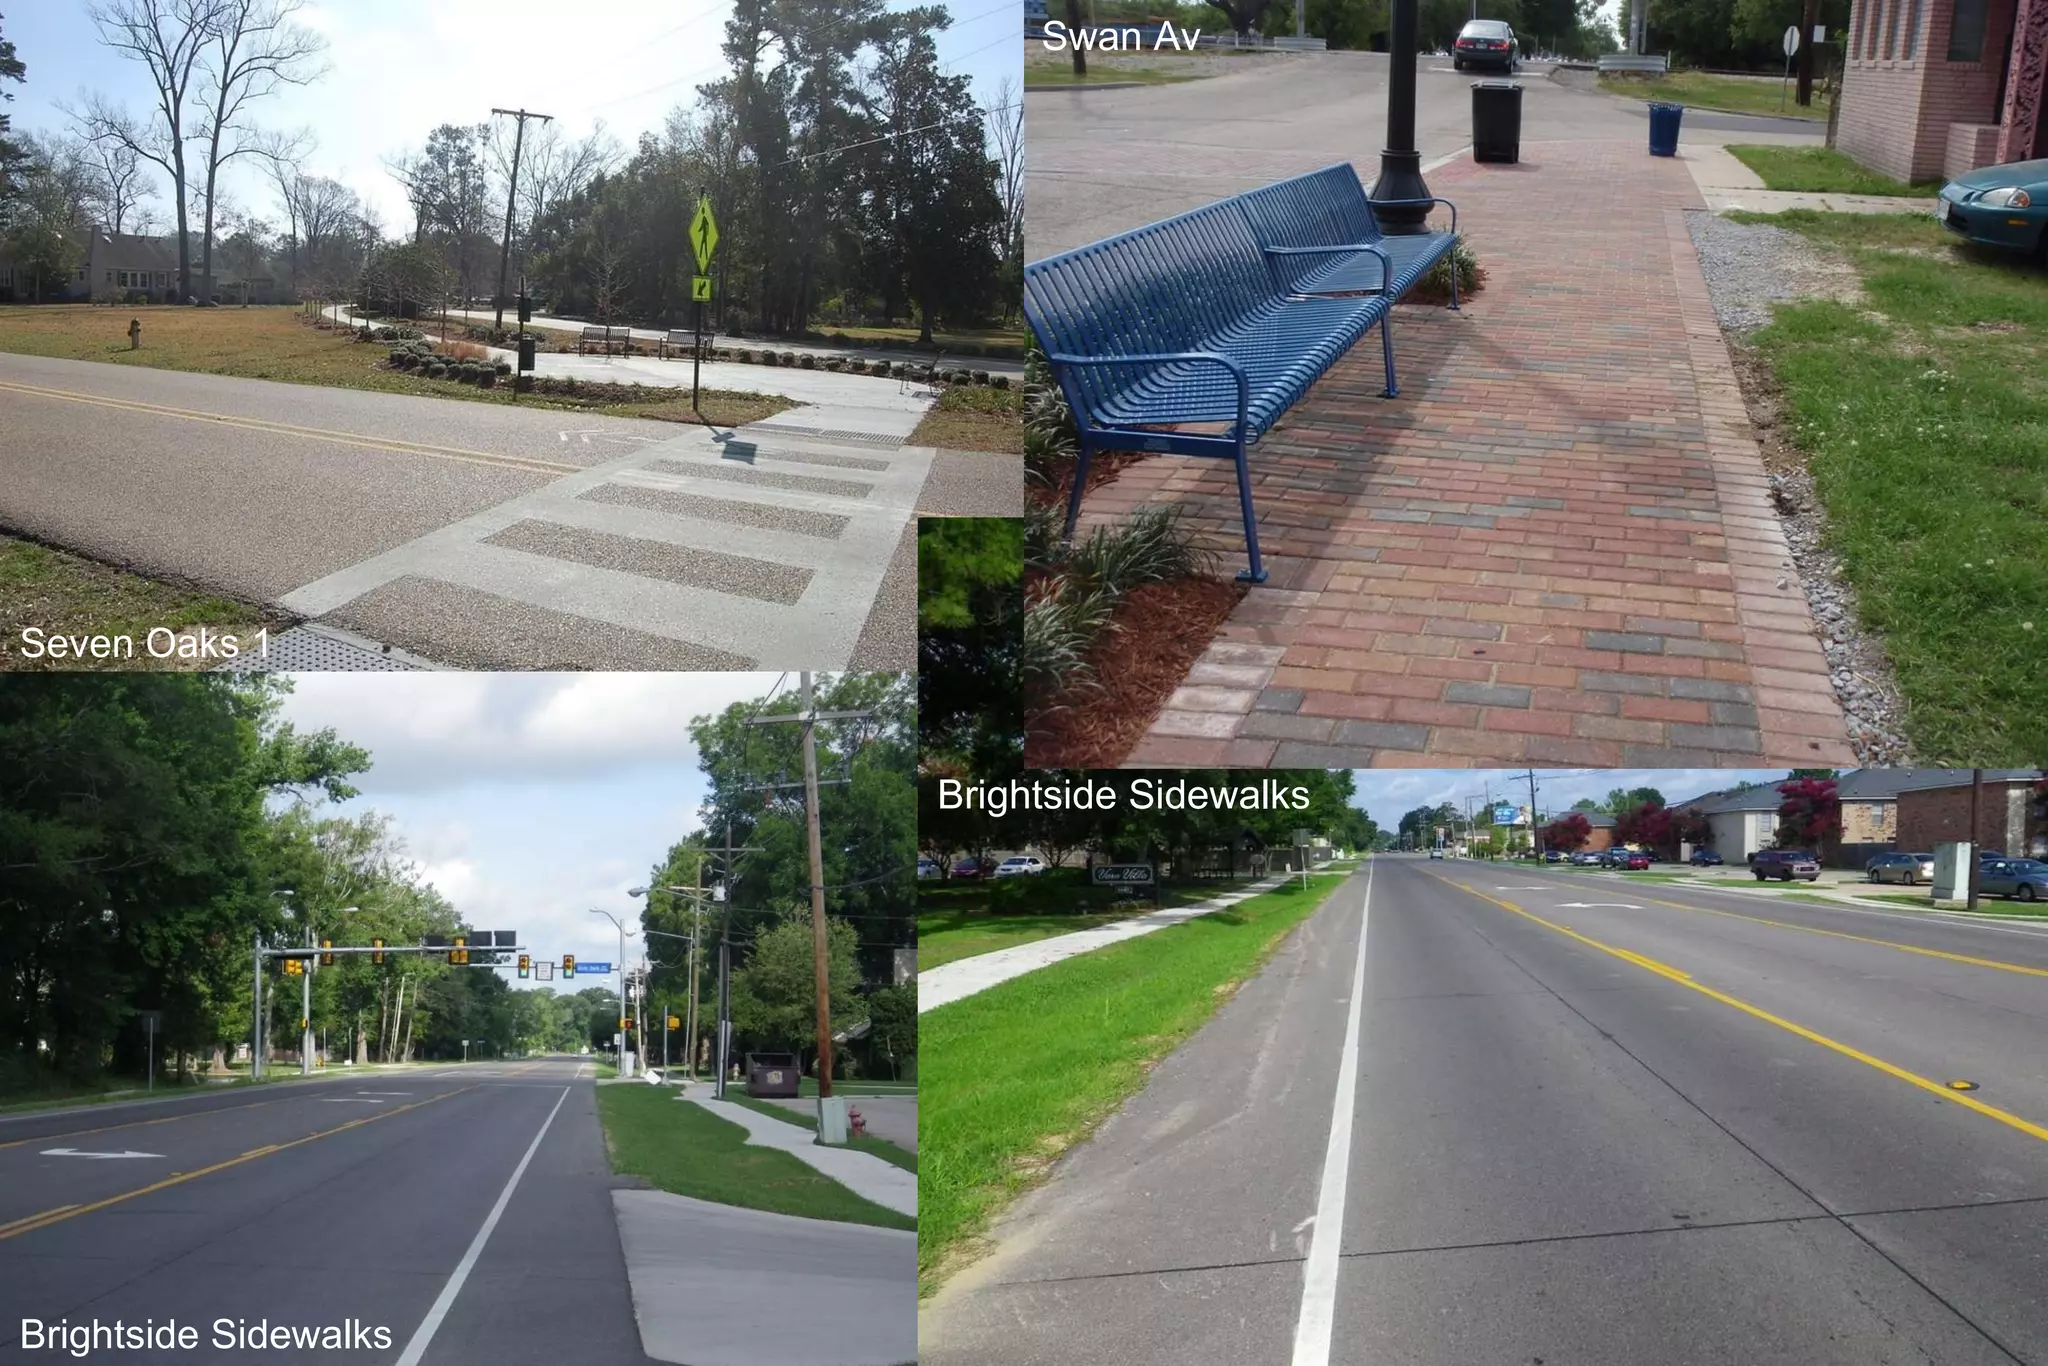


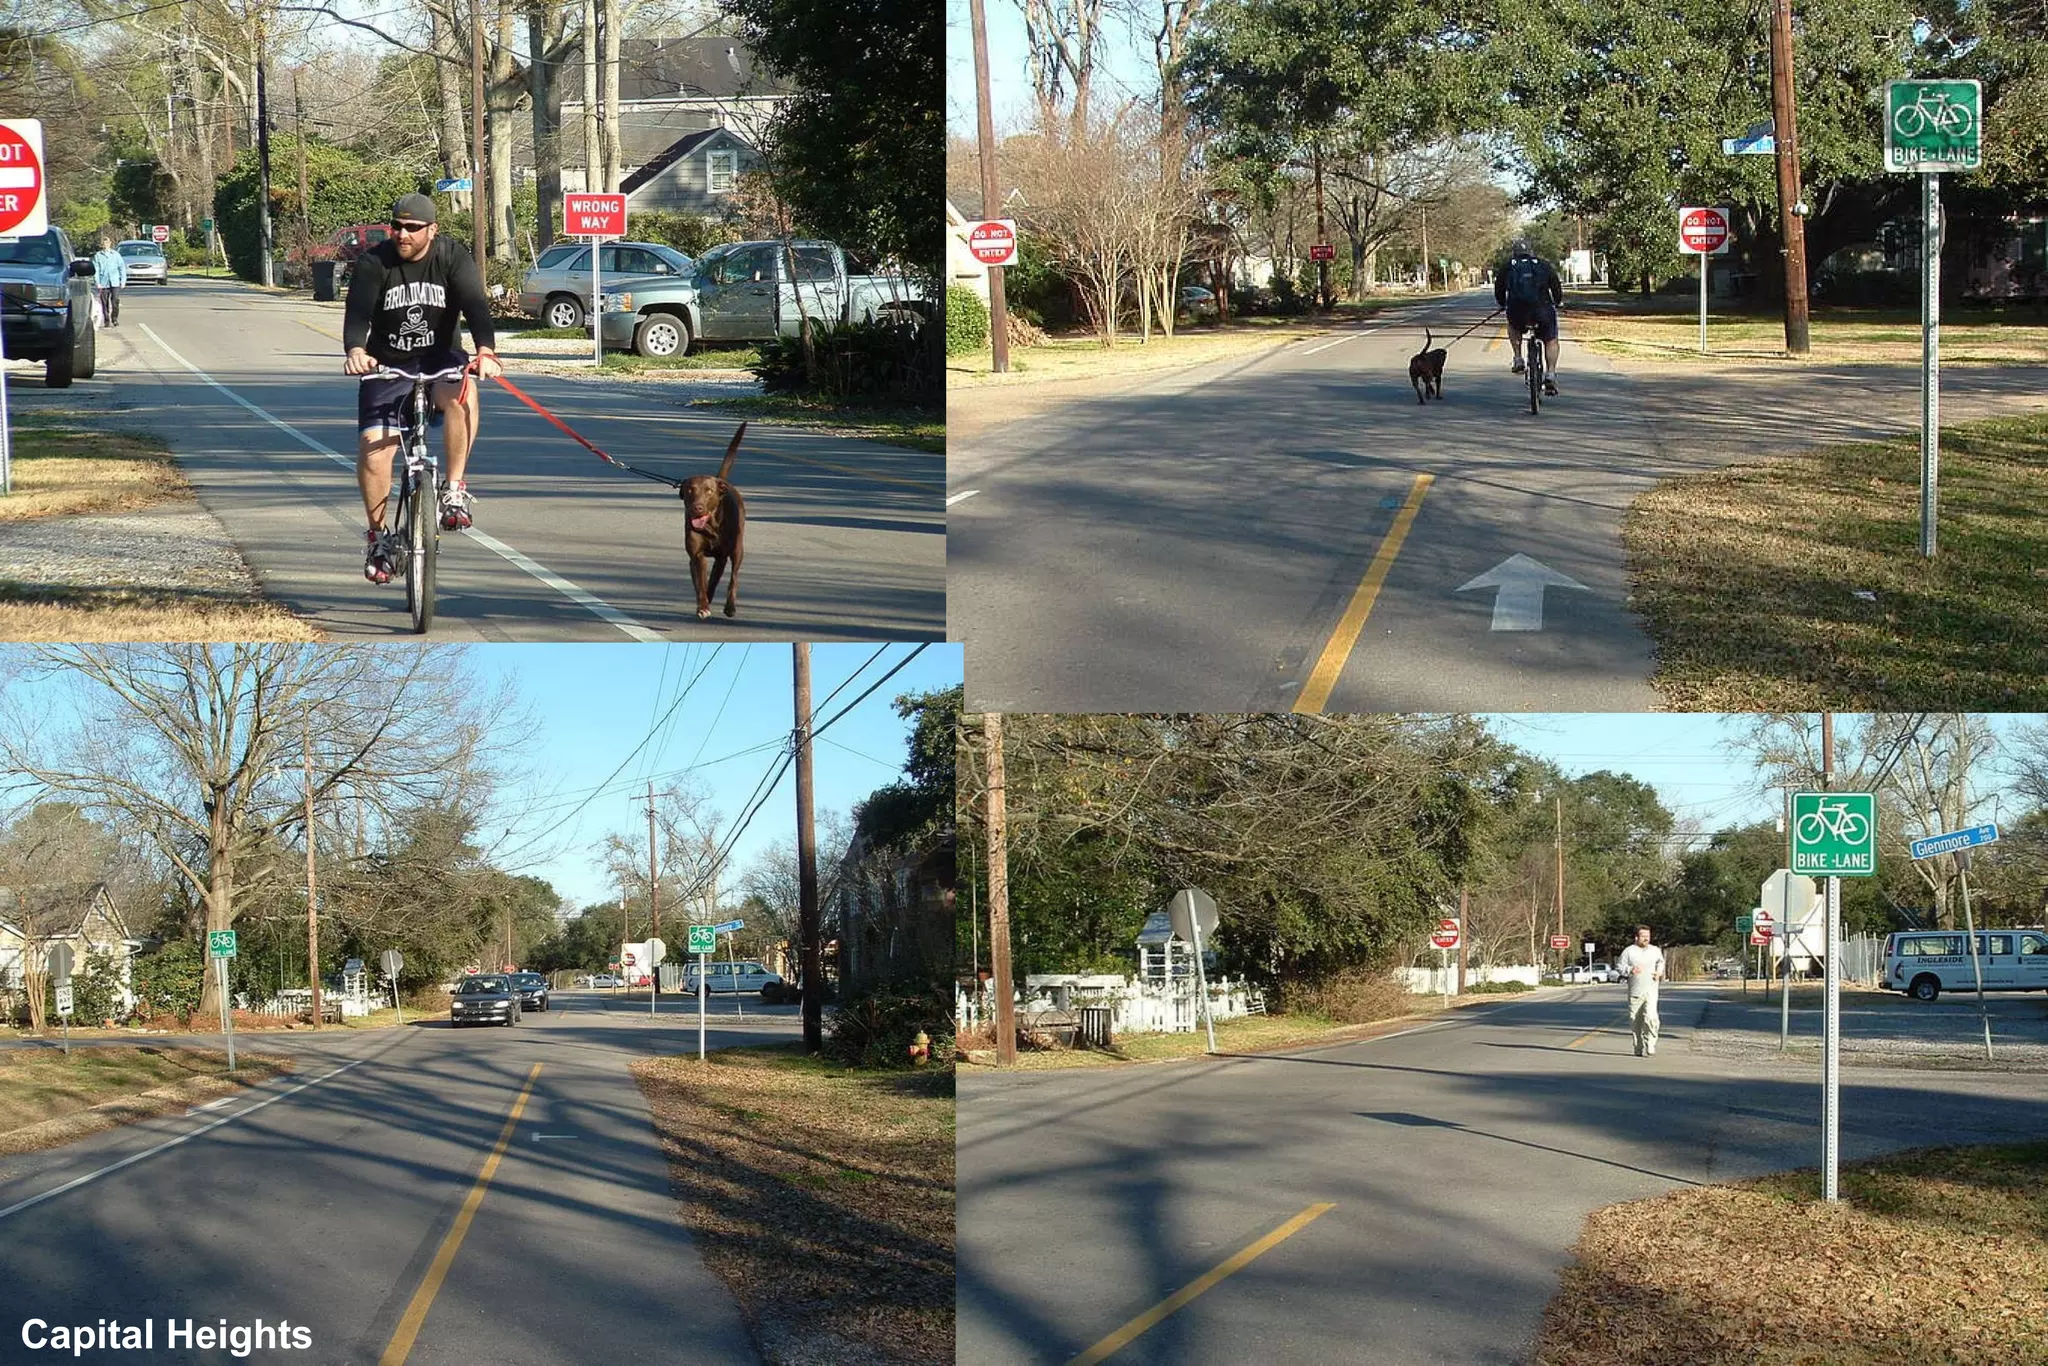
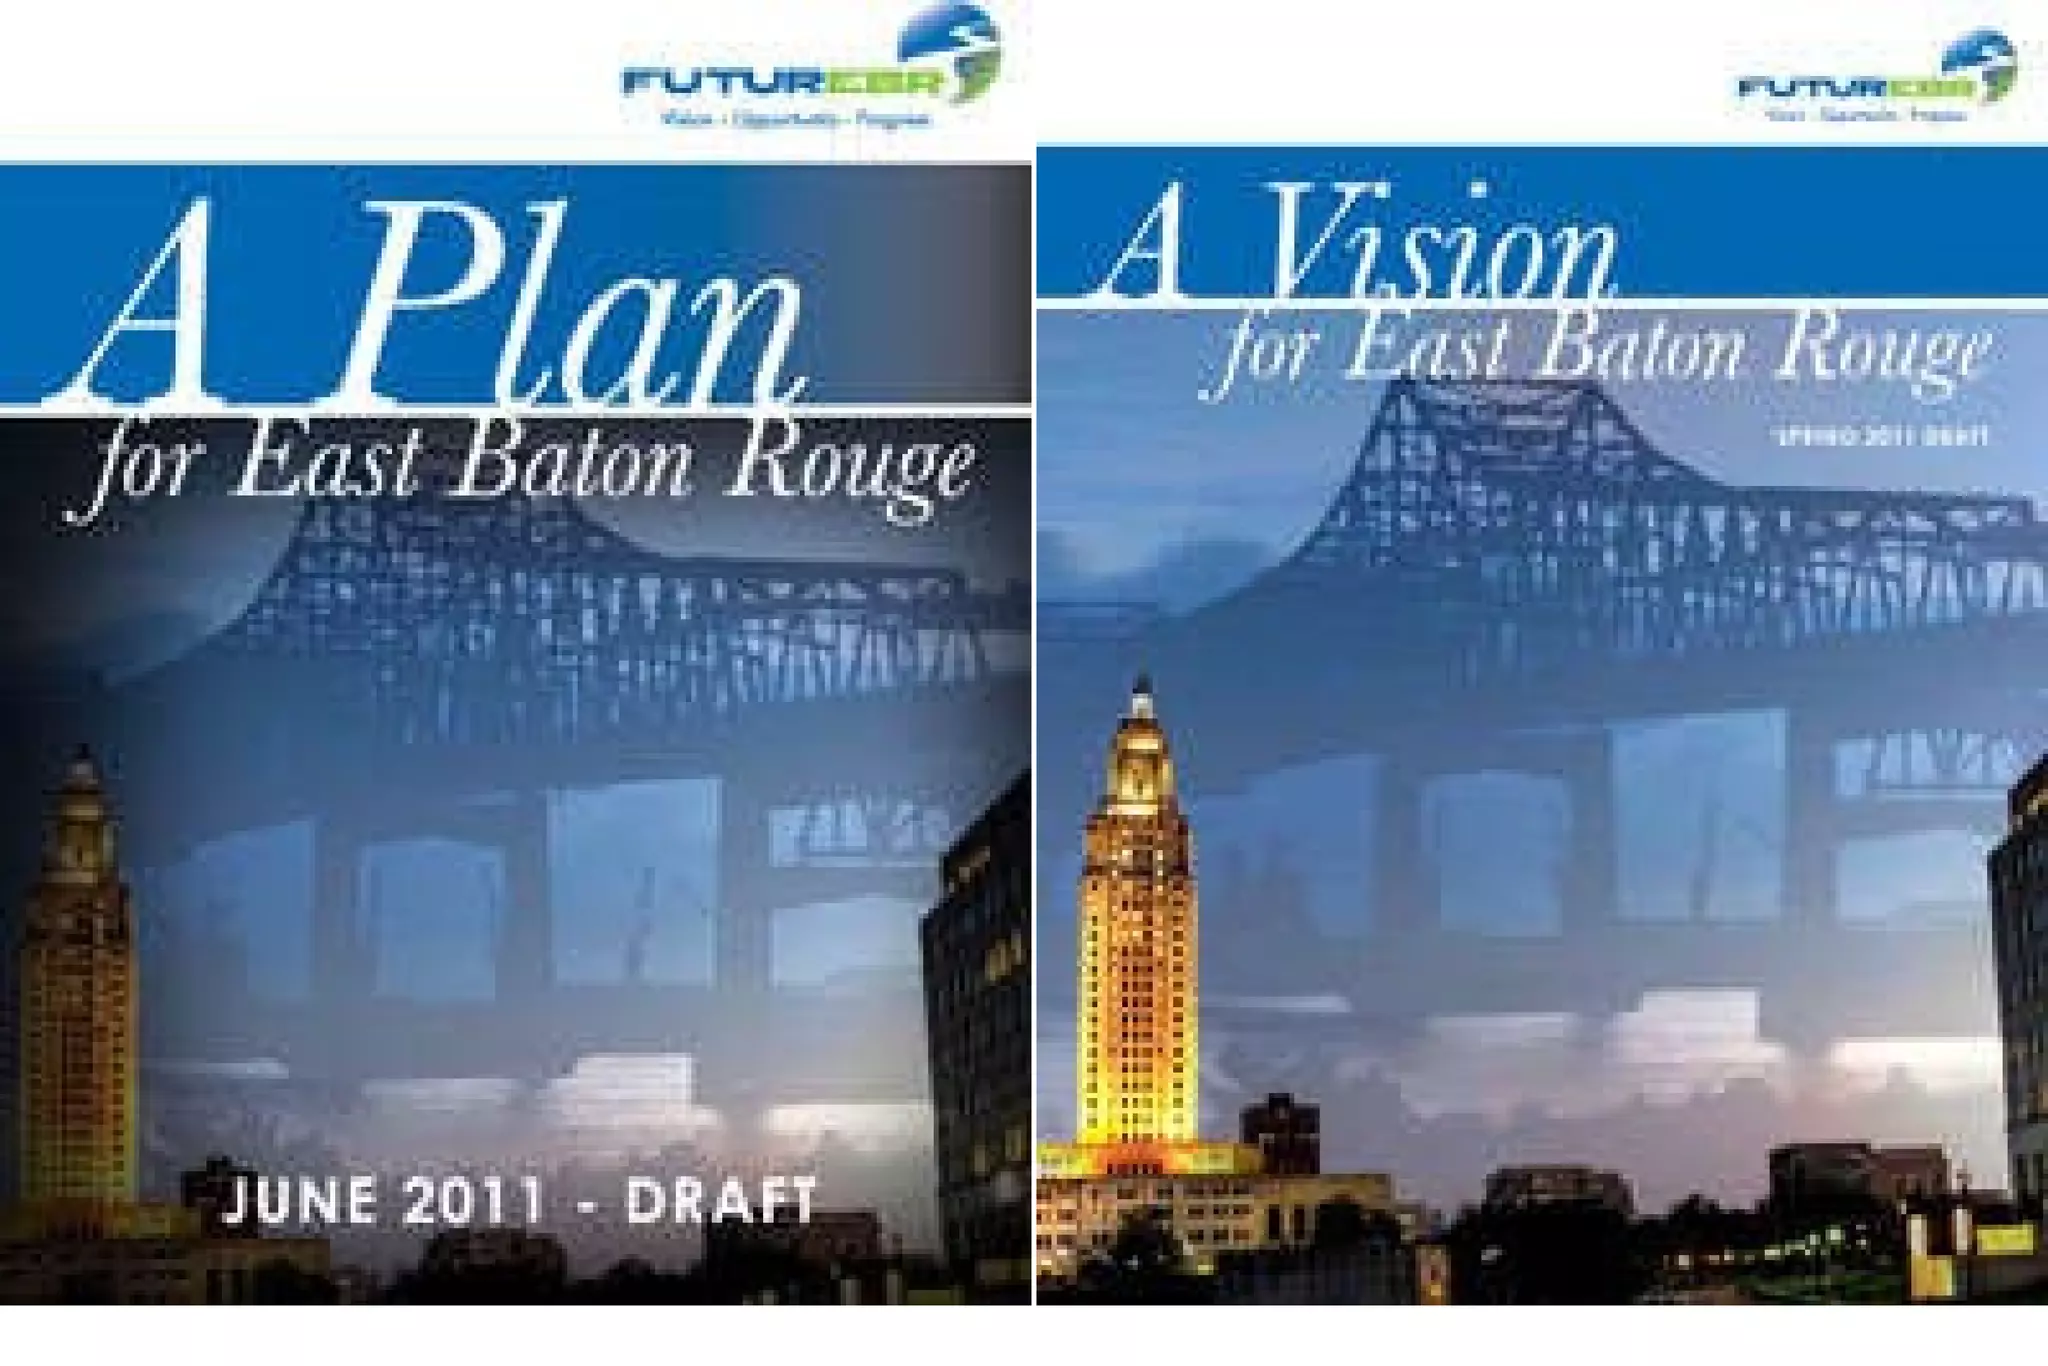
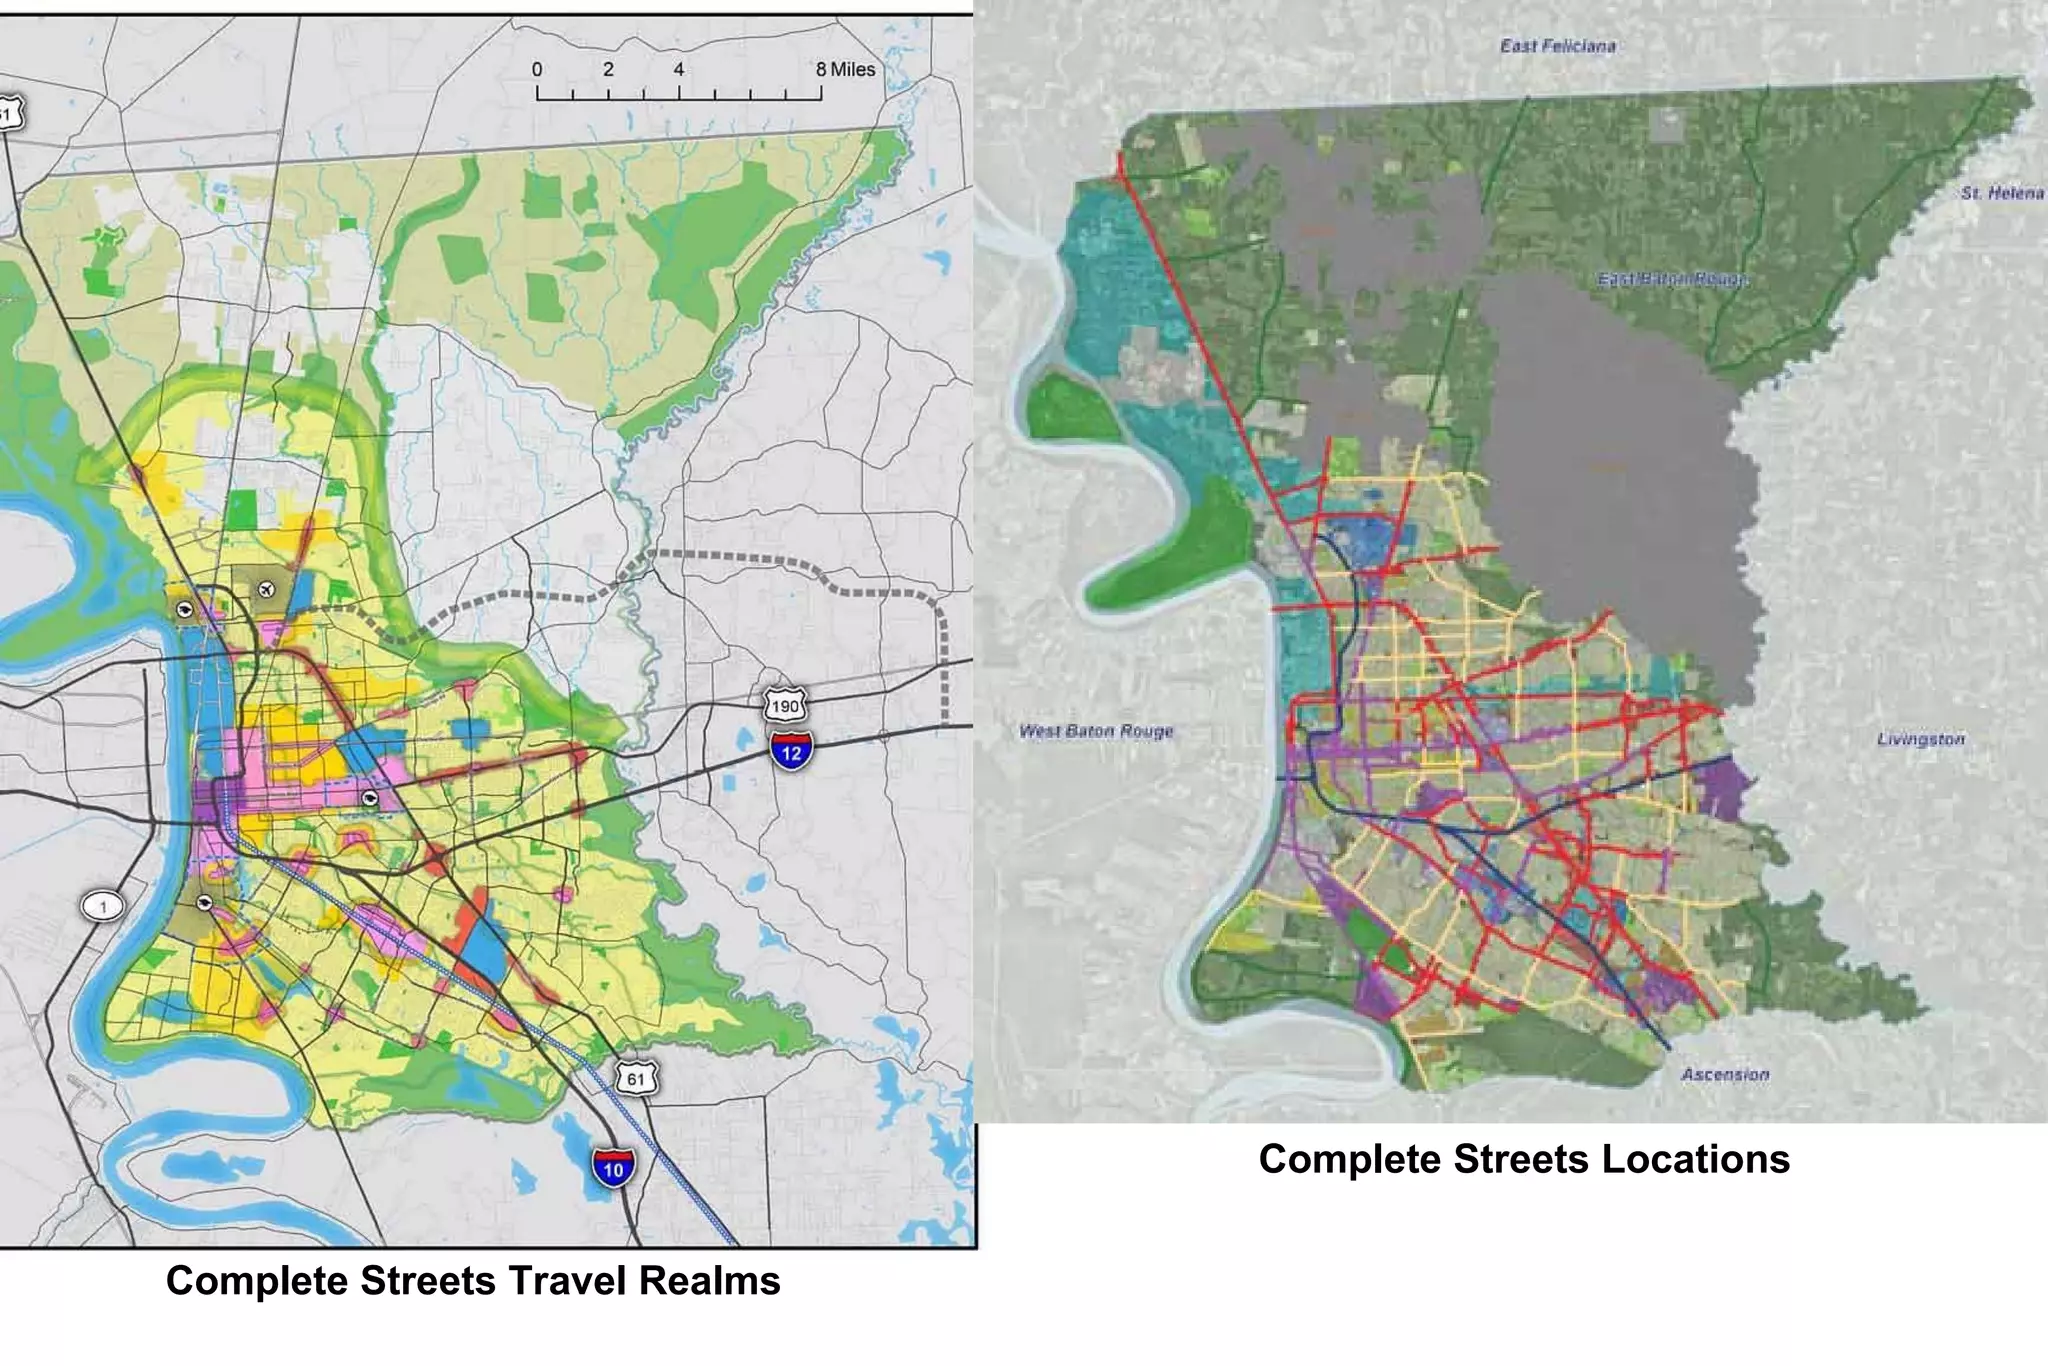


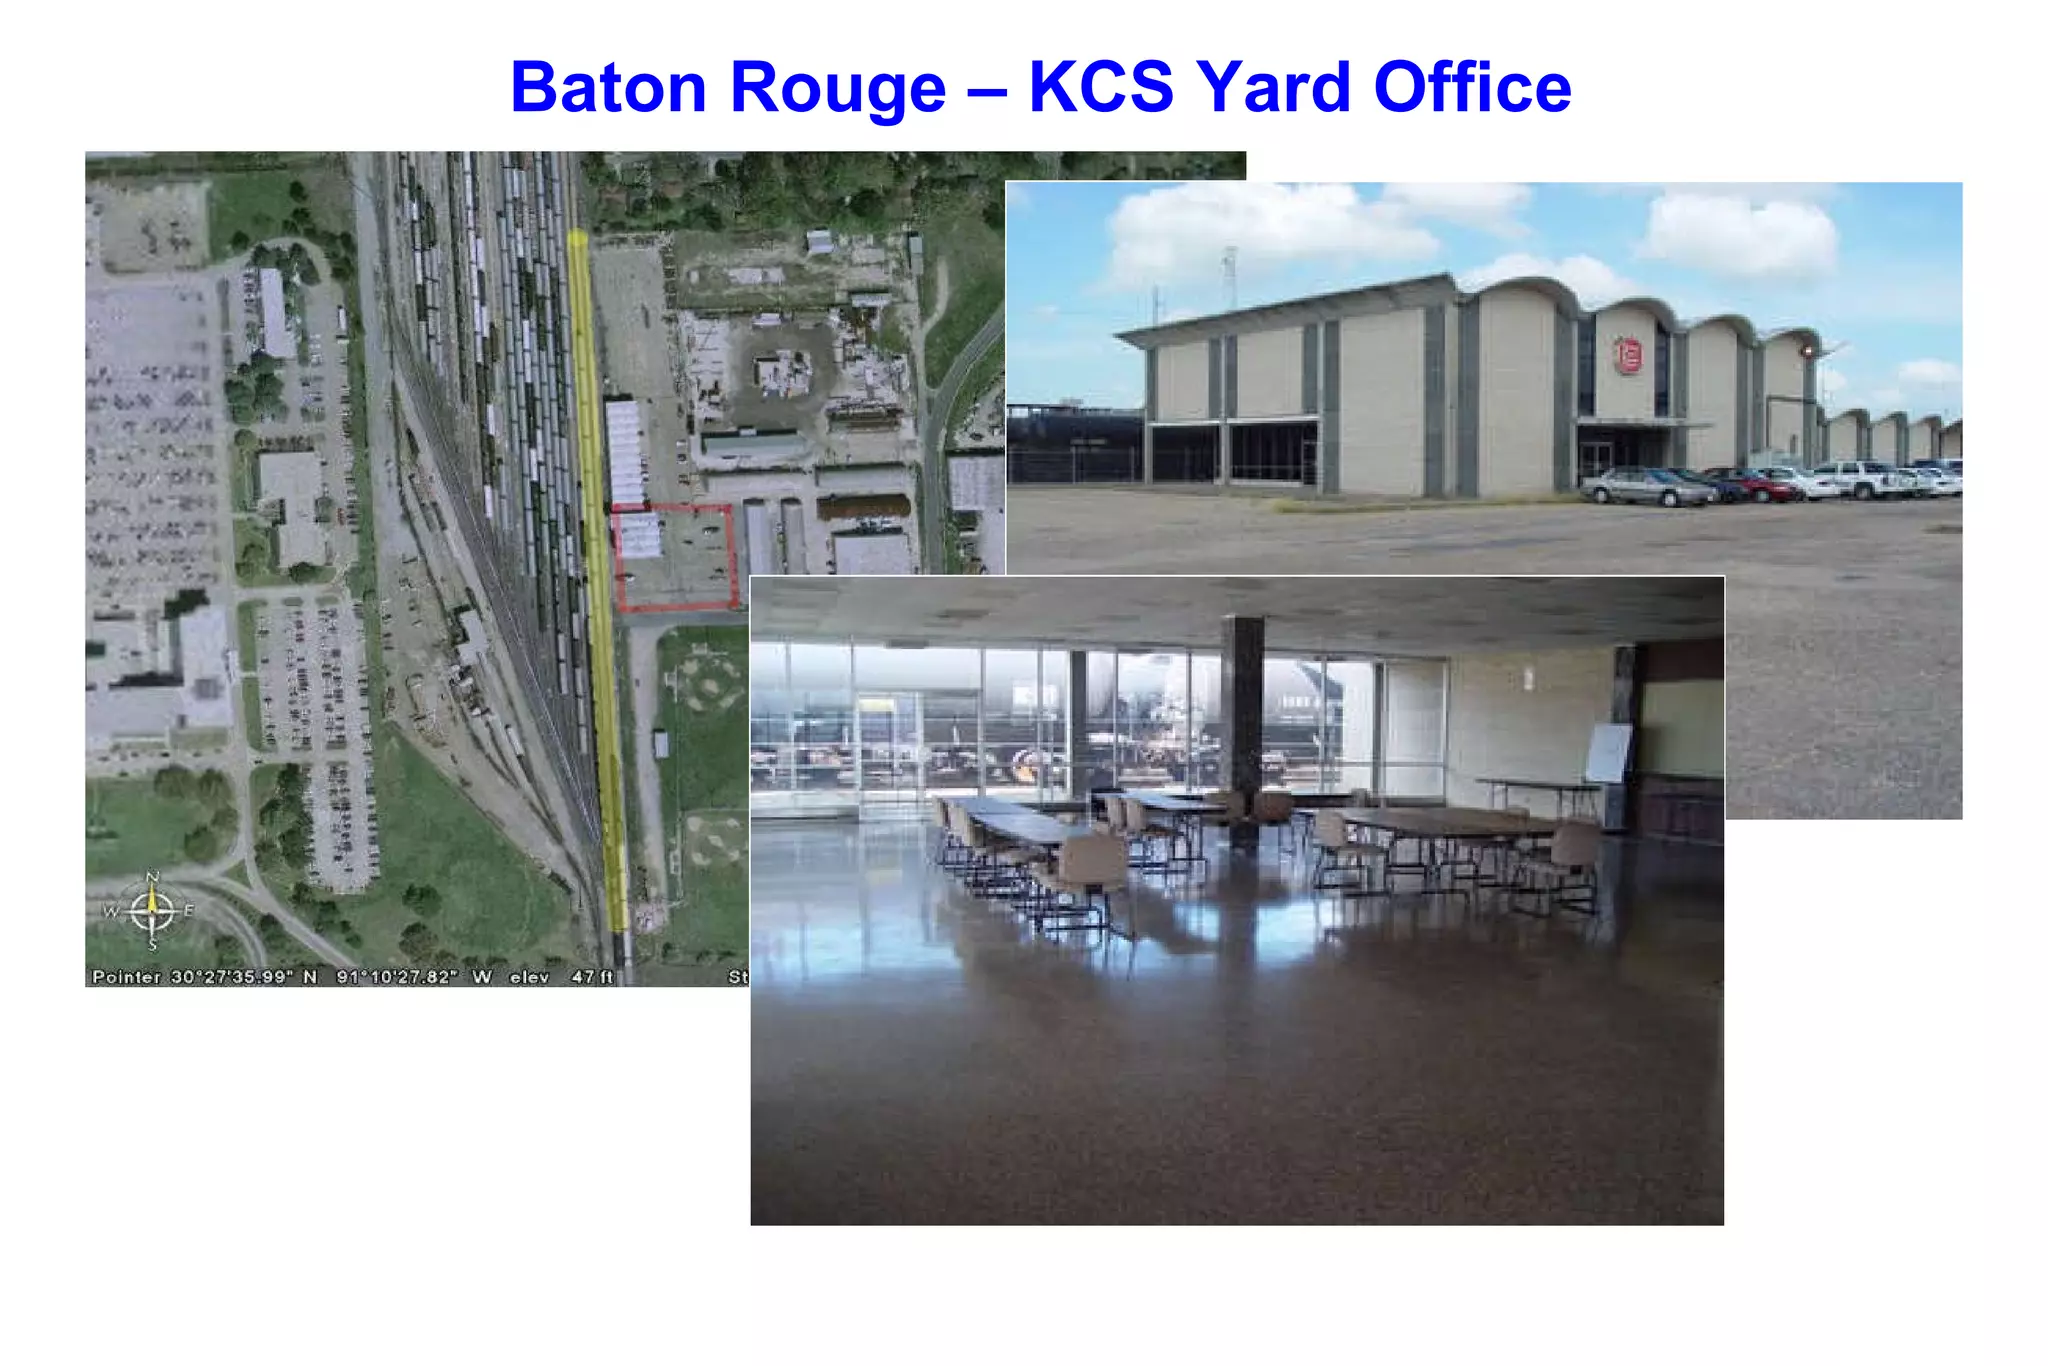
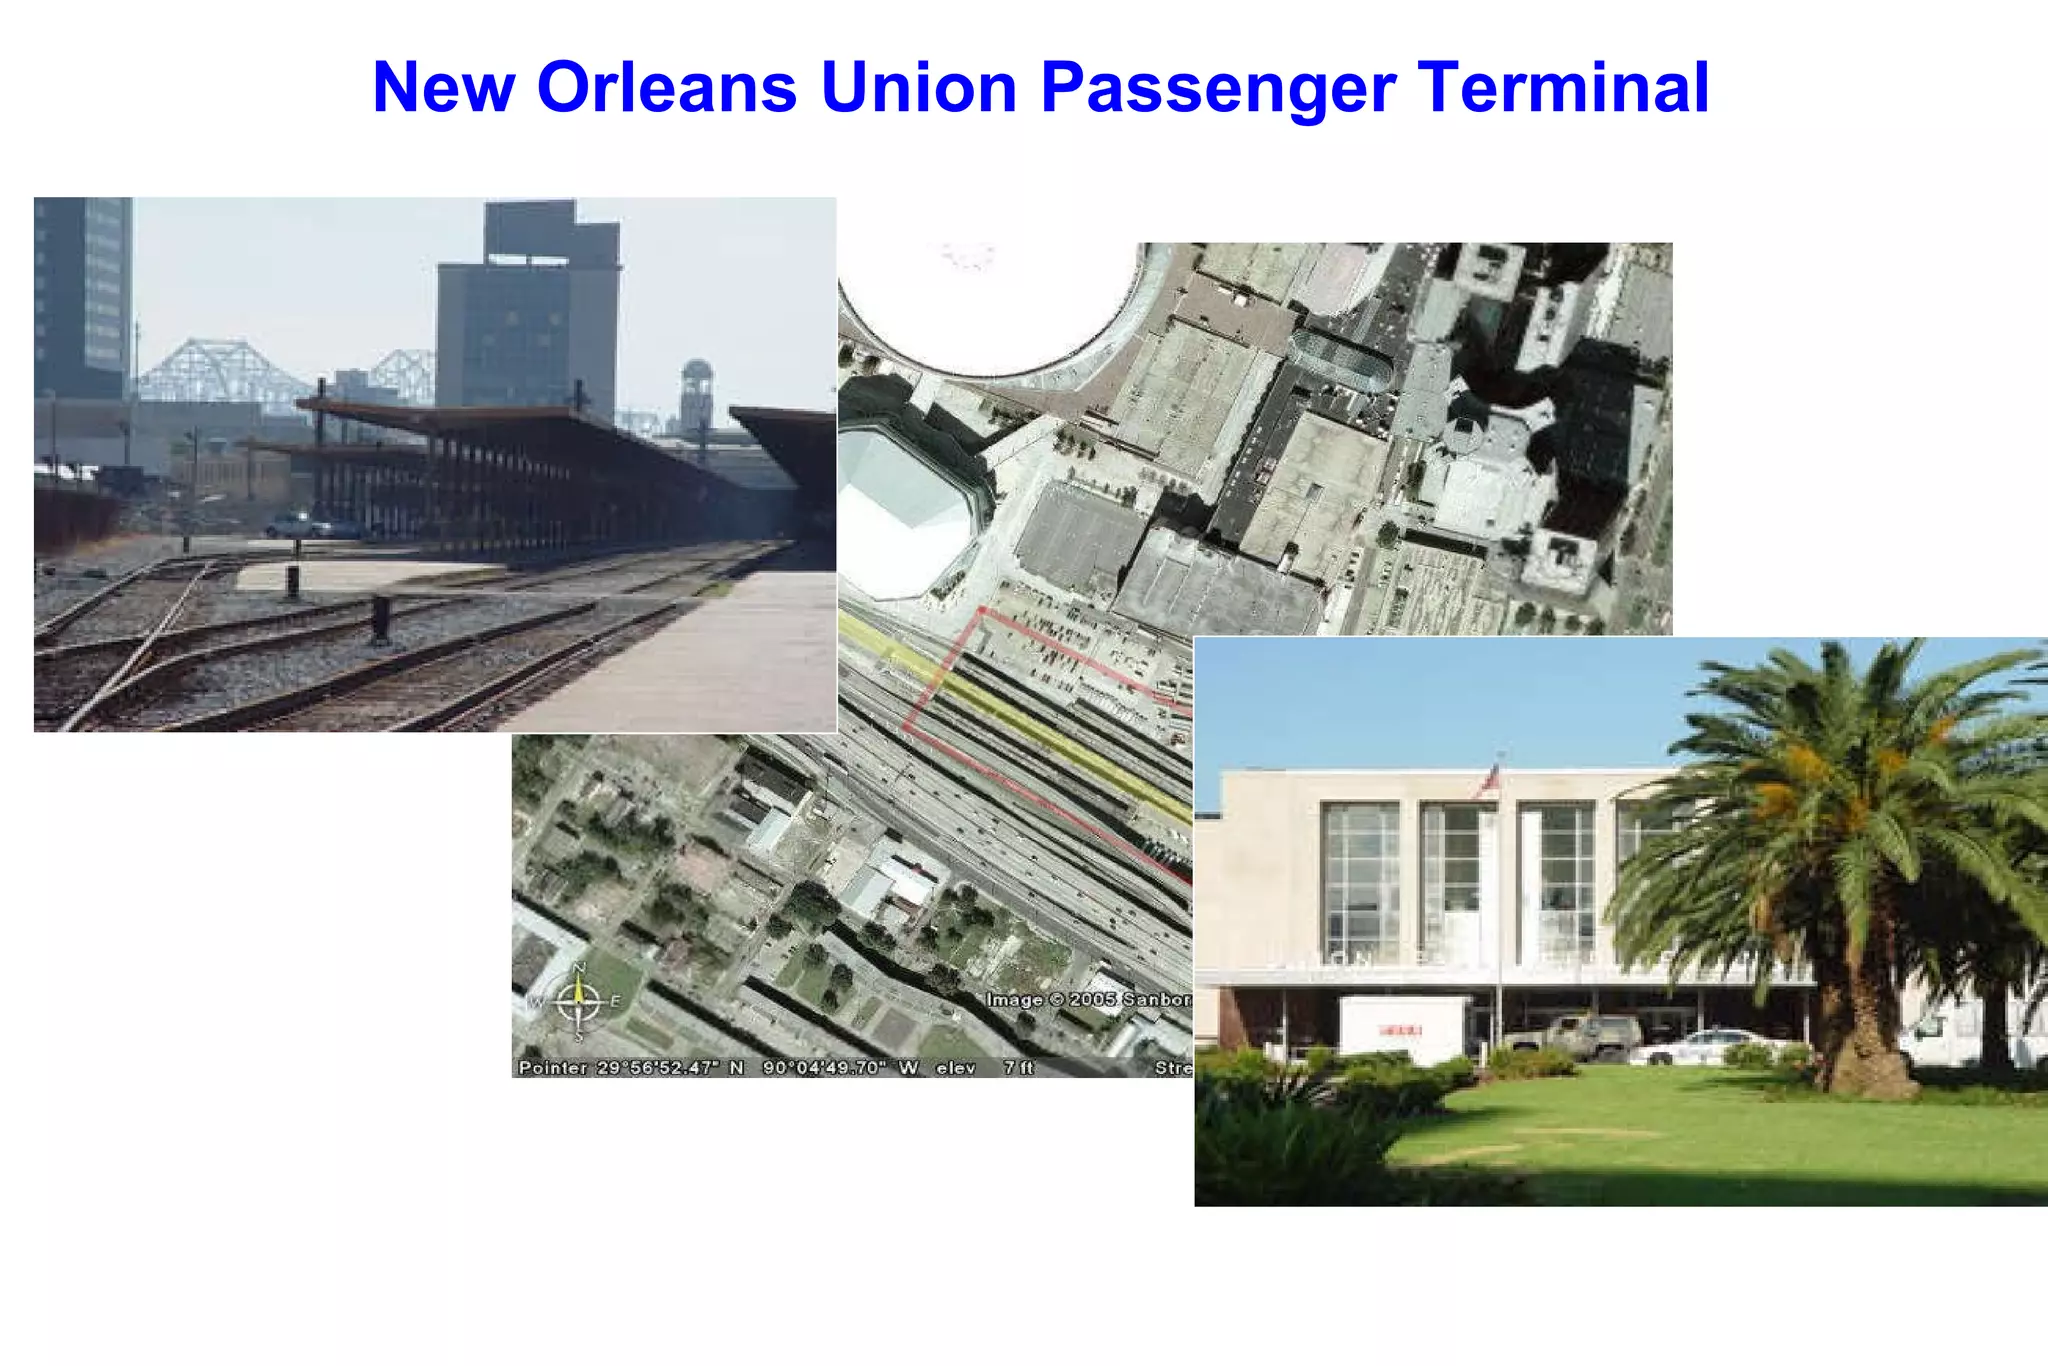


The document discusses transportation planning for the Baton Rouge metropolitan area. It provides details on the metropolitan planning organization such as the population it serves, its long range transportation plan, and funding sources. It also summarizes projects funded from 2006-2010 and discusses air quality planning, population growth trends, and livability initiatives in the area including the Green Light Plan and proposals for commuter rail and complete streets.


![[2015 e-Government Program] Action Plan : Wuhan(China)](https://cdn.slidesharecdn.com/ss_thumbnails/15-150911012458-lva1-app6892-thumbnail.jpg?width=640&height=640&fit=bounds)


![Coded Agents – with UiPath SDK + LangGraph [Virtual Hands-on Workshop]](https://cdn.slidesharecdn.com/ss_thumbnails/codedagentsdeck-251215155422-5497c599-thumbnail.jpg?width=640&height=640&fit=bounds)


