Download to read offline
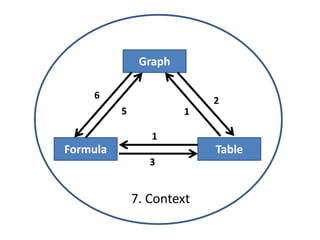
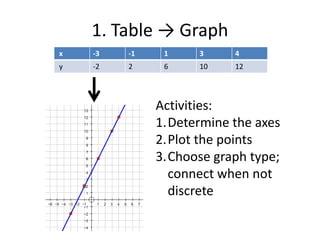


This document outlines the steps to convert between different representations of data: tables, graphs, and formulas. It provides examples of converting between each representation and notes that intermediate steps, like first converting to a table, are sometimes needed. The numbers in the document refer to different problems or activities for converting between the different data formats.


![Movie mania.pptx [autosaved]](https://cdn.slidesharecdn.com/ss_thumbnails/moviemania-160308210026-thumbnail.jpg?width=640&height=640&fit=bounds)