Download to read offline

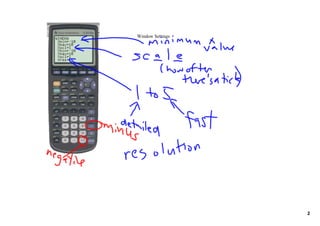
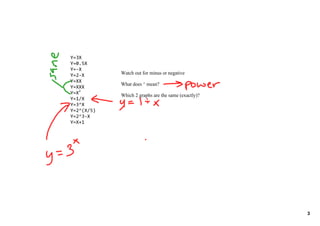
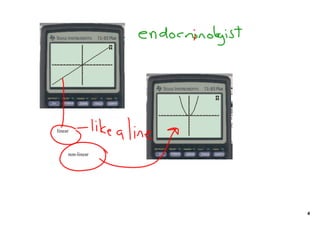
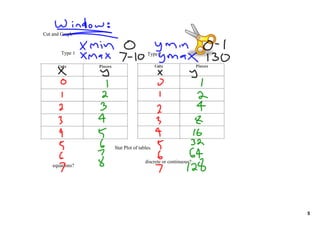
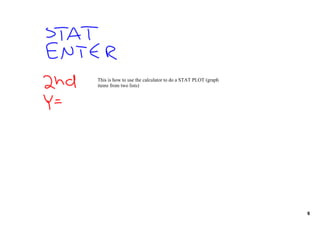
This document contains instructions for an assignment that is due on September 28th. It includes directions on how to set window settings and graph different equations using a calculator to create scatter plots from tables of x and y values. The document distinguishes between linear and non-linear equations and discusses using cut and graph to identify different types of relationships represented by discrete and continuous data. It concludes by reminding the reader of the due date and noting that tomorrow's class will include working on the assignment.


