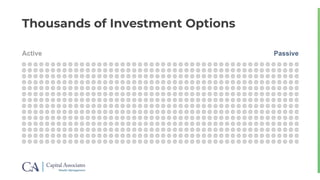
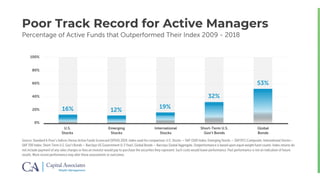
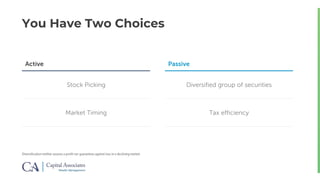
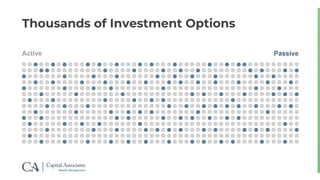
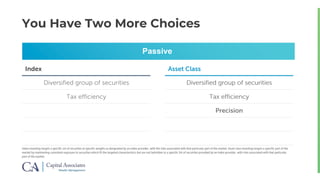
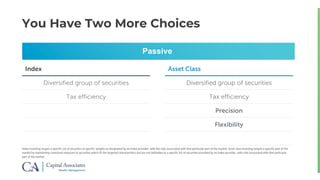
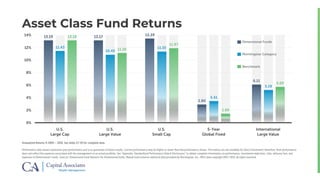
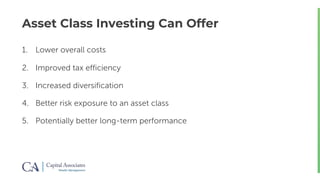
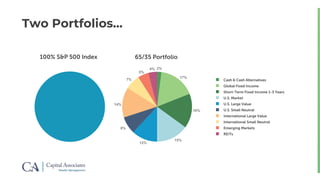
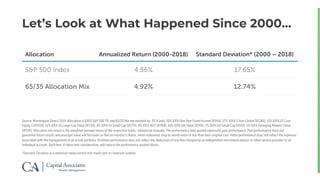
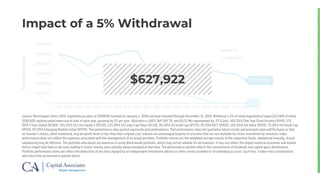
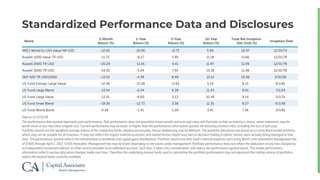
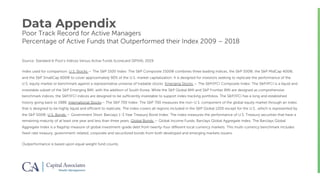
SlideShare a Scribd company logo
© 2019 BAM Advisor Services LLC d/b/a Loring Ward (“Loring Ward”). All rights reserved. R 19-102
NEW PERSPECTIVES ON
ASSET CLASS INVESTING
Investing Starts with a Plan
People invest their money to reach a goal
Creating a plan clarifies those goals
?$
$
Investing Starts with a Plan
Primary Objective: Don’t run out of money
?$
Financial Planning Software
For illustrative purposes only. Past performance does not guarantee future results and there is no guarantee that the strategies set forth in this presentation will achieve their intended objectives.
Based on historical market index return data and realistic expectations
Historical Long-Term Rate of Return
Past performance does not guarantee future results. See appendix for additional information.
6-11%
Thousands of Investment Options
Passive
You Have Two Choices
Diversification neither assures a profit nor guarantees against loss in a declining market.
Active
Stock Picking
Market Timing
Passive
Diversified group of securities
Tax efficiency
Poor Track Record for Active Managers
Source: Standard & Poor’s Indices Versus Active Funds Scorecard (SPIVA) 2019. Index used for comparison: U.S. Stocks — S&P 1500 Index; Emerging Stocks — S&P/IFCI Composite; International Stocks—
S&P 700 Index; Short-Term U.S. Gov’t Bonds — Barclays US Government (1-3 Year), Global Bonds — Barclays Global Aggregate. Outperformance is based upon equal weight fund counts. Index returns do
not include payment of any sales charges or fees an investor would pay to purchase the securities they represent. Such costs would lower performance. Past performance is not an indication of future
results. More recent performance may alter these assessments or outcomes.
Percentage of Active Funds that Outperformed Their Index 2009 - 2018
U.S.
Stocks
Emerging
Stocks
International
Stocks
Short-Term U.S.
Gov’t Bonds
Global
Bonds
0%
20%
40%
60%
80%
100%
16% 12%
19%
32%
53%
You Have Two Choices
Active
Stock Picking
Market Timing
Passive
Diversified group of securities
Tax efficiency
Diversification neither assures a profit nor guarantees against loss in a declining market.
Thousands of Investment Options
Passive
You Have Two More Choices
Index investing targets a specific set of securities at specific weights as designated by an index provider, with the risks associated with that particular part of the market. Asset class investing targets a specific part of the
market by maintaining consistent exposure to securities which fit the targeted characteristics but are not beholden to a specific list of securities provided by an index provider, with risks associated with that particular
part of the market.
Passive
Index Asset Class
Diversified group of securities
Tax efficiency
Diversified group of securities
Tax efficiency
Diversified group of securities
Tax efficiency
Precision
Precision
You Have Two More Choices
Index investing targets a specific set of securities at specific weights as designated by an index provider, with the risks associated with that particular part of the market. Asset class investing targets a specific part of the
market by maintaining consistent exposure to securities which fit the targeted characteristics but are not beholden to a specific list of securities provided by an index provider, with risks associated with that particular
part of the market.
Passive
Index
Diversified group of securities
Tax efficiency
Asset Class
Diversified group of securities
Tax efficiency
Precision
Diversified group of securities
Tax efficiency
Precision
Flexibility
Flexibility
Asset Class
Diversified group of securities
Tax efficiency
Precision
Flexibility
Diversified group of securities
Tax efficiency
Precision
Flexibility
Factors of return
You Have Two More Choices
Index investing targets a specific set of securities at specific weights as designated by an index provider, with the risks associated with that particular part of the market. Asset class investing targets a specific part of the
market by maintaining consistent exposure to securities which fit the targeted characteristics but are not beholden to a specific list of securities provided by an index provider, with risks associated with that particular
part of the market.
Passive
Index
Diversified group of securities
Tax efficiency
Factors of Return
PROFITABILITY
MOMENTUM
VALUE
SIZE
Are All Passive the Same?
Diversification Tax Efficiency Precision Flexibility Factors of Return
THERE MAY BE A
BETTER ALTERNATIVE
TO INDEX RETURNS
Asset Class Fund Returns
Annualized Returns % 2009 – 2018. See slides 27-29 for complete data.
Performance data shown represents past performance and is no guarantee of future results. Current performance may be higher or lower than the performance shown. The indices are not available for direct investment; therefore, their performance
does not reflect the expenses associated with the management of an actual portfolio. See “Appendix: Standardized Performance Data & Disclosures” to obtain complete information on performance, investment objectives, risks, advisory fees, and
expenses of Dimensional’s funds. Sources: Dimensional Fund Advisors for Dimensional funds; Mutual fund universe statistical data provided by Morningstar, Inc.; MSCI data copyright MSCI 2019, all rights reserved.
U.S.
Large Cap
U.S.
Large Value
U.S.
Small Cap
5-Year
Global Fixed
International
Large Value
0%
2%
4%
6%
8%
10%
Benchmark
Morningstar Category
Dimensional Funds
12%
14% 13.19
11.43
13.18 13.17
10.45 11.18
13.39
11.35
11.97
2.80
3.41
1.69
6.11
5.19
5.69
Asset Class Investing Can Offer
1. Lower overall costs
2. Improved tax efficiency
3. Increased diversification
4. Better risk exposure to an asset class
5. Potentially better long-term performance
2%
65/35 Portfolio
17%
16%
15%
12%
14%
5%
4%
8%
7%
Two Portfolios…
100% S&P 500 Index
Cash & Cash Alternatives
Global Fixed Income
Short-Term Fixed Income 1-3 Years
U.S. Market
U.S. Large Value
U.S. Small Neutral
International Large Value
International Small Neutral
Emerging Markets
REITs
Let’s Look at What Happened Since 2000…
Source: Morningstar Direct 2019. Allocation is 100% S&P 500 TR, and 65/35 Mix represented by: 2% (Cash), 16% (DFA One Year Fixed Income DFIHX), 17% (DFA 5 Year Global DFGBX), 15% (DFA US Core
Equity 1 DFEOX), 12% (DFA US Large Cap Value DFLVX), 8% (DFA US Small Cap DFSTX), 4% (DFA REIT DFREX), 14% (DFA Intl Value DFIVX), 7% (DFA Intl Small Cap DFISX), 5% (DFA Emerging Markets Value
DFEVX). Allocation mix return is the weighted average return of the respective funds, rebalanced annually. The performance data quoted represents past performance. Past performance does not
guarantee future results and principal value will fluctuate so that an investor's shares, when redeemed, may be worth more or less than their original cost. Index performance does not reflect the expenses
associated with the management of an actual portfolio. Portfolio performance does not reflect the deduction of any fees charged by an independent investment advisor or other service provider to an
individual account. Such fees, if taken into consideration, will reduce the performance quoted above.
*Standard Deviation is a statistical measurement that sheds light on historical volatility.
Allocation Annualized Return (2000-2018) Standard Deviation* (2000 – 2018)
S&P 500 Index 4.86% 17.65%
65/35 Allocation Mix 4.92% 12.74%
$0
$100,000
$200,000
$300,000
$400,000
$500,000
$600,000
1999 2000 2001 2002 2003 2004 2005 2006 2007 2008 2009 2010 2011 2012 2013 2014 2015 2016 2017 2018
65/35
S&P 500
$237,239
PortfolioValue
$0
$627,922
Impact of a 5% Withdrawal
Source: Morningstar Direct 2019. Hypothetical value of $500000 invested on January 1, 2000 and kept invested through December 31, 2018. Withdraw is 5% of initial hypothetical value ($25,000 of initial
$500,000 starting value) taken out at start of each year, growing by 3% per year. Allocation is 100% S&P 500 TR, and 65/35 Mix represented by: 2% (Cash), 16% (DFA One Year Fixed Income DFIHX), 17%
(DFA 5 Year Global DFGBX), 15% (DFA US Core Equity 1 DFEOX), 12% (DFA US Large Cap Value DFLVX), 8% (DFA US Small Cap DFSTX), 4% (DFA REIT DFREX), 14% (DFA Intl Value DFIVX), 7% (DFA Intl Small Cap
DFISX), 5% (DFA Emerging Markets Value DFEVX). The performance data quoted represents past performance. Past performance does not guarantee future results and principal value will fluctuate so that
an investor's shares, when redeemed, may be worth more or less than their original cost. Indexes are unmanaged baskets of securities that are not available for direct investment by investors. Index
performance does not reflect the expenses associated with the management of an actual portfolio. Portfolio returns are the weighted average returns of the respective funds, rebalanced annually. Actual
rebalancing may be different. The portfolio allocations are based on a Loring Ward model portfolio, which may not be suitable for all investors. It may not reflect the impact material economic and market
factors might have had on decision making if clients’ money were actually being managed at that time. The performance quoted reflects the reinvestment of dividends and capital gains distributions.
Portfolio performance does not reflect the deduction of any fees charged by an independent investment advisor or other service provider to an individual account. Such fees, if taken into consideration,
will reduce the performance quoted above.
1 & 30 = ?
1 & 30 = ?
Make sure you have the
highest probability of
capturing market returns
QUESTIONS?
Standardized Performance Data and Disclosures
U.S. Large Cap: DFA US Core Equity 1, US Fund Large Blend, Russell 3000 USD Index. U.S. Large Value: DFA US Large Cap
Value, US OE Large Value, Russell 1000 Value Index. U.S. Small: DFA US Small Cap, US Fund Small Blend, Russell 2000 Index.
5-Year Global Fixed: DFA Five-Year Global Fixed-Income, US Fund World Bond, Citigroup World Government Bond Index 1-5
Years (hedged). International Large Value: DFA International Value, US Fund Foreign Large Value, MSCI World ex US Value Index
Morningstar categories are based on Morningstar’s methodology which classifies funds based on their investment styles,
market capitalization and asset mix as measured by their underlying portfolio holdings over the past three years.
Dimensional Fund Advisors is an investment advisor registered with the Securities and Exchange Commission and is
unaffiliated with BAM Advisor Services LLC d/b/a Loring Ward. Consider the investment objectives, risks, charges and
expenses of the funds listed carefully before investing. The prospectus and if available, summary prospectus, contain this
and other information about the funds. To obtain a DFA Funds prospectus, summary prospectus, additional information
about the DFA Funds, or performance data current to the most recent month-end, please call Dimensional Fund Advisors
collect at 512-306-7400; or visit www.dimensional.com. Please read the prospectus and summary prospectus carefully
before investing.
Standardized Performance Data and Disclosures
Name
Prospectus Gross
Expense Ratio (%)
3-Month
Return (%)
1-Year
Return (%)
5-Year
Return (%)
10-Year
Return (%)
Total Ret
Inception
(Qtr-End) (%)
Inception Date
ICE BofAML 1-3Y US Corp&Govt TR USD 1.17 1.63 1.04 1.56 4.71 6/30/86
FTSE WGBI 1-5 Yr Hdg USD 1.53 2.12 1.53 1.69 5.27 12/31/84
DFA Emerging Markets Value I 0.54 -7.17 -11.93 1.85 8.19 9.59 4/1/98
DFA Five-Year Global Fixed-Income I 0.27 1.24 1.68 1.95 2.80 5.11 11/6/90
DFA International Small Company I 0.53 -16.54 -19.42 1.96 9.53 6.31 9/30/96
DFA International Value I 0.43 -14.63 -17.49 -0.35 6.11 5.67 2/15/94
DFA One-Year Fixed-Income I 0.17 0.78 1.87 0.84 0.92 4.54 7/25/83
DFA Real Estate Securities I 0.18 -5.15 -2.99 8.51 12.41 9.55 1/5/93
DFA US Core Equity 1 I 0.19 -15.94 -7.79 6.89 13.19 7.65 9/15/05
DFA US Large Cap Value I 0.27 -14.72 -11.65 5.83 13.17 9.60 2/19/93
DFA US Small Cap I 0.37 -20.15 -13.13 3.87 13.39 9.79 3/19/92
DJ US Select REIT TR USD -6.61 -4.22 7.89 12.05 8.71 12/31/86
Loring Ward Global Moderate DFA 0.30 -9.47 -8.11 2.49 7.08 5.87 10/1/96
MSCI EM Value NR USD -6.75 -10.74 0.51 6.99 9.36 12/29/00
MSCI World Ex USA Small Cap NR USD -16.16 -18.07 2.25 10.06 7.41 12/29/00
Standardized Performance Data and Disclosures
Data as of 12/31/18
The performance data quoted represents past performance. Past performance does not guarantee future results and principal value will fluctuate so that an investor's shares, when redeemed, may be
worth more or less than their original cost. Current performance may be lower or higher than the performance information quoted. All Investing involves risks, including the loss of principal.
Portfolio returns are the weighted average returns of the respective funds, rebalanced annually. Actual rebalancing may be different. The portfolio allocations are based on a Loring Ward model portfolio,
which may not be suitable for all investors. It may not reflect the impact material economic and market factors might have had on decision making if clients’ money were actually being managed at that
time. The performance quoted reflects the reinvestment of dividends and capital gains distributions. Portfolio returns are after fund’s internal expenses and Loring Ward’s max investment management fee
of 0.90% through April 1, 2017, 0.65% thereafter. Management fee may be lower depending on the assets under management. Portfolio performance does not reflect the deduction of any fees charged by
an independent investment advisor or other service provider to an individual account. Such fees, if taken into consideration, will reduce the performance quoted above. The model performance
information reflects various allocation changes made over time. Therefore the underlying mutual funds used in calculating the portfolio performance may not represent the trailing returns of portfolios
and/or the mutual funds currently available.
Name
3-Month
Return (%)
1-Year
Return (%)
5-Year
Return (%)
10-Year
Return (%)
Total Ret Inception
(Qtr-End) (%)
Inception Date
MSCI World Ex USA Value NR USD -12.05 -15.06 -0.73 5.69 10.47 12/31/74
Russell 1000 Value TR USD -11.72 -8.27 5.95 11.18 11.66 12/31/78
Russell 2000 TR USD -20.20 -11.01 4.41 11.97 11.09 12/31/78
Russell 3000 TR USD -14.30 -5.24 7.91 13.18 11.48 12/31/78
S&P 500 TR USD(1936) -13.52 -4.38 8.49 13.12 10.36 3/31/36
US Fund Foreign Large Value -12.36 -15.38 -0.63 5.19 8.13 6/1/81
US Fund Large Blend -13.54 -6.24 6.28 11.43 8.61 7/1/24
US Fund Large Value -12.51 -8.60 5.13 10.45 9.14 5/1/31
US Fund Small Blend -19.39 -12.73 3.06 11.35 8.27 6/1/56
US Fund World Bond 0.28 -1.41 1.29 3.41 7.36 2/1/81
Data Appendix
Poor Track Record for Active Managers
Percentage of Active Funds that Outperformed their Index 2009 – 2018
Source: Standard & Poor’s Indices Versus Active Funds Scorecard (SPIVA), 2019.
Index used for comparison: U.S. Stocks — The S&P 1500 Index: The S&P Composite 1500® combines three leading indices, the S&P 500®, the S&P MidCap 400®,
and the S&P SmallCap 600® to cover approximately 90% of the U.S. market capitalization. It is designed for investors seeking to replicate the performance of the
U.S. equity market or benchmark against a representative universe of tradable stocks. Emerging Stocks — The S&P/IFCI Composite Index: The S&P/IFCI is a liquid and
investable subset of the S&P Emerging BMI, with the addition of South Korea. While the S&P Global BMI and S&P Frontier BMI are designed as comprehensive
benchmark indices, the S&P/IFCI indices are designed to be sufficiently investable to support index tracking portfolios. The S&P/IFCI has a long and established
history going back to 1988. International Stocks— The S&P 700 Index: The S&P 700 measures the non-U.S. component of the global equity market through an index
that is designed to be highly liquid and efficient to replicate. The index covers all regions included in the S&P Global 1200 except for the U.S., which is represented by
the S&P 500®. U.S. Bonds — Government Short, Barclays 1-3 Year Treasury Bond Index: The index measures the performance of U.S. Treasury securities that have a
remaining maturity of at least one year and less than three years. Global Bonds — Global Income Funds, Barclays Global Aggregate Index: The Barclays Global
Aggregate Index is a flagship measure of global investment-grade debt from twenty-four different local currency markets. This multi-currency benchmark includes
fixed-rate treasury, government-related, corporate and securitized bonds from both developed and emerging markets issuers.
Outperformance is based upon equal weight fund counts.
The principals of Capital Associates Wealth Management, as individual financial advisers with Eagle Strategies LLC, a Registered Investment Adviser, offer their clients the services
of Loring Ward, third party money manager available on Eagle Strategies Investment Management platform. Capital Associates Wealth Management, Eagle Strategies and Loring
Ward are independently owned and operated.
LWI Financial Inc. (“Loring Ward”) is an investment adviser registered with the Securities and Exchange Commission. Securities transactions are offered through its affiliate, Loring
Ward Securities Inc., member FINRA/SIPC.
B 16-020 (4/18)
Capital Associates
6901 Rockledge Drive, Suite 500
Bethesda, Maryland 20817
(301) 581.4108
info@capitalassoc.net
Rob Ugiansky
robert@capitalassoc.net
(800) 601.5281
Mitchell Katz
mkatz@capitalassoc.net
(800) 601.5281
http://www.capitalassoc.net

More Related Content

What's hot

Elementsof Investing.Ameriprise
Elementsof Investing.AmeripriseElementsof Investing.Ameriprise
Elementsof Investing.Ameriprisegenogates
 
Financial management
Financial managementFinancial management
Financial management
smumbahelp
 
Fairholme factesheet cierre 2011
Fairholme factesheet cierre 2011Fairholme factesheet cierre 2011
Fairholme factesheet cierre 2011Frank Ragol
 
Inheritance, Retirement & Cash Flow
Inheritance, Retirement & Cash FlowInheritance, Retirement & Cash Flow
Inheritance, Retirement & Cash Flow
Place2Give Foundation/Karma & Cents Inc.
 
Why To Diversify
Why To DiversifyWhy To Diversify
Why To Diversify
Connell McNamara, APMA®
 
Fundteaser 16457 usa_en_retail_amundi
Fundteaser 16457 usa_en_retail_amundiFundteaser 16457 usa_en_retail_amundi
Fundteaser 16457 usa_en_retail_amundi
rcolicch
 
Hilltop decorrelated fund august 2013 factsheet
Hilltop decorrelated fund august 2013 factsheetHilltop decorrelated fund august 2013 factsheet
Hilltop decorrelated fund august 2013 factsheetJohn Robertson
 
Outlook 2021 for Elements Wealth Management
Outlook 2021 for Elements Wealth ManagementOutlook 2021 for Elements Wealth Management
Outlook 2021 for Elements Wealth Management
Jake Engel
 
Outlook 2021
Outlook 2021Outlook 2021
Outlook 2021
Jake Engel
 
Risk and return
Risk and returnRisk and return
Risk and return
Mustafa El Awady
 
Cheaper prices: WACC- post GFC a revision lower is needed
Cheaper prices: WACC- post GFC a revision lower is neededCheaper prices: WACC- post GFC a revision lower is needed
Cheaper prices: WACC- post GFC a revision lower is needed
A'Ohlin Commercial Insights
 
Nfo presentation idfc gilt 2027 & 2028 index funds mar21
Nfo presentation   idfc gilt 2027 & 2028 index funds mar21Nfo presentation   idfc gilt 2027 & 2028 index funds mar21
Nfo presentation idfc gilt 2027 & 2028 index funds mar21
IDFCJUBI
 
Olympic Wealth Fund, 'Javelin' Fund fact sheet class 'B' February 2015
Olympic Wealth Fund, 'Javelin' Fund fact sheet class 'B' February 2015Olympic Wealth Fund, 'Javelin' Fund fact sheet class 'B' February 2015
Olympic Wealth Fund, 'Javelin' Fund fact sheet class 'B' February 2015
Olympic Wealth Fund
 

What's hot (14)

Elementsof Investing.Ameriprise
Elementsof Investing.AmeripriseElementsof Investing.Ameriprise
Elementsof Investing.Ameriprise
 
Financial management
Financial managementFinancial management
Financial management
 
Fairholme factesheet cierre 2011
Fairholme factesheet cierre 2011Fairholme factesheet cierre 2011
Fairholme factesheet cierre 2011
 
Inheritance, Retirement & Cash Flow
Inheritance, Retirement & Cash FlowInheritance, Retirement & Cash Flow
Inheritance, Retirement & Cash Flow
 
Why To Diversify
Why To DiversifyWhy To Diversify
Why To Diversify
 
Fundteaser 16457 usa_en_retail_amundi
Fundteaser 16457 usa_en_retail_amundiFundteaser 16457 usa_en_retail_amundi
Fundteaser 16457 usa_en_retail_amundi
 
Hilltop decorrelated fund august 2013 factsheet
Hilltop decorrelated fund august 2013 factsheetHilltop decorrelated fund august 2013 factsheet
Hilltop decorrelated fund august 2013 factsheet
 
Outlook 2021 for Elements Wealth Management
Outlook 2021 for Elements Wealth ManagementOutlook 2021 for Elements Wealth Management
Outlook 2021 for Elements Wealth Management
 
Outlook 2021
Outlook 2021Outlook 2021
Outlook 2021
 
Risk Management
Risk ManagementRisk Management
Risk Management
 
Risk and return
Risk and returnRisk and return
Risk and return
 
Cheaper prices: WACC- post GFC a revision lower is needed
Cheaper prices: WACC- post GFC a revision lower is neededCheaper prices: WACC- post GFC a revision lower is needed
Cheaper prices: WACC- post GFC a revision lower is needed
 
Nfo presentation idfc gilt 2027 & 2028 index funds mar21
Nfo presentation   idfc gilt 2027 & 2028 index funds mar21Nfo presentation   idfc gilt 2027 & 2028 index funds mar21
Nfo presentation idfc gilt 2027 & 2028 index funds mar21
 
Olympic Wealth Fund, 'Javelin' Fund fact sheet class 'B' February 2015
Olympic Wealth Fund, 'Javelin' Fund fact sheet class 'B' February 2015Olympic Wealth Fund, 'Javelin' Fund fact sheet class 'B' February 2015
Olympic Wealth Fund, 'Javelin' Fund fact sheet class 'B' February 2015
 

Similar to New perspectives on asset class investing

Pursuing a Better Investment Experience with Capital Associates
Pursuing a Better Investment Experience with Capital AssociatesPursuing a Better Investment Experience with Capital Associates
Pursuing a Better Investment Experience with Capital Associates
RobUgiansky
 
Asset Allocation And Your Portfolio
Asset Allocation And Your PortfolioAsset Allocation And Your Portfolio
Asset Allocation And Your Portfolio
WilliamDeye
 
A Better Investment Experience
A Better Investment ExperienceA Better Investment Experience
A Better Investment Experience
Michael J. Evans
 
2009 Pulse Of The Market
2009 Pulse Of The Market2009 Pulse Of The Market
2009 Pulse Of The Market
Kbrown3709
 
DHGWA Brochure 2015 Portrait
DHGWA Brochure 2015 PortraitDHGWA Brochure 2015 Portrait
DHGWA Brochure 2015 PortraitEllen Lindh
 
RWC Investment Introduction Presentation
RWC Investment Introduction PresentationRWC Investment Introduction Presentation
RWC Investment Introduction Presentation
Sprague Kolp
 
Rethink The Way You Invest
Rethink The Way You InvestRethink The Way You Invest
Rethink The Way You Investpolariswuser
 
Aboslute Capital Univ. Presentation
Aboslute Capital Univ. PresentationAboslute Capital Univ. Presentation
Aboslute Capital Univ. Presentation
Terry Elder
 
Cummings_ACI_Brochure_0116
Cummings_ACI_Brochure_0116Cummings_ACI_Brochure_0116
Cummings_ACI_Brochure_0116Bobby
 
Challengespres
ChallengespresChallengespres
Challengespres
jweszka24
 
Investing Basics
Investing BasicsInvesting Basics
Investing Basicsrbhenderson
 
Getting Through a Volatile Market
Getting Through a Volatile MarketGetting Through a Volatile Market
Getting Through a Volatile Market
JLinneman
 
2010 Investment Outlook
2010 Investment Outlook2010 Investment Outlook
2010 Investment Outlook
Patrick Collins
 
Pursuing_a_Better_Investment_Experience_Slides
Pursuing_a_Better_Investment_Experience_SlidesPursuing_a_Better_Investment_Experience_Slides
Pursuing_a_Better_Investment_Experience_SlidesEddy Mejlholm
 
The Fundamentals of Asset Class Investing
The Fundamentals of Asset Class InvestingThe Fundamentals of Asset Class Investing
The Fundamentals of Asset Class Investing
Mitch Katz
 
Fundamentals of asset class investing
Fundamentals of asset class investingFundamentals of asset class investing
Fundamentals of asset class investing
Better Financial Education
 
Cornerstone foundations of sensible investing
Cornerstone foundations of sensible investingCornerstone foundations of sensible investing
Cornerstone foundations of sensible investing
RobUgiansky
 
Actions You Can Take After Great Recession
Actions You Can Take After Great RecessionActions You Can Take After Great Recession
Actions You Can Take After Great Recessionbruce_gillen
 
John hancock-lesson
John hancock-lessonJohn hancock-lesson
John hancock-lessonlsorrentino1
 

Similar to New perspectives on asset class investing (20)

Pursuing a Better Investment Experience with Capital Associates
Pursuing a Better Investment Experience with Capital AssociatesPursuing a Better Investment Experience with Capital Associates
Pursuing a Better Investment Experience with Capital Associates
 
Asset Allocation And Your Portfolio
Asset Allocation And Your PortfolioAsset Allocation And Your Portfolio
Asset Allocation And Your Portfolio
 
A Better Investment Experience
A Better Investment ExperienceA Better Investment Experience
A Better Investment Experience
 
2009 Pulse Of The Market
2009 Pulse Of The Market2009 Pulse Of The Market
2009 Pulse Of The Market
 
Pulse Of The Market
Pulse Of The MarketPulse Of The Market
Pulse Of The Market
 
DHGWA Brochure 2015 Portrait
DHGWA Brochure 2015 PortraitDHGWA Brochure 2015 Portrait
DHGWA Brochure 2015 Portrait
 
RWC Investment Introduction Presentation
RWC Investment Introduction PresentationRWC Investment Introduction Presentation
RWC Investment Introduction Presentation
 
Rethink The Way You Invest
Rethink The Way You InvestRethink The Way You Invest
Rethink The Way You Invest
 
Aboslute Capital Univ. Presentation
Aboslute Capital Univ. PresentationAboslute Capital Univ. Presentation
Aboslute Capital Univ. Presentation
 
Cummings_ACI_Brochure_0116
Cummings_ACI_Brochure_0116Cummings_ACI_Brochure_0116
Cummings_ACI_Brochure_0116
 
Challengespres
ChallengespresChallengespres
Challengespres
 
Investing Basics
Investing BasicsInvesting Basics
Investing Basics
 
Getting Through a Volatile Market
Getting Through a Volatile MarketGetting Through a Volatile Market
Getting Through a Volatile Market
 
2010 Investment Outlook
2010 Investment Outlook2010 Investment Outlook
2010 Investment Outlook
 
Pursuing_a_Better_Investment_Experience_Slides
Pursuing_a_Better_Investment_Experience_SlidesPursuing_a_Better_Investment_Experience_Slides
Pursuing_a_Better_Investment_Experience_Slides
 
The Fundamentals of Asset Class Investing
The Fundamentals of Asset Class InvestingThe Fundamentals of Asset Class Investing
The Fundamentals of Asset Class Investing
 
Fundamentals of asset class investing
Fundamentals of asset class investingFundamentals of asset class investing
Fundamentals of asset class investing
 
Cornerstone foundations of sensible investing
Cornerstone foundations of sensible investingCornerstone foundations of sensible investing
Cornerstone foundations of sensible investing
 
Actions You Can Take After Great Recession
Actions You Can Take After Great RecessionActions You Can Take After Great Recession
Actions You Can Take After Great Recession
 
John hancock-lesson
John hancock-lessonJohn hancock-lesson
John hancock-lesson
 

Recently uploaded

Scope Of Macroeconomics introduction and basic theories
Scope Of Macroeconomics introduction and basic theoriesScope Of Macroeconomics introduction and basic theories
Scope Of Macroeconomics introduction and basic theories
nomankalyar153
 
The new type of smart, sustainable entrepreneurship and the next day | Europe...
The new type of smart, sustainable entrepreneurship and the next day | Europe...The new type of smart, sustainable entrepreneurship and the next day | Europe...
The new type of smart, sustainable entrepreneurship and the next day | Europe...
Antonis Zairis
 
Commercial Bank Economic Capsule - May 2024
Commercial Bank Economic Capsule - May 2024Commercial Bank Economic Capsule - May 2024
Commercial Bank Economic Capsule - May 2024
Commercial Bank of Ceylon PLC
 
Webinar Exploring DORA for Fintechs - Simont Braun
Webinar Exploring DORA for Fintechs - Simont BraunWebinar Exploring DORA for Fintechs - Simont Braun
Webinar Exploring DORA for Fintechs - Simont Braun
FinTech Belgium
 
Chương 6. Ancol - phenol - ether (1).pdf
Chương 6. Ancol - phenol - ether (1).pdfChương 6. Ancol - phenol - ether (1).pdf
Chương 6. Ancol - phenol - ether (1).pdf
va2132004
 
Empowering the Unbanked: The Vital Role of NBFCs in Promoting Financial Inclu...
Empowering the Unbanked: The Vital Role of NBFCs in Promoting Financial Inclu...Empowering the Unbanked: The Vital Role of NBFCs in Promoting Financial Inclu...
Empowering the Unbanked: The Vital Role of NBFCs in Promoting Financial Inclu...
Vighnesh Shashtri
 
Summary of financial results for 1Q2024
Summary of financial  results for 1Q2024Summary of financial  results for 1Q2024
Summary of financial results for 1Q2024
InterCars
 
The Evolution of Non-Banking Financial Companies (NBFCs) in India: Challenges...
The Evolution of Non-Banking Financial Companies (NBFCs) in India: Challenges...The Evolution of Non-Banking Financial Companies (NBFCs) in India: Challenges...
The Evolution of Non-Banking Financial Companies (NBFCs) in India: Challenges...
beulahfernandes8
 
how to sell pi coins in all Africa Countries.
how to sell pi coins in all Africa Countries.how to sell pi coins in all Africa Countries.
how to sell pi coins in all Africa Countries.
DOT TECH
 
what is the future of Pi Network currency.
what is the future of Pi Network currency.what is the future of Pi Network currency.
what is the future of Pi Network currency.
DOT TECH
 
how to sell pi coins on Bitmart crypto exchange
how to sell pi coins on Bitmart crypto exchangehow to sell pi coins on Bitmart crypto exchange
how to sell pi coins on Bitmart crypto exchange
DOT TECH
 
how to sell pi coins at high rate quickly.
how to sell pi coins at high rate quickly.how to sell pi coins at high rate quickly.
how to sell pi coins at high rate quickly.
DOT TECH
 
managementaccountingunitiv-230422140105-dd17d80b.ppt
managementaccountingunitiv-230422140105-dd17d80b.pptmanagementaccountingunitiv-230422140105-dd17d80b.ppt
managementaccountingunitiv-230422140105-dd17d80b.ppt
SuseelaPalanimuthu
 
234Presentation on Indian Debt Market.ppt
234Presentation on Indian Debt Market.ppt234Presentation on Indian Debt Market.ppt
234Presentation on Indian Debt Market.ppt
PravinPatil144525
 
where can I find a legit pi merchant online
where can I find a legit pi merchant onlinewhere can I find a legit pi merchant online
where can I find a legit pi merchant online
DOT TECH
 
一比一原版BCU毕业证伯明翰城市大学毕业证成绩单如何办理
一比一原版BCU毕业证伯明翰城市大学毕业证成绩单如何办理一比一原版BCU毕业证伯明翰城市大学毕业证成绩单如何办理
一比一原版BCU毕业证伯明翰城市大学毕业证成绩单如何办理
ydubwyt
 
what is the best method to sell pi coins in 2024
what is the best method to sell pi coins in 2024what is the best method to sell pi coins in 2024
what is the best method to sell pi coins in 2024
DOT TECH
 
how can I sell/buy bulk pi coins securely
how can I sell/buy bulk pi coins securelyhow can I sell/buy bulk pi coins securely
how can I sell/buy bulk pi coins securely
DOT TECH
 
GeM ppt in railway for presentation on gem
GeM ppt in railway  for presentation on gemGeM ppt in railway  for presentation on gem
GeM ppt in railway for presentation on gem
CwierAsn
 
Exploring Abhay Bhutada’s Views After Poonawalla Fincorp’s Collaboration With...
Exploring Abhay Bhutada’s Views After Poonawalla Fincorp’s Collaboration With...Exploring Abhay Bhutada’s Views After Poonawalla Fincorp’s Collaboration With...
Exploring Abhay Bhutada’s Views After Poonawalla Fincorp’s Collaboration With...
beulahfernandes8
 

Recently uploaded (20)

Scope Of Macroeconomics introduction and basic theories
Scope Of Macroeconomics introduction and basic theoriesScope Of Macroeconomics introduction and basic theories
Scope Of Macroeconomics introduction and basic theories
 
The new type of smart, sustainable entrepreneurship and the next day | Europe...
The new type of smart, sustainable entrepreneurship and the next day | Europe...The new type of smart, sustainable entrepreneurship and the next day | Europe...
The new type of smart, sustainable entrepreneurship and the next day | Europe...
 
Commercial Bank Economic Capsule - May 2024
Commercial Bank Economic Capsule - May 2024Commercial Bank Economic Capsule - May 2024
Commercial Bank Economic Capsule - May 2024
 
Webinar Exploring DORA for Fintechs - Simont Braun
Webinar Exploring DORA for Fintechs - Simont BraunWebinar Exploring DORA for Fintechs - Simont Braun
Webinar Exploring DORA for Fintechs - Simont Braun
 
Chương 6. Ancol - phenol - ether (1).pdf
Chương 6. Ancol - phenol - ether (1).pdfChương 6. Ancol - phenol - ether (1).pdf
Chương 6. Ancol - phenol - ether (1).pdf
 
Empowering the Unbanked: The Vital Role of NBFCs in Promoting Financial Inclu...
Empowering the Unbanked: The Vital Role of NBFCs in Promoting Financial Inclu...Empowering the Unbanked: The Vital Role of NBFCs in Promoting Financial Inclu...
Empowering the Unbanked: The Vital Role of NBFCs in Promoting Financial Inclu...
 
Summary of financial results for 1Q2024
Summary of financial  results for 1Q2024Summary of financial  results for 1Q2024
Summary of financial results for 1Q2024
 
The Evolution of Non-Banking Financial Companies (NBFCs) in India: Challenges...
The Evolution of Non-Banking Financial Companies (NBFCs) in India: Challenges...The Evolution of Non-Banking Financial Companies (NBFCs) in India: Challenges...
The Evolution of Non-Banking Financial Companies (NBFCs) in India: Challenges...
 
how to sell pi coins in all Africa Countries.
how to sell pi coins in all Africa Countries.how to sell pi coins in all Africa Countries.
how to sell pi coins in all Africa Countries.
 
what is the future of Pi Network currency.
what is the future of Pi Network currency.what is the future of Pi Network currency.
what is the future of Pi Network currency.
 
how to sell pi coins on Bitmart crypto exchange
how to sell pi coins on Bitmart crypto exchangehow to sell pi coins on Bitmart crypto exchange
how to sell pi coins on Bitmart crypto exchange
 
how to sell pi coins at high rate quickly.
how to sell pi coins at high rate quickly.how to sell pi coins at high rate quickly.
how to sell pi coins at high rate quickly.
 
managementaccountingunitiv-230422140105-dd17d80b.ppt
managementaccountingunitiv-230422140105-dd17d80b.pptmanagementaccountingunitiv-230422140105-dd17d80b.ppt
managementaccountingunitiv-230422140105-dd17d80b.ppt
 
234Presentation on Indian Debt Market.ppt
234Presentation on Indian Debt Market.ppt234Presentation on Indian Debt Market.ppt
234Presentation on Indian Debt Market.ppt
 
where can I find a legit pi merchant online
where can I find a legit pi merchant onlinewhere can I find a legit pi merchant online
where can I find a legit pi merchant online
 
一比一原版BCU毕业证伯明翰城市大学毕业证成绩单如何办理
一比一原版BCU毕业证伯明翰城市大学毕业证成绩单如何办理一比一原版BCU毕业证伯明翰城市大学毕业证成绩单如何办理
一比一原版BCU毕业证伯明翰城市大学毕业证成绩单如何办理
 
what is the best method to sell pi coins in 2024
what is the best method to sell pi coins in 2024what is the best method to sell pi coins in 2024
what is the best method to sell pi coins in 2024
 
how can I sell/buy bulk pi coins securely
how can I sell/buy bulk pi coins securelyhow can I sell/buy bulk pi coins securely
how can I sell/buy bulk pi coins securely
 
GeM ppt in railway for presentation on gem
GeM ppt in railway  for presentation on gemGeM ppt in railway  for presentation on gem
GeM ppt in railway for presentation on gem
 
Exploring Abhay Bhutada’s Views After Poonawalla Fincorp’s Collaboration With...
Exploring Abhay Bhutada’s Views After Poonawalla Fincorp’s Collaboration With...Exploring Abhay Bhutada’s Views After Poonawalla Fincorp’s Collaboration With...
Exploring Abhay Bhutada’s Views After Poonawalla Fincorp’s Collaboration With...
 

New perspectives on asset class investing

  • 1. © 2019 BAM Advisor Services LLC d/b/a Loring Ward (“Loring Ward”). All rights reserved. R 19-102 NEW PERSPECTIVES ON ASSET CLASS INVESTING
  • 2. Investing Starts with a Plan People invest their money to reach a goal Creating a plan clarifies those goals ?$
  • 3. $ Investing Starts with a Plan Primary Objective: Don’t run out of money ?$
  • 4. Financial Planning Software For illustrative purposes only. Past performance does not guarantee future results and there is no guarantee that the strategies set forth in this presentation will achieve their intended objectives. Based on historical market index return data and realistic expectations
  • 5. Historical Long-Term Rate of Return Past performance does not guarantee future results. See appendix for additional information. 6-11%
  • 6. Thousands of Investment Options Passive
  • 7. You Have Two Choices Diversification neither assures a profit nor guarantees against loss in a declining market. Active Stock Picking Market Timing Passive Diversified group of securities Tax efficiency
  • 8. Poor Track Record for Active Managers Source: Standard & Poor’s Indices Versus Active Funds Scorecard (SPIVA) 2019. Index used for comparison: U.S. Stocks — S&P 1500 Index; Emerging Stocks — S&P/IFCI Composite; International Stocks— S&P 700 Index; Short-Term U.S. Gov’t Bonds — Barclays US Government (1-3 Year), Global Bonds — Barclays Global Aggregate. Outperformance is based upon equal weight fund counts. Index returns do not include payment of any sales charges or fees an investor would pay to purchase the securities they represent. Such costs would lower performance. Past performance is not an indication of future results. More recent performance may alter these assessments or outcomes. Percentage of Active Funds that Outperformed Their Index 2009 - 2018 U.S. Stocks Emerging Stocks International Stocks Short-Term U.S. Gov’t Bonds Global Bonds 0% 20% 40% 60% 80% 100% 16% 12% 19% 32% 53%
  • 9. You Have Two Choices Active Stock Picking Market Timing Passive Diversified group of securities Tax efficiency Diversification neither assures a profit nor guarantees against loss in a declining market.
  • 10. Thousands of Investment Options Passive
  • 11. You Have Two More Choices Index investing targets a specific set of securities at specific weights as designated by an index provider, with the risks associated with that particular part of the market. Asset class investing targets a specific part of the market by maintaining consistent exposure to securities which fit the targeted characteristics but are not beholden to a specific list of securities provided by an index provider, with risks associated with that particular part of the market. Passive Index Asset Class Diversified group of securities Tax efficiency Diversified group of securities Tax efficiency Diversified group of securities Tax efficiency Precision
  • 13. You Have Two More Choices Index investing targets a specific set of securities at specific weights as designated by an index provider, with the risks associated with that particular part of the market. Asset class investing targets a specific part of the market by maintaining consistent exposure to securities which fit the targeted characteristics but are not beholden to a specific list of securities provided by an index provider, with risks associated with that particular part of the market. Passive Index Diversified group of securities Tax efficiency Asset Class Diversified group of securities Tax efficiency Precision Diversified group of securities Tax efficiency Precision Flexibility
  • 15. Asset Class Diversified group of securities Tax efficiency Precision Flexibility Diversified group of securities Tax efficiency Precision Flexibility Factors of return You Have Two More Choices Index investing targets a specific set of securities at specific weights as designated by an index provider, with the risks associated with that particular part of the market. Asset class investing targets a specific part of the market by maintaining consistent exposure to securities which fit the targeted characteristics but are not beholden to a specific list of securities provided by an index provider, with risks associated with that particular part of the market. Passive Index Diversified group of securities Tax efficiency
  • 17. Are All Passive the Same? Diversification Tax Efficiency Precision Flexibility Factors of Return
  • 18. THERE MAY BE A BETTER ALTERNATIVE TO INDEX RETURNS
  • 19. Asset Class Fund Returns Annualized Returns % 2009 – 2018. See slides 27-29 for complete data. Performance data shown represents past performance and is no guarantee of future results. Current performance may be higher or lower than the performance shown. The indices are not available for direct investment; therefore, their performance does not reflect the expenses associated with the management of an actual portfolio. See “Appendix: Standardized Performance Data & Disclosures” to obtain complete information on performance, investment objectives, risks, advisory fees, and expenses of Dimensional’s funds. Sources: Dimensional Fund Advisors for Dimensional funds; Mutual fund universe statistical data provided by Morningstar, Inc.; MSCI data copyright MSCI 2019, all rights reserved. U.S. Large Cap U.S. Large Value U.S. Small Cap 5-Year Global Fixed International Large Value 0% 2% 4% 6% 8% 10% Benchmark Morningstar Category Dimensional Funds 12% 14% 13.19 11.43 13.18 13.17 10.45 11.18 13.39 11.35 11.97 2.80 3.41 1.69 6.11 5.19 5.69
  • 20. Asset Class Investing Can Offer 1. Lower overall costs 2. Improved tax efficiency 3. Increased diversification 4. Better risk exposure to an asset class 5. Potentially better long-term performance
  • 21. 2% 65/35 Portfolio 17% 16% 15% 12% 14% 5% 4% 8% 7% Two Portfolios… 100% S&P 500 Index Cash & Cash Alternatives Global Fixed Income Short-Term Fixed Income 1-3 Years U.S. Market U.S. Large Value U.S. Small Neutral International Large Value International Small Neutral Emerging Markets REITs
  • 22. Let’s Look at What Happened Since 2000… Source: Morningstar Direct 2019. Allocation is 100% S&P 500 TR, and 65/35 Mix represented by: 2% (Cash), 16% (DFA One Year Fixed Income DFIHX), 17% (DFA 5 Year Global DFGBX), 15% (DFA US Core Equity 1 DFEOX), 12% (DFA US Large Cap Value DFLVX), 8% (DFA US Small Cap DFSTX), 4% (DFA REIT DFREX), 14% (DFA Intl Value DFIVX), 7% (DFA Intl Small Cap DFISX), 5% (DFA Emerging Markets Value DFEVX). Allocation mix return is the weighted average return of the respective funds, rebalanced annually. The performance data quoted represents past performance. Past performance does not guarantee future results and principal value will fluctuate so that an investor's shares, when redeemed, may be worth more or less than their original cost. Index performance does not reflect the expenses associated with the management of an actual portfolio. Portfolio performance does not reflect the deduction of any fees charged by an independent investment advisor or other service provider to an individual account. Such fees, if taken into consideration, will reduce the performance quoted above. *Standard Deviation is a statistical measurement that sheds light on historical volatility. Allocation Annualized Return (2000-2018) Standard Deviation* (2000 – 2018) S&P 500 Index 4.86% 17.65% 65/35 Allocation Mix 4.92% 12.74%
  • 23. $0 $100,000 $200,000 $300,000 $400,000 $500,000 $600,000 1999 2000 2001 2002 2003 2004 2005 2006 2007 2008 2009 2010 2011 2012 2013 2014 2015 2016 2017 2018 65/35 S&P 500 $237,239 PortfolioValue $0 $627,922 Impact of a 5% Withdrawal Source: Morningstar Direct 2019. Hypothetical value of $500000 invested on January 1, 2000 and kept invested through December 31, 2018. Withdraw is 5% of initial hypothetical value ($25,000 of initial $500,000 starting value) taken out at start of each year, growing by 3% per year. Allocation is 100% S&P 500 TR, and 65/35 Mix represented by: 2% (Cash), 16% (DFA One Year Fixed Income DFIHX), 17% (DFA 5 Year Global DFGBX), 15% (DFA US Core Equity 1 DFEOX), 12% (DFA US Large Cap Value DFLVX), 8% (DFA US Small Cap DFSTX), 4% (DFA REIT DFREX), 14% (DFA Intl Value DFIVX), 7% (DFA Intl Small Cap DFISX), 5% (DFA Emerging Markets Value DFEVX). The performance data quoted represents past performance. Past performance does not guarantee future results and principal value will fluctuate so that an investor's shares, when redeemed, may be worth more or less than their original cost. Indexes are unmanaged baskets of securities that are not available for direct investment by investors. Index performance does not reflect the expenses associated with the management of an actual portfolio. Portfolio returns are the weighted average returns of the respective funds, rebalanced annually. Actual rebalancing may be different. The portfolio allocations are based on a Loring Ward model portfolio, which may not be suitable for all investors. It may not reflect the impact material economic and market factors might have had on decision making if clients’ money were actually being managed at that time. The performance quoted reflects the reinvestment of dividends and capital gains distributions. Portfolio performance does not reflect the deduction of any fees charged by an independent investment advisor or other service provider to an individual account. Such fees, if taken into consideration, will reduce the performance quoted above.
  • 24. 1 & 30 = ?
  • 25. 1 & 30 = ? Make sure you have the highest probability of capturing market returns
  • 27. Standardized Performance Data and Disclosures U.S. Large Cap: DFA US Core Equity 1, US Fund Large Blend, Russell 3000 USD Index. U.S. Large Value: DFA US Large Cap Value, US OE Large Value, Russell 1000 Value Index. U.S. Small: DFA US Small Cap, US Fund Small Blend, Russell 2000 Index. 5-Year Global Fixed: DFA Five-Year Global Fixed-Income, US Fund World Bond, Citigroup World Government Bond Index 1-5 Years (hedged). International Large Value: DFA International Value, US Fund Foreign Large Value, MSCI World ex US Value Index Morningstar categories are based on Morningstar’s methodology which classifies funds based on their investment styles, market capitalization and asset mix as measured by their underlying portfolio holdings over the past three years. Dimensional Fund Advisors is an investment advisor registered with the Securities and Exchange Commission and is unaffiliated with BAM Advisor Services LLC d/b/a Loring Ward. Consider the investment objectives, risks, charges and expenses of the funds listed carefully before investing. The prospectus and if available, summary prospectus, contain this and other information about the funds. To obtain a DFA Funds prospectus, summary prospectus, additional information about the DFA Funds, or performance data current to the most recent month-end, please call Dimensional Fund Advisors collect at 512-306-7400; or visit www.dimensional.com. Please read the prospectus and summary prospectus carefully before investing.
  • 28. Standardized Performance Data and Disclosures Name Prospectus Gross Expense Ratio (%) 3-Month Return (%) 1-Year Return (%) 5-Year Return (%) 10-Year Return (%) Total Ret Inception (Qtr-End) (%) Inception Date ICE BofAML 1-3Y US Corp&Govt TR USD 1.17 1.63 1.04 1.56 4.71 6/30/86 FTSE WGBI 1-5 Yr Hdg USD 1.53 2.12 1.53 1.69 5.27 12/31/84 DFA Emerging Markets Value I 0.54 -7.17 -11.93 1.85 8.19 9.59 4/1/98 DFA Five-Year Global Fixed-Income I 0.27 1.24 1.68 1.95 2.80 5.11 11/6/90 DFA International Small Company I 0.53 -16.54 -19.42 1.96 9.53 6.31 9/30/96 DFA International Value I 0.43 -14.63 -17.49 -0.35 6.11 5.67 2/15/94 DFA One-Year Fixed-Income I 0.17 0.78 1.87 0.84 0.92 4.54 7/25/83 DFA Real Estate Securities I 0.18 -5.15 -2.99 8.51 12.41 9.55 1/5/93 DFA US Core Equity 1 I 0.19 -15.94 -7.79 6.89 13.19 7.65 9/15/05 DFA US Large Cap Value I 0.27 -14.72 -11.65 5.83 13.17 9.60 2/19/93 DFA US Small Cap I 0.37 -20.15 -13.13 3.87 13.39 9.79 3/19/92 DJ US Select REIT TR USD -6.61 -4.22 7.89 12.05 8.71 12/31/86 Loring Ward Global Moderate DFA 0.30 -9.47 -8.11 2.49 7.08 5.87 10/1/96 MSCI EM Value NR USD -6.75 -10.74 0.51 6.99 9.36 12/29/00 MSCI World Ex USA Small Cap NR USD -16.16 -18.07 2.25 10.06 7.41 12/29/00
  • 29. Standardized Performance Data and Disclosures Data as of 12/31/18 The performance data quoted represents past performance. Past performance does not guarantee future results and principal value will fluctuate so that an investor's shares, when redeemed, may be worth more or less than their original cost. Current performance may be lower or higher than the performance information quoted. All Investing involves risks, including the loss of principal. Portfolio returns are the weighted average returns of the respective funds, rebalanced annually. Actual rebalancing may be different. The portfolio allocations are based on a Loring Ward model portfolio, which may not be suitable for all investors. It may not reflect the impact material economic and market factors might have had on decision making if clients’ money were actually being managed at that time. The performance quoted reflects the reinvestment of dividends and capital gains distributions. Portfolio returns are after fund’s internal expenses and Loring Ward’s max investment management fee of 0.90% through April 1, 2017, 0.65% thereafter. Management fee may be lower depending on the assets under management. Portfolio performance does not reflect the deduction of any fees charged by an independent investment advisor or other service provider to an individual account. Such fees, if taken into consideration, will reduce the performance quoted above. The model performance information reflects various allocation changes made over time. Therefore the underlying mutual funds used in calculating the portfolio performance may not represent the trailing returns of portfolios and/or the mutual funds currently available. Name 3-Month Return (%) 1-Year Return (%) 5-Year Return (%) 10-Year Return (%) Total Ret Inception (Qtr-End) (%) Inception Date MSCI World Ex USA Value NR USD -12.05 -15.06 -0.73 5.69 10.47 12/31/74 Russell 1000 Value TR USD -11.72 -8.27 5.95 11.18 11.66 12/31/78 Russell 2000 TR USD -20.20 -11.01 4.41 11.97 11.09 12/31/78 Russell 3000 TR USD -14.30 -5.24 7.91 13.18 11.48 12/31/78 S&P 500 TR USD(1936) -13.52 -4.38 8.49 13.12 10.36 3/31/36 US Fund Foreign Large Value -12.36 -15.38 -0.63 5.19 8.13 6/1/81 US Fund Large Blend -13.54 -6.24 6.28 11.43 8.61 7/1/24 US Fund Large Value -12.51 -8.60 5.13 10.45 9.14 5/1/31 US Fund Small Blend -19.39 -12.73 3.06 11.35 8.27 6/1/56 US Fund World Bond 0.28 -1.41 1.29 3.41 7.36 2/1/81
  • 30. Data Appendix Poor Track Record for Active Managers Percentage of Active Funds that Outperformed their Index 2009 – 2018 Source: Standard & Poor’s Indices Versus Active Funds Scorecard (SPIVA), 2019. Index used for comparison: U.S. Stocks — The S&P 1500 Index: The S&P Composite 1500® combines three leading indices, the S&P 500®, the S&P MidCap 400®, and the S&P SmallCap 600® to cover approximately 90% of the U.S. market capitalization. It is designed for investors seeking to replicate the performance of the U.S. equity market or benchmark against a representative universe of tradable stocks. Emerging Stocks — The S&P/IFCI Composite Index: The S&P/IFCI is a liquid and investable subset of the S&P Emerging BMI, with the addition of South Korea. While the S&P Global BMI and S&P Frontier BMI are designed as comprehensive benchmark indices, the S&P/IFCI indices are designed to be sufficiently investable to support index tracking portfolios. The S&P/IFCI has a long and established history going back to 1988. International Stocks— The S&P 700 Index: The S&P 700 measures the non-U.S. component of the global equity market through an index that is designed to be highly liquid and efficient to replicate. The index covers all regions included in the S&P Global 1200 except for the U.S., which is represented by the S&P 500®. U.S. Bonds — Government Short, Barclays 1-3 Year Treasury Bond Index: The index measures the performance of U.S. Treasury securities that have a remaining maturity of at least one year and less than three years. Global Bonds — Global Income Funds, Barclays Global Aggregate Index: The Barclays Global Aggregate Index is a flagship measure of global investment-grade debt from twenty-four different local currency markets. This multi-currency benchmark includes fixed-rate treasury, government-related, corporate and securitized bonds from both developed and emerging markets issuers. Outperformance is based upon equal weight fund counts.
  • 31. The principals of Capital Associates Wealth Management, as individual financial advisers with Eagle Strategies LLC, a Registered Investment Adviser, offer their clients the services of Loring Ward, third party money manager available on Eagle Strategies Investment Management platform. Capital Associates Wealth Management, Eagle Strategies and Loring Ward are independently owned and operated. LWI Financial Inc. (“Loring Ward”) is an investment adviser registered with the Securities and Exchange Commission. Securities transactions are offered through its affiliate, Loring Ward Securities Inc., member FINRA/SIPC. B 16-020 (4/18) Capital Associates 6901 Rockledge Drive, Suite 500 Bethesda, Maryland 20817 (301) 581.4108 info@capitalassoc.net Rob Ugiansky robert@capitalassoc.net (800) 601.5281 Mitchell Katz mkatz@capitalassoc.net (800) 601.5281 http://www.capitalassoc.net