Download as PPSX, PPTX

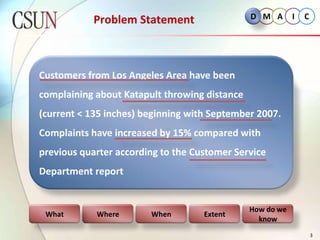
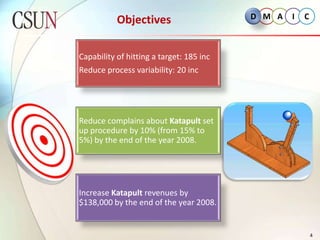
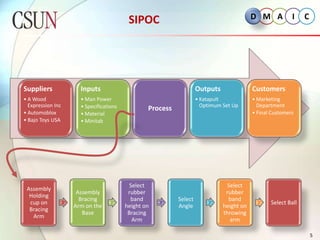
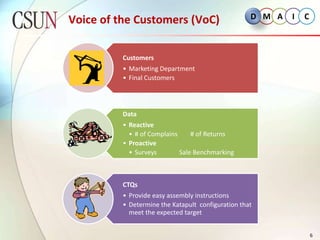
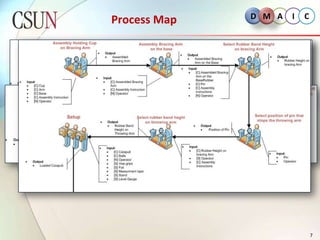
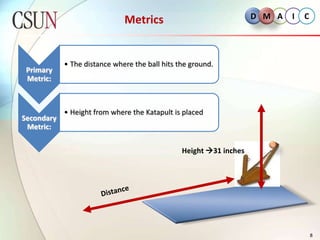
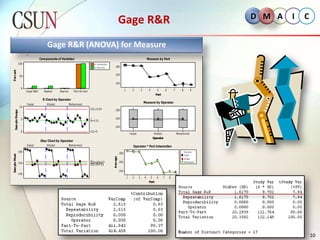
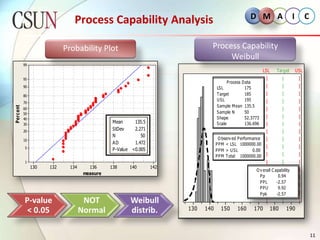
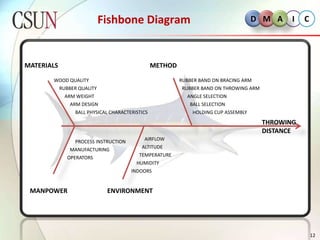
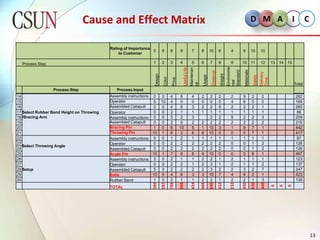
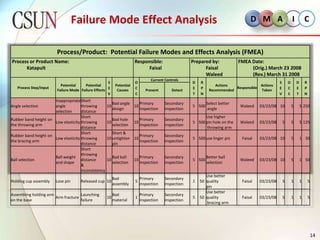
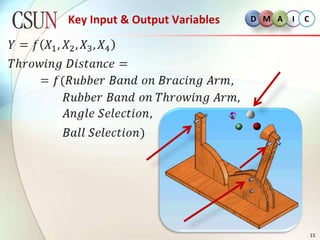
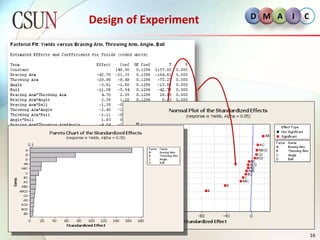
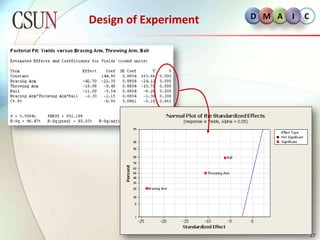
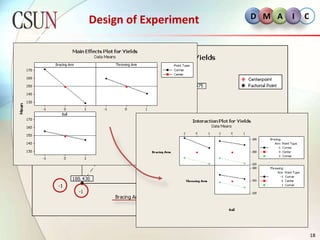
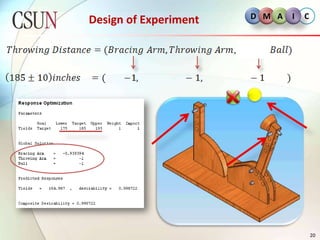
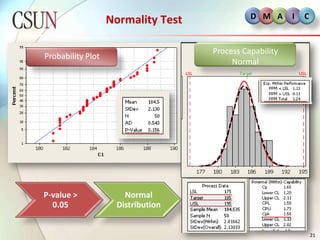
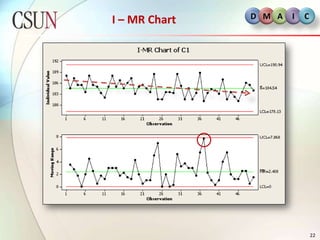
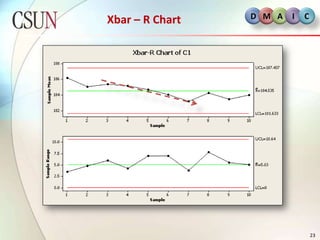
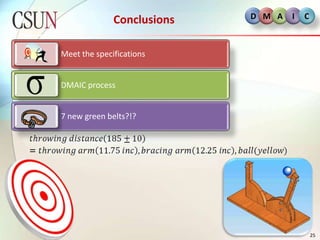


This document summarizes a Six Sigma project to improve the throwing distance of the Katapult toy. Customers had been complaining about distances being less than 135 inches. The project aims to increase the capability of hitting targets to 185 inches, reduce process variability by 20 inches, and reduce complaints about setup by 10%. Goals include increasing revenues by $138,000 by the end of 2008. The document outlines the problem statement, objectives, inputs/outputs, process mapping, analysis including gage R&R and process capability, identification of factors using fishbone diagram and failure mode effects analysis, design of experiments, and project schedule.