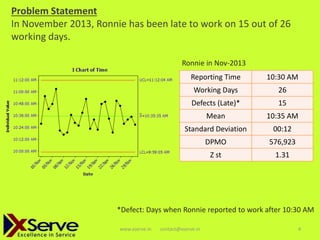
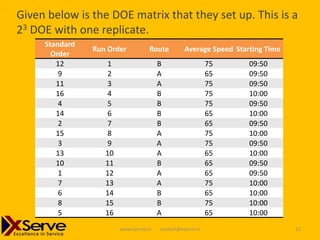
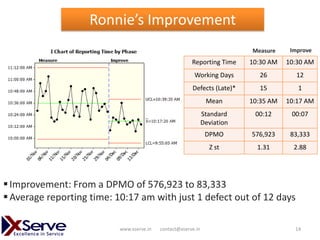
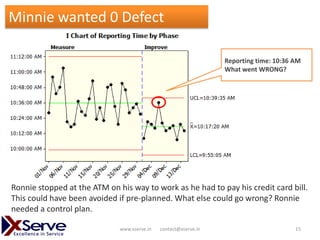
a Six Sigma Case Study by XServe Consulting
Steve, Ronnie’s Manager, had earlier
warned him on several occasions for
coming late to office.
This time, it was the FINAL Warning!!!

RONNIE, You were late to work on 15
out of 26 Days in November. Treat this
as my Final reminder to you.

Steve
(The Angry Boss)
www.xserve.in

contact@xserve.in

2
Ronnie met his girlfriend
Minnie for Dinner in the
evening.

Minnie assured an upset
Ronnie that she will help
him fix the problem.

www.xserve.in

contact@xserve.in

3
Problem Statement
In November 2013, Ronnie has been late to work on 15 out of 26
working days.
Ronnie in Nov-2013
Reporting Time

10:30 AM

Working Days

26

Defects (Late)*

15

Mean

10:35 AM

Standard Deviation

00:12

DPMO

576,923

Z st

1.31

*Defect: Days when Ronnie reported to work after 10:30 AM
www.xserve.in

contact@xserve.in

4
Let’s first look at the reasons for DELAY
The Start Time: Delay at Home
Early morning calls with Minnie
Breakfast
Waiting time for the
Catching up with Morning News
Elevator
Deciding what
Why do
Wake up time
to wear to work
Day of the
Week

Other Causes

Train

Don’t feel like
going to work

Mode of
Transport

www.xserve.in

Car

you get
LATE to
work?

Route Taken
Average speed

Re-filling fuel in
the morning

contact@xserve.in

5
Reasons for Delay
Root Cause

Ronnie’s Vote

Minnie’s Vote

Final Verdict

Wake-up time

Almost the same
everyday

I agree. Your Good
Morning messages
seem to be
automated

No further analysis

Catching up with
Morning News

Again, no change in
schedule regardless
of me reaching on
time or late

What’s in News
anyways?

No further analysis

Breakfast

Almost the same
everyday

It’s high time you
watch your eating
habits

No further analysis

What to wear to
office

Hardly matters

I agree. Your
wardrobe is another
project in itself

No further analysis

Waiting time for the
elevator

Not much variation

I agree

No further analysis

www.xserve.in

contact@xserve.in

6
Reasons for Delay
Root Cause
Early morning calls
with Minnie

Ronnie’s Vote

Minnie’s Vote

I guess we need to
look at time spent
on calls everyday

Yes, if anything, the
time has to increase.
And it’s my call
No further analysis
everyday that wakes
you up

Mode of Transport – Have not used for
Train
months
Car – Route Taken

Average Speed

Yes

Final Verdict

No further analysis

There are three
routes although I
use two (A and B)

The distance and
traffic on each route Further analysis
can impact your
needed
travel time

Could be a reason

I always tell you to
be more careful
while driving

www.xserve.in

contact@xserve.in

Further analysis
needed
7
Reasons for Delay
Root Cause

Ronnie’s Vote

Minnie’s Vote

Re-filling of fuel in
the morning

I always re-fill while
coming back from
work

Yes, while you are
on your way to meet
me. Hence, the
No further analysis
delays. This one was
simple

Day of the week

Could be a factor as
traffic density is
higher on certain
days

I agree.

Further analysis
needed

Don’t feel like going
to work

This is never the
case. Zero
absenteeism in 3
months

That is because I
asked you to save
your leaves for our
annual holiday

No further analysis

www.xserve.in

contact@xserve.in

Final Verdict

8
Impact of Day of the Week on Ronnie’s Reporting Time
Boxplot of Reporting Time
 Test used: Analysis of
Variance (ANOVA)
 P-Value: 0.748
 R-Square: 11.77%
 Observation: There is no
significant difference in
Ronnie’s reporting time to
work on different days of the
week

www.xserve.in

contact@xserve.in

9
 Minnie wanted to check the impact of selected route and
average driving speed
 As Ronnie did not have previous records of route and speed
(although he preferred Route A as that was the shortest
route), they set up a designed set of experiments with the
following settings:
Factor
Route Taken
Starting Time
Average Speed

Level (-1)
A
09:50 AM
65 kph

www.xserve.in

contact@xserve.in

Level (+1)
B
10:00 AM
75 kph
10
Given below is the DOE matrix that they set up. This is a
23 DOE with one replicate.
Standard
Order
12
9
11
16
4
14
2
15
3
13
10
1
7
6
8
5

Run Order

Route

1
2
3
4
5
6
7
8
9
10
11
12
13
14
15
16

B
A
A
B
B
B
B
A
A
A
B
A
A
B
B
A
www.xserve.in

Average Speed Starting Time

contact@xserve.in

75
65
75
75
75
65
65
75
75
65
65
65
75
65
75
65

09:50
09:50
09:50
10:00
09:50
10:00
09:50
10:00
09:50
10:00
09:50
09:50
10:00
10:00
10:00
10:00
11
Results of the Experiment
P = 0.000

P = 0.136

P = 0.200

Although Route B is a slightly longer route (13.6 km compared to 12.7 km for
Route A), the average travel time for Route B is less than 20 minutes. Average
Speed (65 or 75) and Starting Time (09:50 am or 10:00 am) do not have a
significant impact.
www.xserve.in

contact@xserve.in

12
Ronnie’s Improvement Plan
 Avoid using the shorter Route A
 Always use Route B while going to
work
 Ensure to leave from home
between 09:55 am and 10:00 am
 Minnie also warned him against
rash driving and asked him to
maintain an average driving speed
of 65 to 70 kph
 They decided to record data for the
next two weeks

www.xserve.in

contact@xserve.in

13
Ronnie’s Improvement
Measure

Improve

Reporting Time

10:30 AM

10:30 AM

Working Days

26

12

Defects (Late)*

15

1

Mean

10:35 AM

10:17 AM

Standard
Deviation

00:12

00:07

DPMO

576,923

83,333

Z st

1.31

2.88

 Improvement: From a DPMO of 576,923 to 83,333
 Average reporting time: 10:17 am with just 1 defect out of 12 days
www.xserve.in

contact@xserve.in

14
Minnie wanted 0 Defect
Reporting time: 10:36 AM
What went WRONG?

Ronnie stopped at the ATM on his way to work as he had to pay his credit card bill.
This could have been avoided if pre-planned. What else could go wrong? Ronnie
needed a control plan.
www.xserve.in

contact@xserve.in

15
Risk Assessment
What can go Wrong?
Delay in waking up as
slept late (late night
party, talking to Minnie,
watching movie etc.)
Daily errands (ATM,
paying bills, buying
cigarettes etc.)

Severity

Probability

Risk Score

(lower the
better)

(lower the
better)

(lower the
better)

7

9

3

4

Action Plan

21

2 step wake up alarm system to be
followed: Alarm call @ 08:00 am
and call from Minnie @ 08:15 am

36

Bill pay schedule to be planned at
the start of the month. Extra pack
of cigarettes to be stored in the car.
Emergency fund (Rs. 2000) to be
stored in the office bag.

Traffic Jams or slow
moving traffic

9

3

27

Check for traffic updates while
having breakfast on Android App
and change route or leave early if
necessary

Flat Tyre

9

1

9

Low probability but check everyday
after evening walk

www.xserve.in

contact@xserve.in

16
Ronnie’s Improvement

www.xserve.in

contact@xserve.in

17
Results
Nov-2013

Dec-2013

Reporting Time

10:30 AM

10:30 AM

Working Days

26

24

Defects (Late)*

15

1

Mean

10:35 AM

10:15 AM

Standard Deviation

00:12

00:06

DPMO

576,923

41,667

Z st

1.31

3.23

www.xserve.in

Significant reduction in Defects
(DPMO reduced from 576,923 to
41,667)
&

A
Happy
Boss

contact@xserve.in

18
a Six Sigma Case Study by XServe Consulting
Questions

contact@xserve.in
www.xserve.in
Twitter Handle: XServeIn
www.xserve.in

contact@xserve.in

20

Six Sigma Case Study

  • 1.
    a Six SigmaCase Study by XServe Consulting
  • 2.
    Steve, Ronnie’s Manager,had earlier warned him on several occasions for coming late to office. This time, it was the FINAL Warning!!! RONNIE, You were late to work on 15 out of 26 Days in November. Treat this as my Final reminder to you. Steve (The Angry Boss) www.xserve.in contact@xserve.in 2
  • 3.
    Ronnie met hisgirlfriend Minnie for Dinner in the evening. Minnie assured an upset Ronnie that she will help him fix the problem. www.xserve.in contact@xserve.in 3
  • 4.
    Problem Statement In November2013, Ronnie has been late to work on 15 out of 26 working days. Ronnie in Nov-2013 Reporting Time 10:30 AM Working Days 26 Defects (Late)* 15 Mean 10:35 AM Standard Deviation 00:12 DPMO 576,923 Z st 1.31 *Defect: Days when Ronnie reported to work after 10:30 AM www.xserve.in contact@xserve.in 4
  • 5.
    Let’s first lookat the reasons for DELAY The Start Time: Delay at Home Early morning calls with Minnie Breakfast Waiting time for the Catching up with Morning News Elevator Deciding what Why do Wake up time to wear to work Day of the Week Other Causes Train Don’t feel like going to work Mode of Transport www.xserve.in Car you get LATE to work? Route Taken Average speed Re-filling fuel in the morning contact@xserve.in 5
  • 6.
    Reasons for Delay RootCause Ronnie’s Vote Minnie’s Vote Final Verdict Wake-up time Almost the same everyday I agree. Your Good Morning messages seem to be automated No further analysis Catching up with Morning News Again, no change in schedule regardless of me reaching on time or late What’s in News anyways? No further analysis Breakfast Almost the same everyday It’s high time you watch your eating habits No further analysis What to wear to office Hardly matters I agree. Your wardrobe is another project in itself No further analysis Waiting time for the elevator Not much variation I agree No further analysis www.xserve.in contact@xserve.in 6
  • 7.
    Reasons for Delay RootCause Early morning calls with Minnie Ronnie’s Vote Minnie’s Vote I guess we need to look at time spent on calls everyday Yes, if anything, the time has to increase. And it’s my call No further analysis everyday that wakes you up Mode of Transport – Have not used for Train months Car – Route Taken Average Speed Yes Final Verdict No further analysis There are three routes although I use two (A and B) The distance and traffic on each route Further analysis can impact your needed travel time Could be a reason I always tell you to be more careful while driving www.xserve.in contact@xserve.in Further analysis needed 7
  • 8.
    Reasons for Delay RootCause Ronnie’s Vote Minnie’s Vote Re-filling of fuel in the morning I always re-fill while coming back from work Yes, while you are on your way to meet me. Hence, the No further analysis delays. This one was simple Day of the week Could be a factor as traffic density is higher on certain days I agree. Further analysis needed Don’t feel like going to work This is never the case. Zero absenteeism in 3 months That is because I asked you to save your leaves for our annual holiday No further analysis www.xserve.in contact@xserve.in Final Verdict 8
  • 9.
    Impact of Dayof the Week on Ronnie’s Reporting Time Boxplot of Reporting Time  Test used: Analysis of Variance (ANOVA)  P-Value: 0.748  R-Square: 11.77%  Observation: There is no significant difference in Ronnie’s reporting time to work on different days of the week www.xserve.in contact@xserve.in 9
  • 10.
     Minnie wantedto check the impact of selected route and average driving speed  As Ronnie did not have previous records of route and speed (although he preferred Route A as that was the shortest route), they set up a designed set of experiments with the following settings: Factor Route Taken Starting Time Average Speed Level (-1) A 09:50 AM 65 kph www.xserve.in contact@xserve.in Level (+1) B 10:00 AM 75 kph 10
  • 11.
    Given below isthe DOE matrix that they set up. This is a 23 DOE with one replicate. Standard Order 12 9 11 16 4 14 2 15 3 13 10 1 7 6 8 5 Run Order Route 1 2 3 4 5 6 7 8 9 10 11 12 13 14 15 16 B A A B B B B A A A B A A B B A www.xserve.in Average Speed Starting Time contact@xserve.in 75 65 75 75 75 65 65 75 75 65 65 65 75 65 75 65 09:50 09:50 09:50 10:00 09:50 10:00 09:50 10:00 09:50 10:00 09:50 09:50 10:00 10:00 10:00 10:00 11
  • 12.
    Results of theExperiment P = 0.000 P = 0.136 P = 0.200 Although Route B is a slightly longer route (13.6 km compared to 12.7 km for Route A), the average travel time for Route B is less than 20 minutes. Average Speed (65 or 75) and Starting Time (09:50 am or 10:00 am) do not have a significant impact. www.xserve.in contact@xserve.in 12
  • 13.
    Ronnie’s Improvement Plan Avoid using the shorter Route A  Always use Route B while going to work  Ensure to leave from home between 09:55 am and 10:00 am  Minnie also warned him against rash driving and asked him to maintain an average driving speed of 65 to 70 kph  They decided to record data for the next two weeks www.xserve.in contact@xserve.in 13
  • 14.
    Ronnie’s Improvement Measure Improve Reporting Time 10:30AM 10:30 AM Working Days 26 12 Defects (Late)* 15 1 Mean 10:35 AM 10:17 AM Standard Deviation 00:12 00:07 DPMO 576,923 83,333 Z st 1.31 2.88  Improvement: From a DPMO of 576,923 to 83,333  Average reporting time: 10:17 am with just 1 defect out of 12 days www.xserve.in contact@xserve.in 14
  • 15.
    Minnie wanted 0Defect Reporting time: 10:36 AM What went WRONG? Ronnie stopped at the ATM on his way to work as he had to pay his credit card bill. This could have been avoided if pre-planned. What else could go wrong? Ronnie needed a control plan. www.xserve.in contact@xserve.in 15
  • 16.
    Risk Assessment What cango Wrong? Delay in waking up as slept late (late night party, talking to Minnie, watching movie etc.) Daily errands (ATM, paying bills, buying cigarettes etc.) Severity Probability Risk Score (lower the better) (lower the better) (lower the better) 7 9 3 4 Action Plan 21 2 step wake up alarm system to be followed: Alarm call @ 08:00 am and call from Minnie @ 08:15 am 36 Bill pay schedule to be planned at the start of the month. Extra pack of cigarettes to be stored in the car. Emergency fund (Rs. 2000) to be stored in the office bag. Traffic Jams or slow moving traffic 9 3 27 Check for traffic updates while having breakfast on Android App and change route or leave early if necessary Flat Tyre 9 1 9 Low probability but check everyday after evening walk www.xserve.in contact@xserve.in 16
  • 17.
  • 18.
    Results Nov-2013 Dec-2013 Reporting Time 10:30 AM 10:30AM Working Days 26 24 Defects (Late)* 15 1 Mean 10:35 AM 10:15 AM Standard Deviation 00:12 00:06 DPMO 576,923 41,667 Z st 1.31 3.23 www.xserve.in Significant reduction in Defects (DPMO reduced from 576,923 to 41,667) & A Happy Boss contact@xserve.in 18
  • 19.
    a Six SigmaCase Study by XServe Consulting
  • 20.