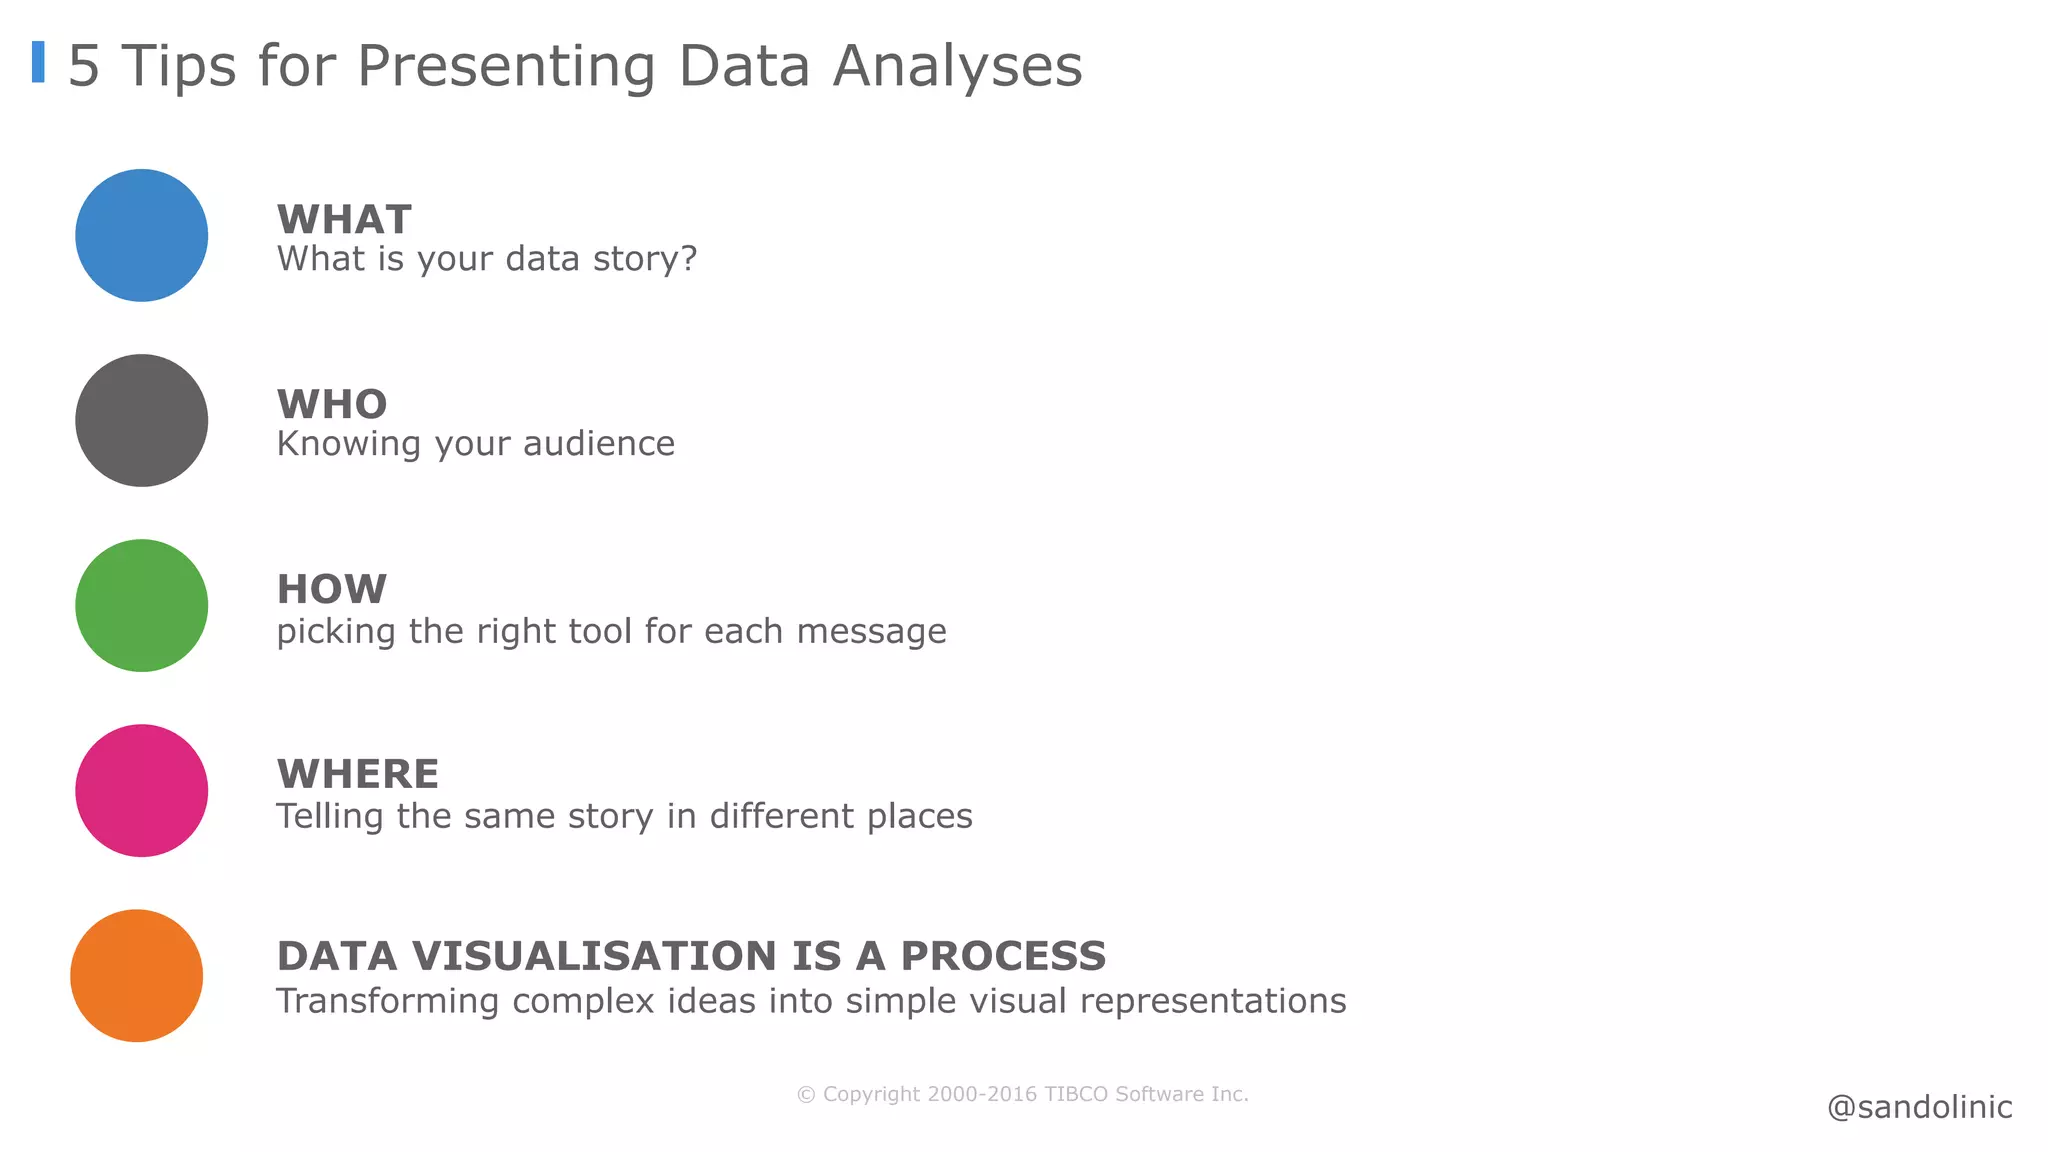
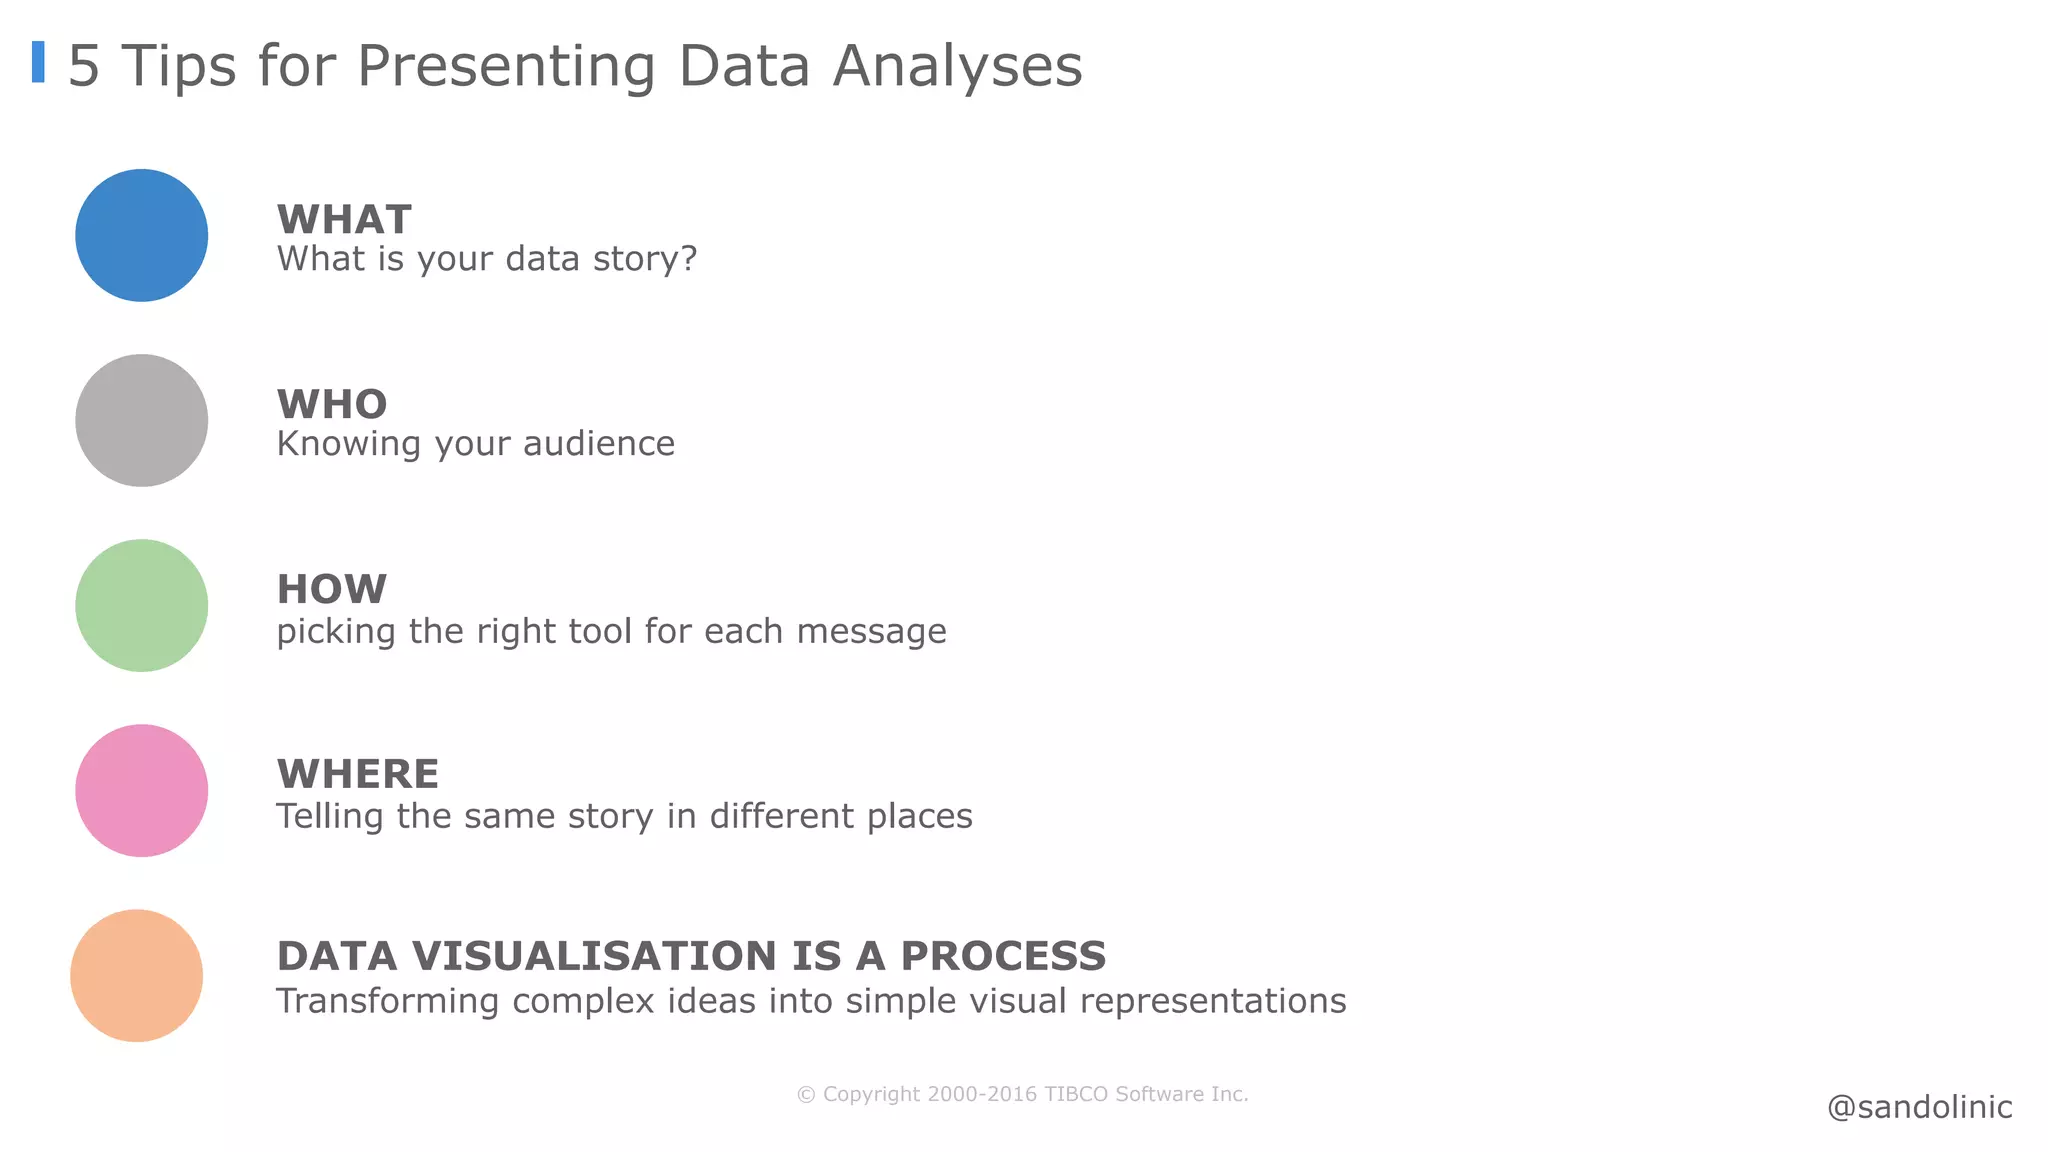
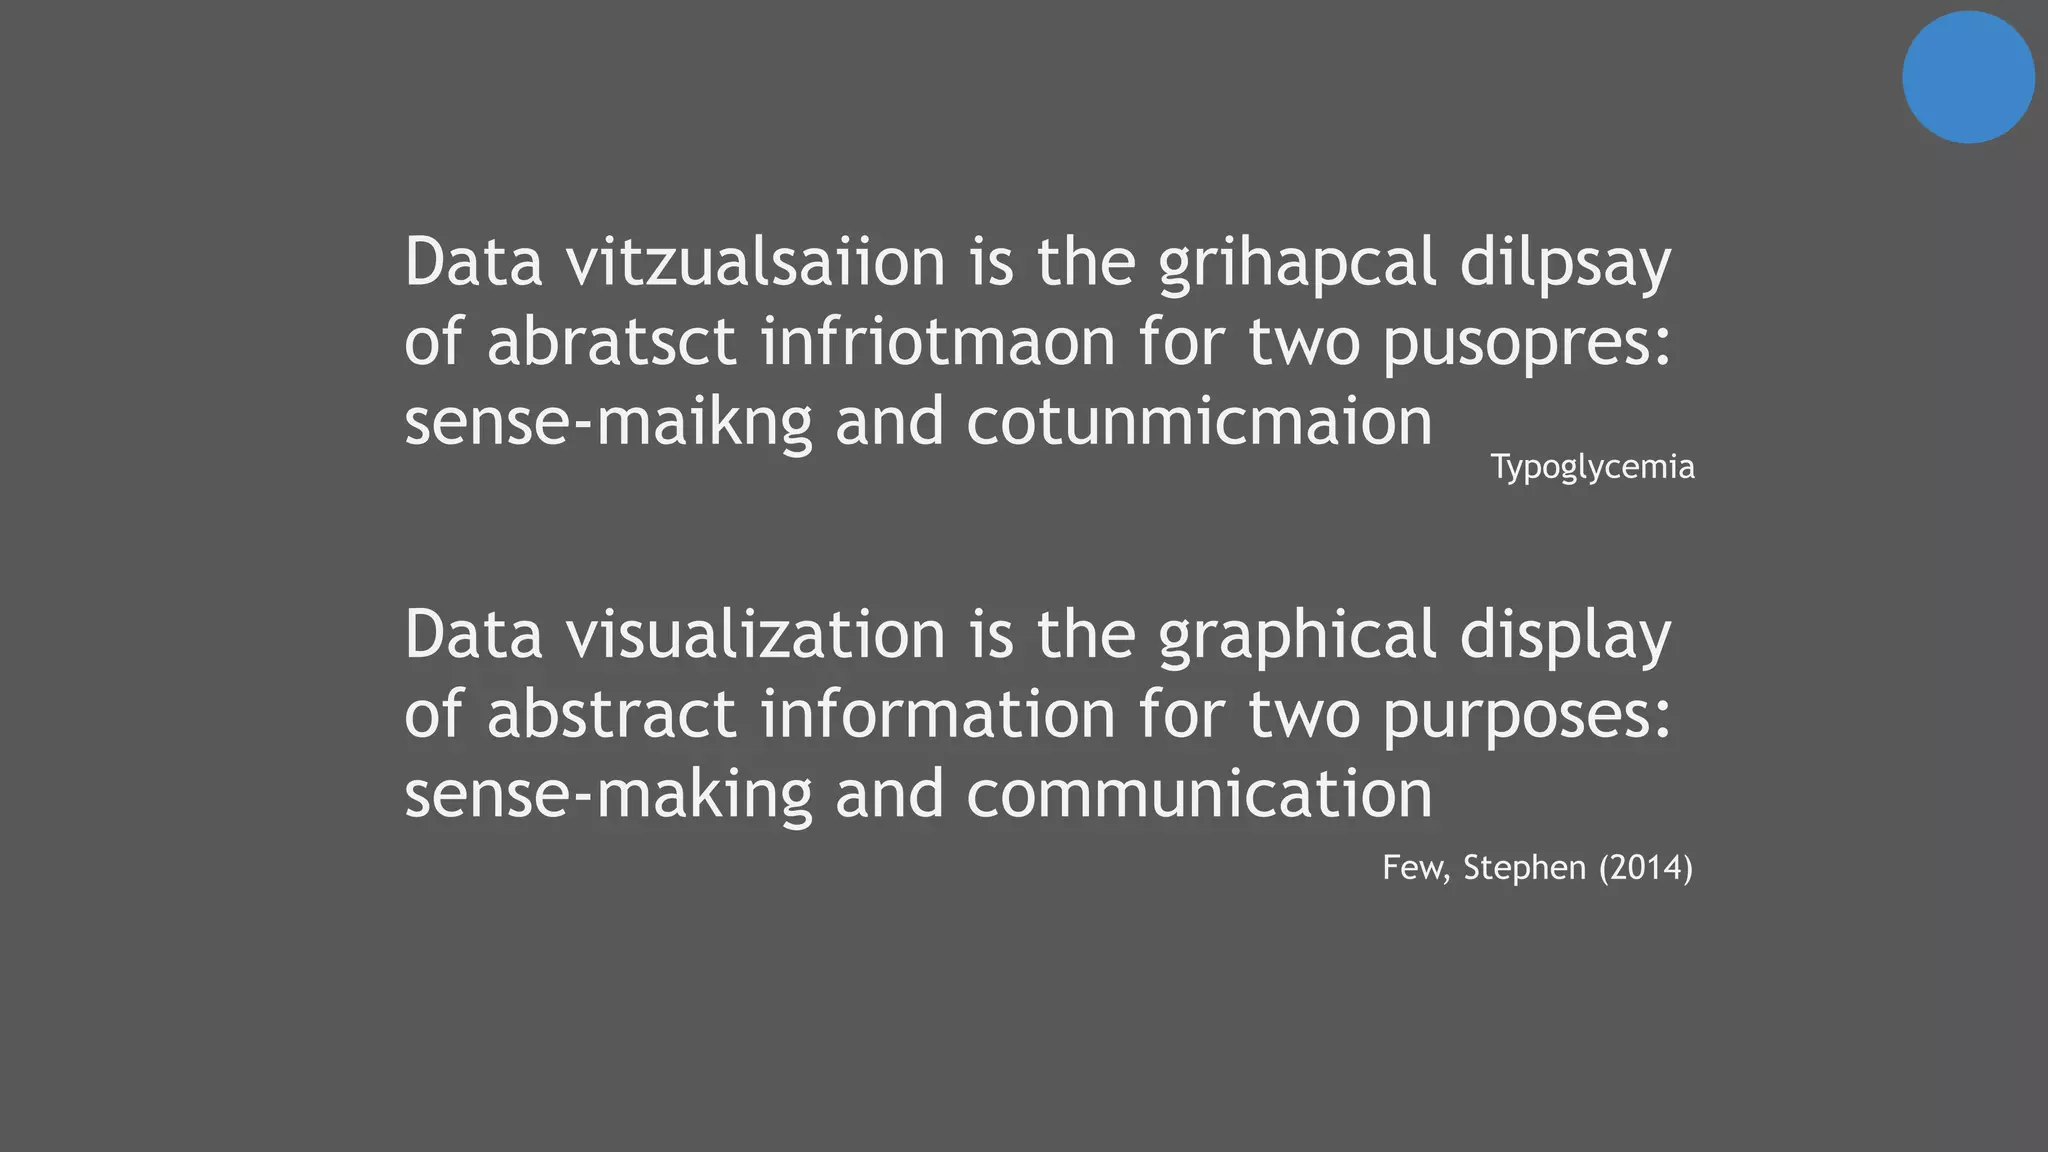
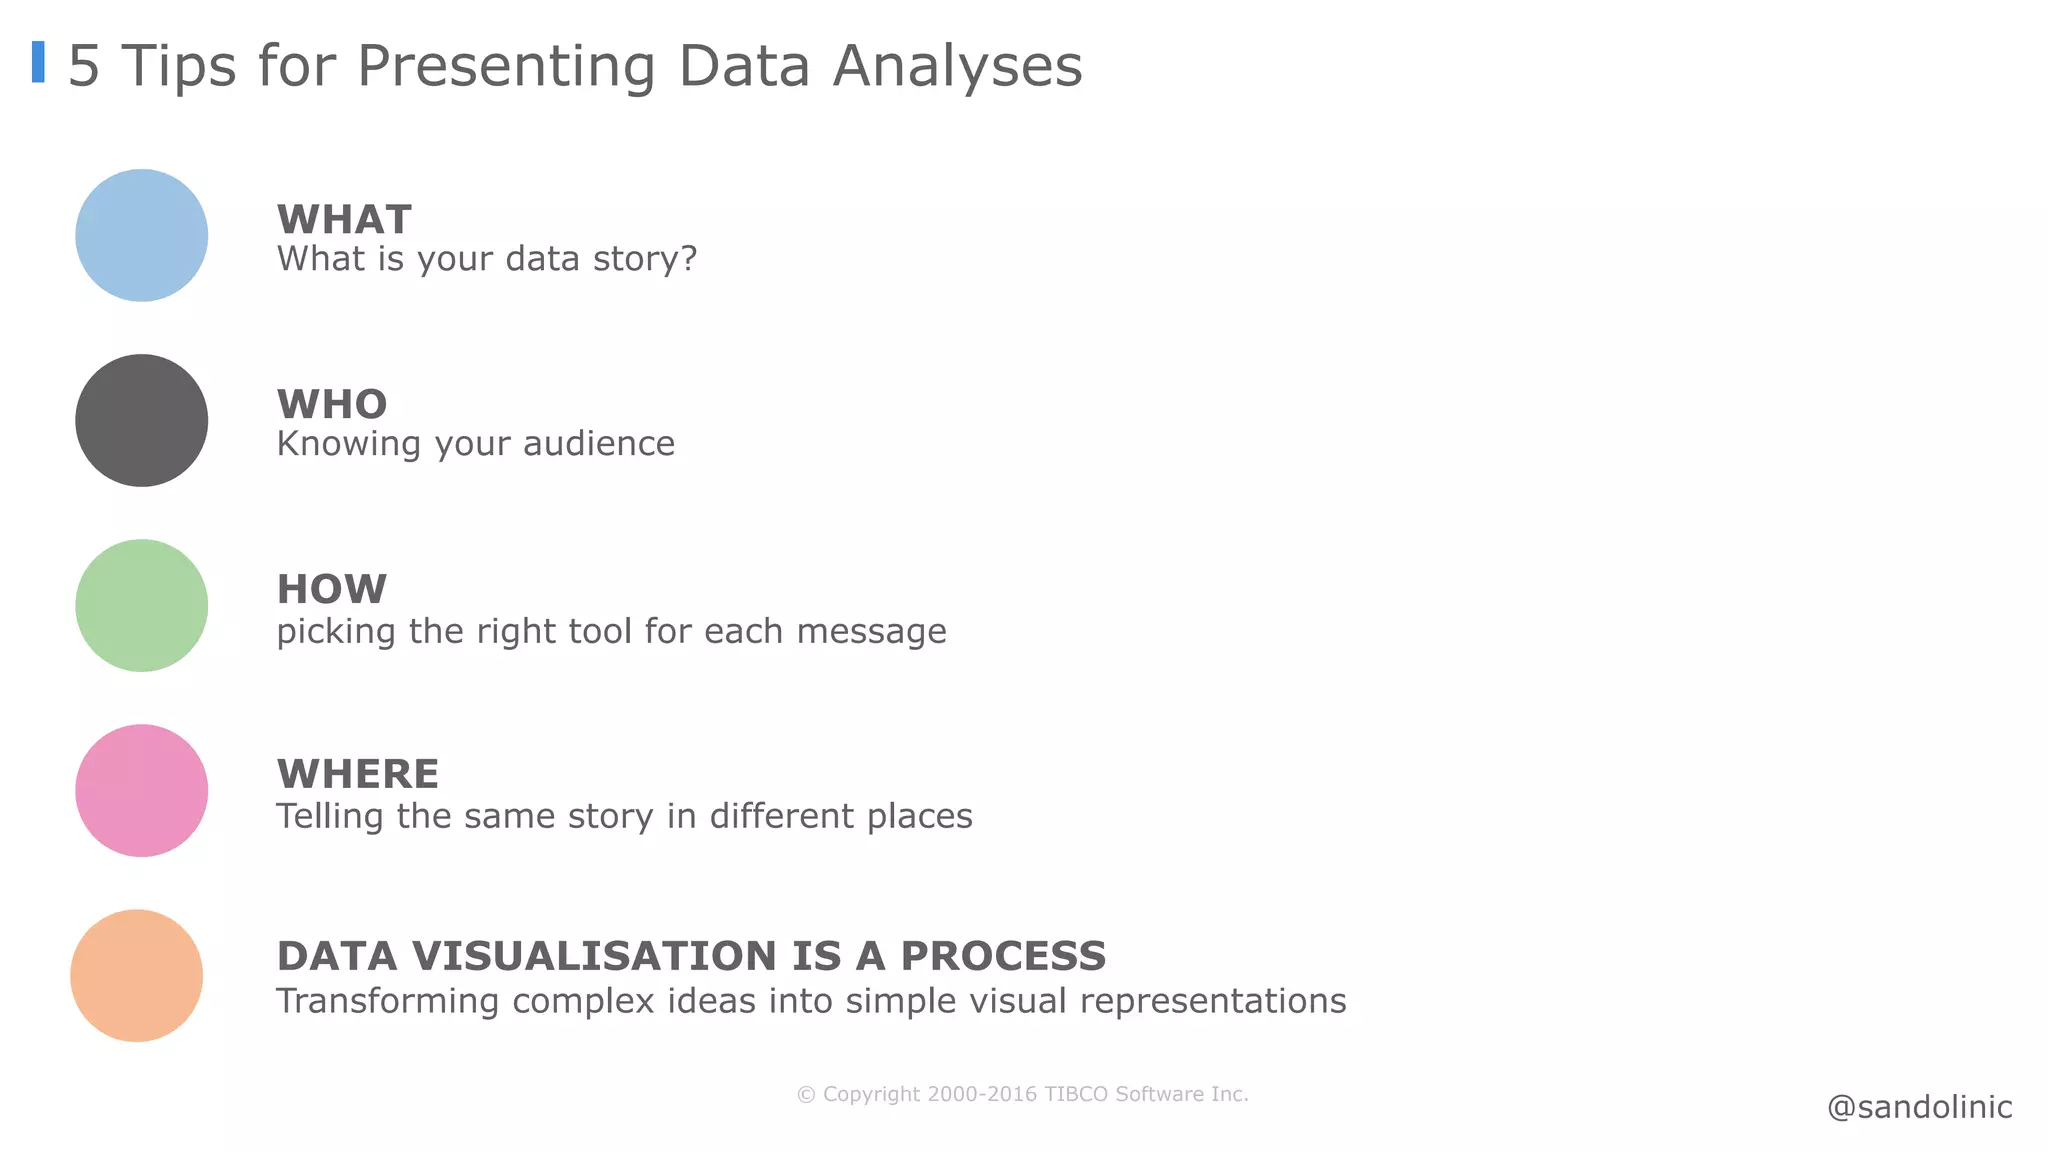
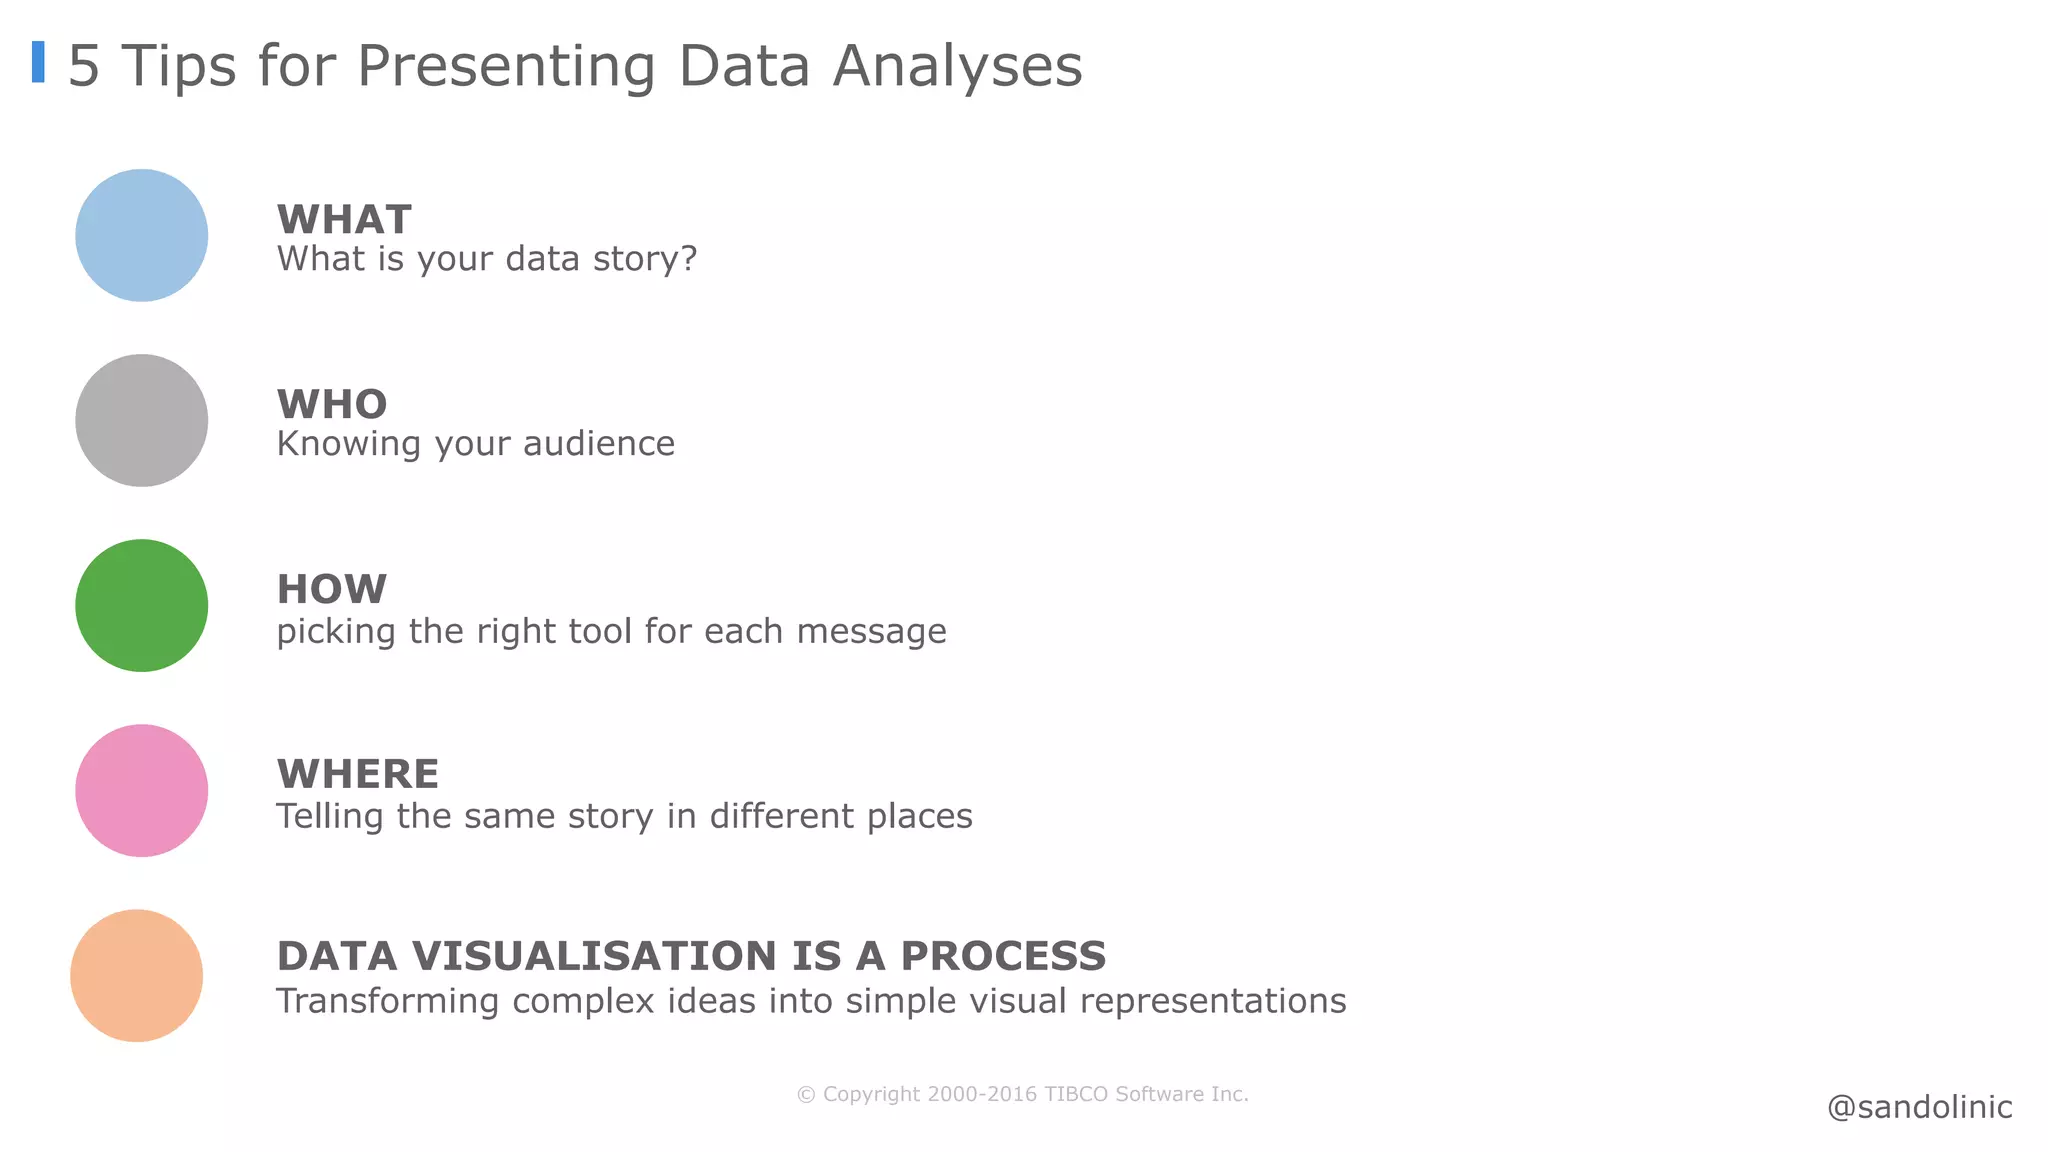
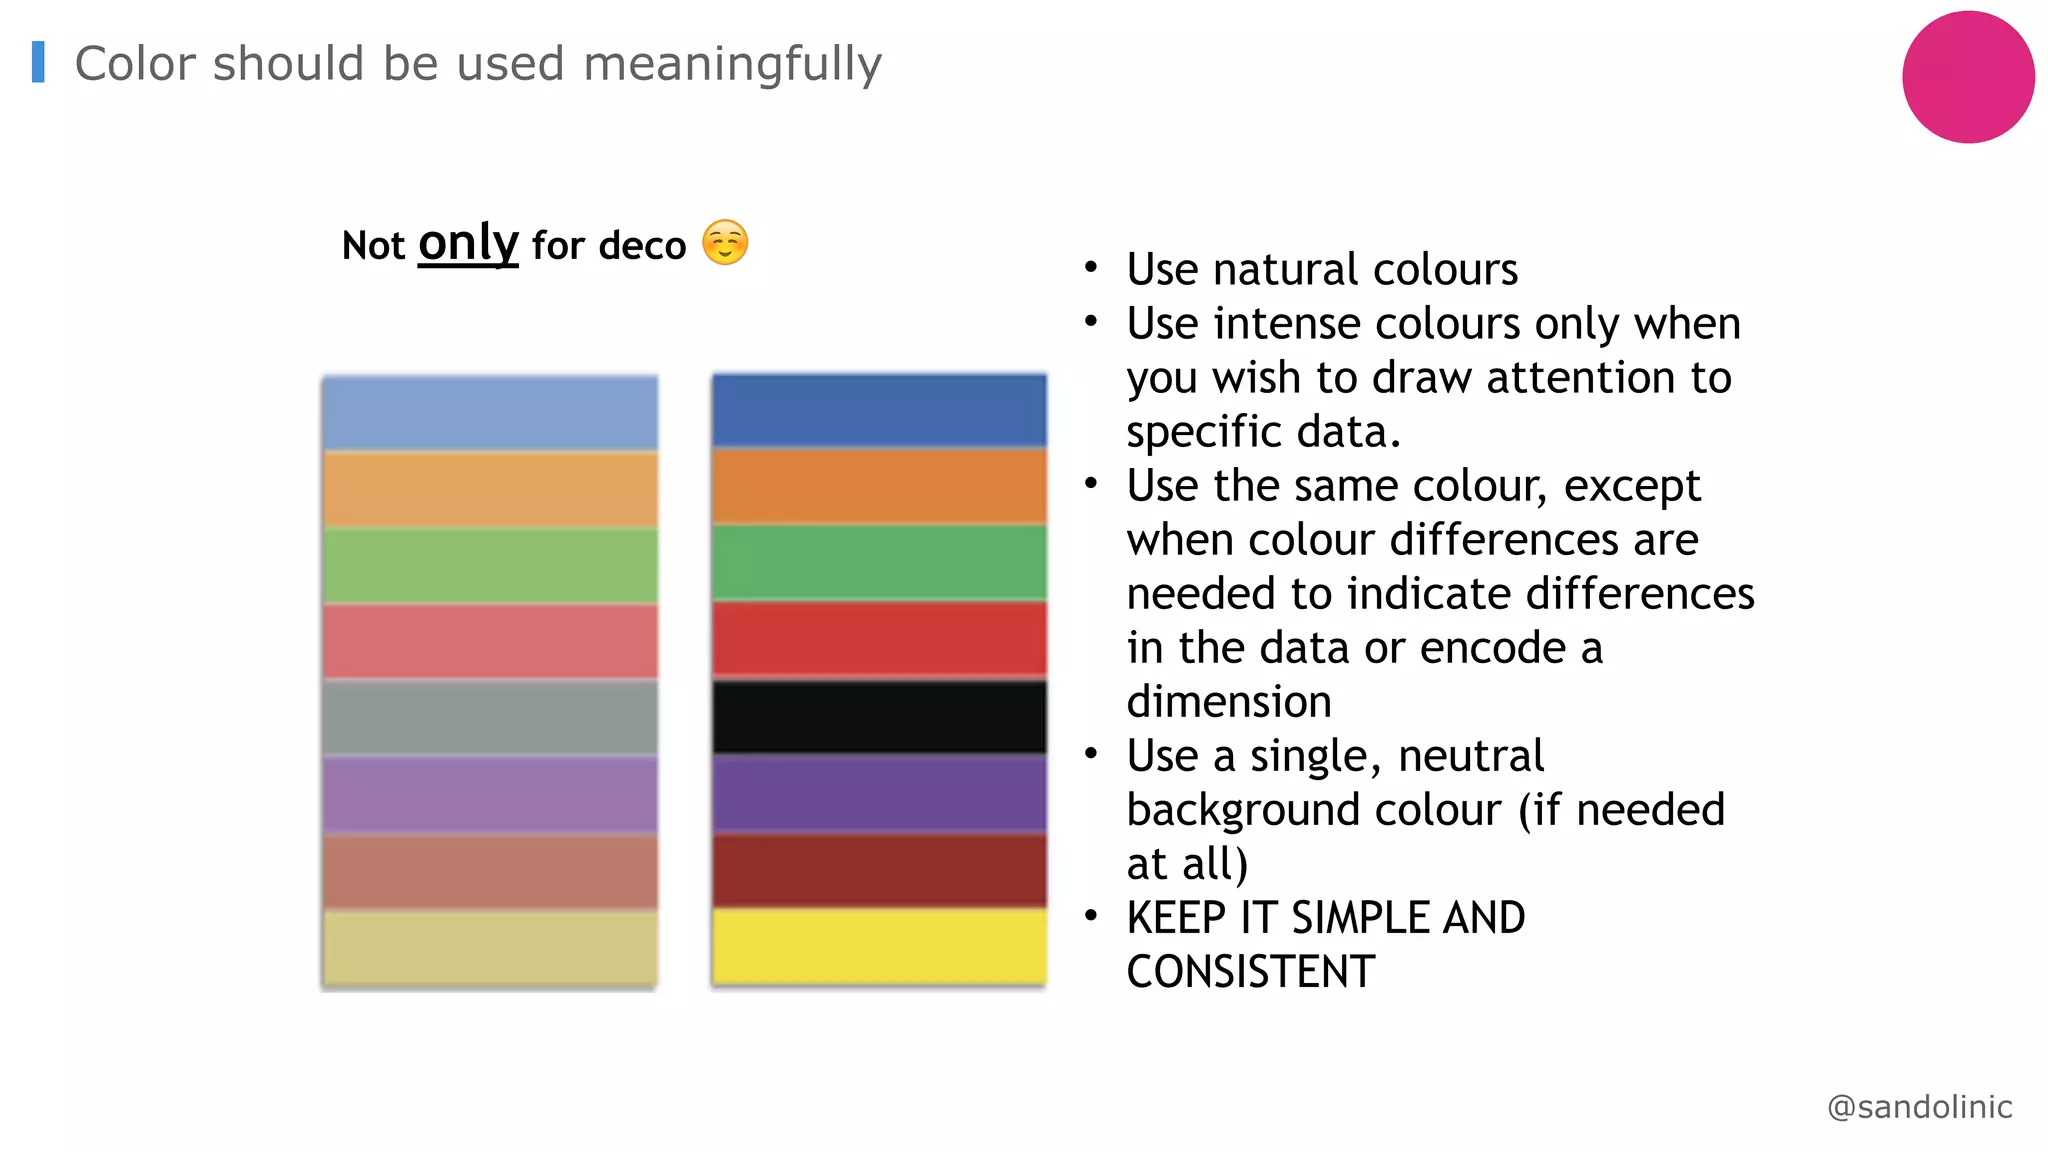
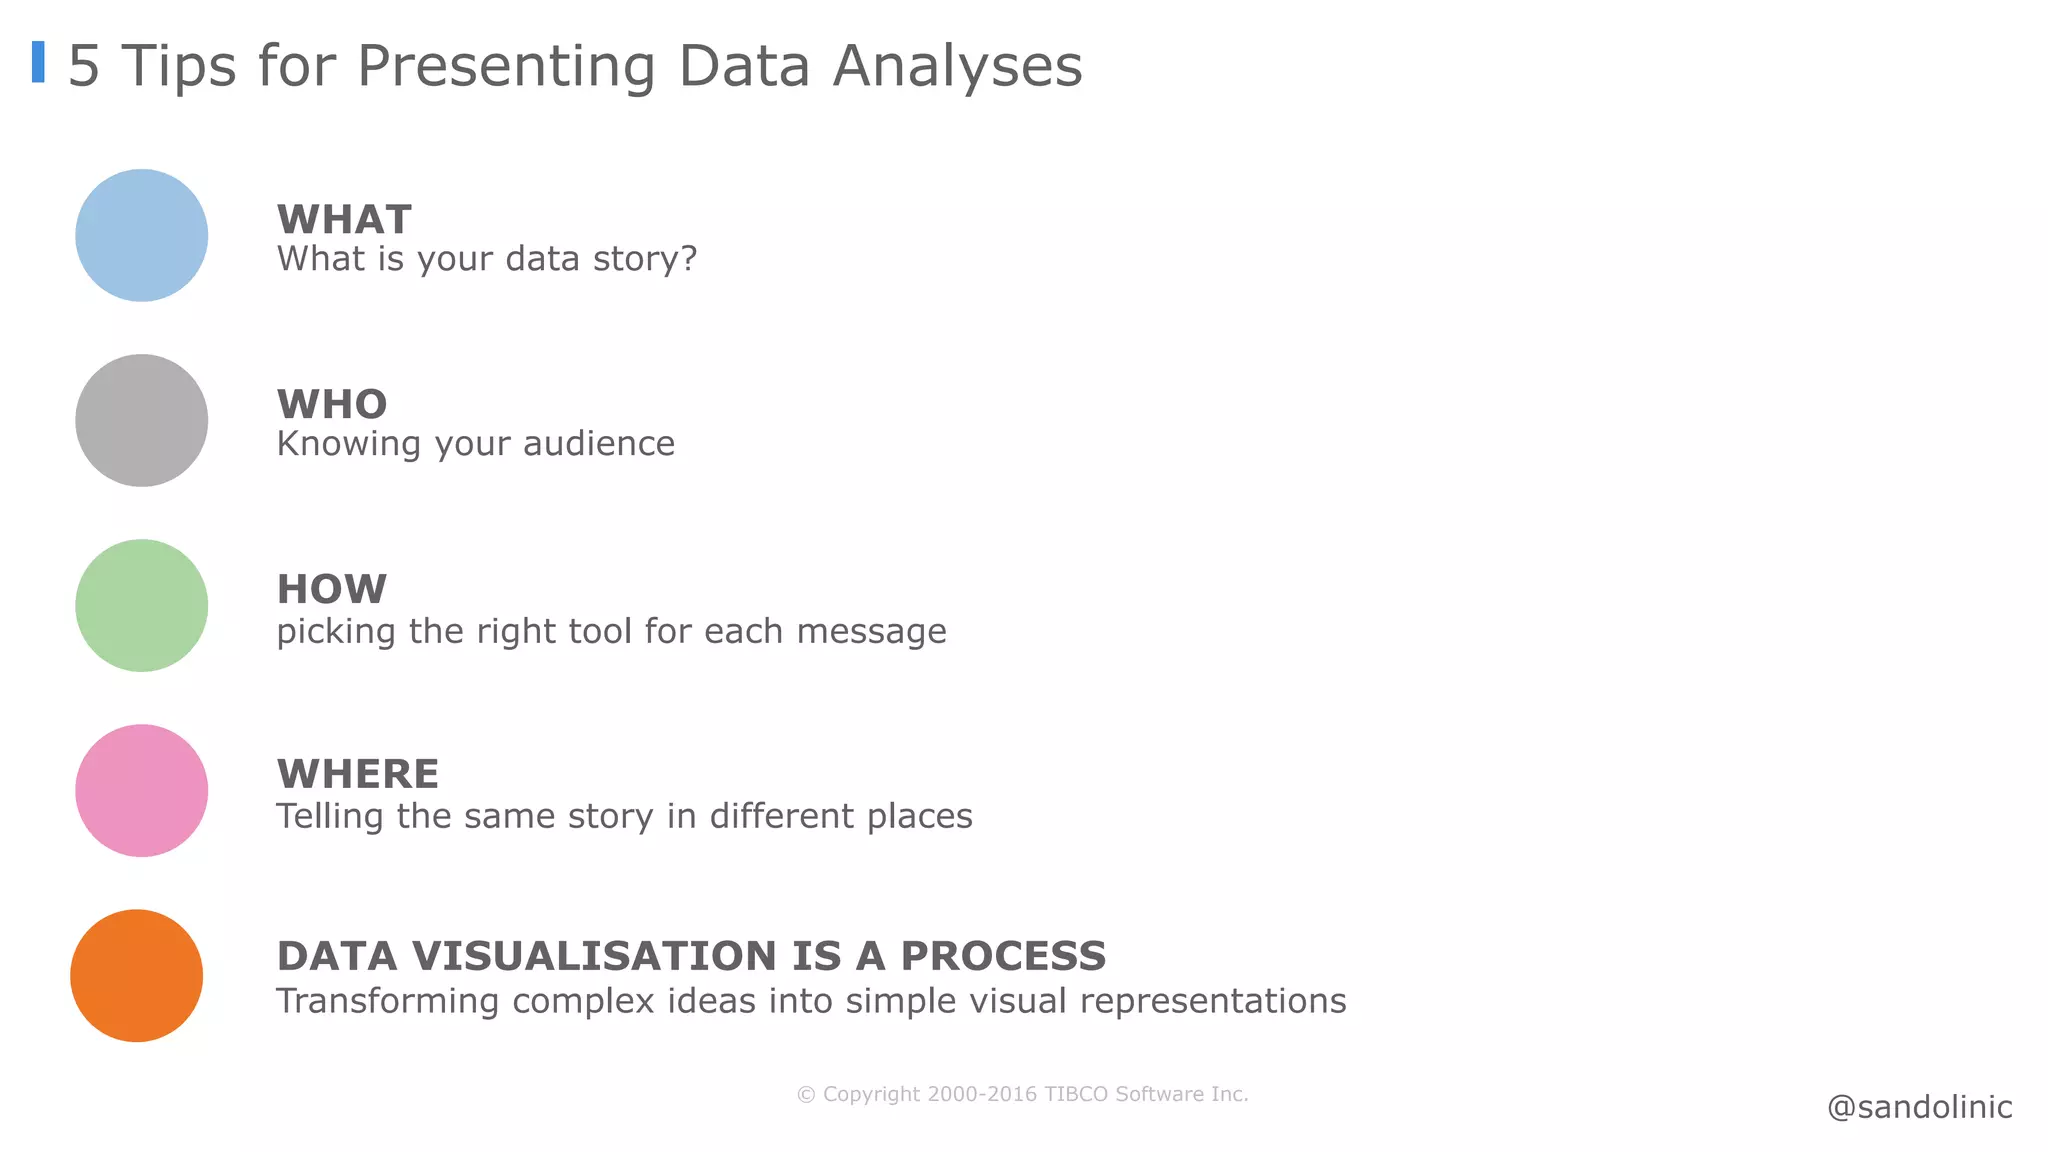
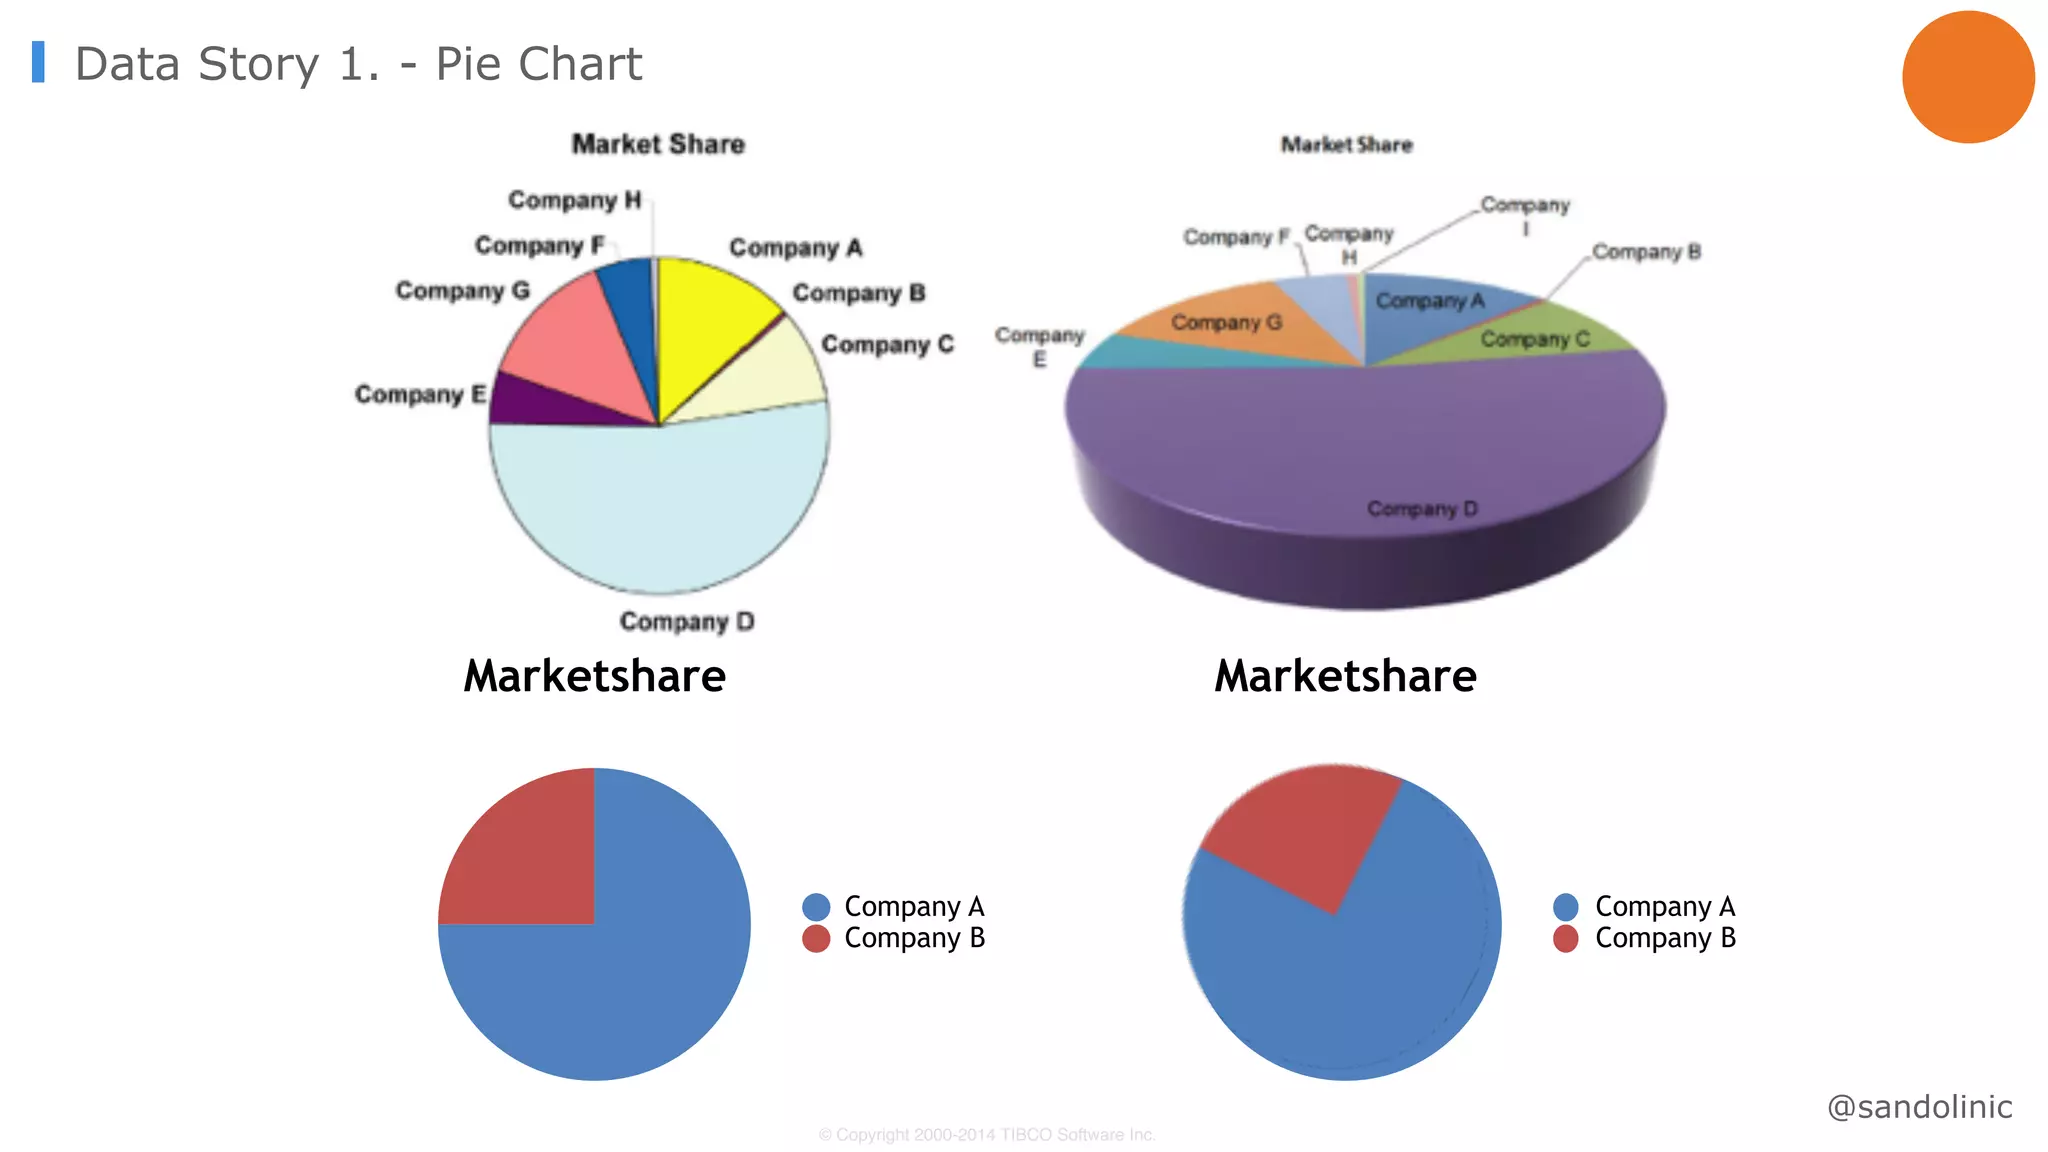
SlideShare a Scribd company logo
NICOLA SANDOLI
TIBCO ANALYTICS SALES
@sandolinic
Five Tips for Presenting Data Analyses
© Copyright 2000-2014 TIBCO Software Inc.
Stories are everywhere: how do we tell them?
@sandolinic
What is the right skill set for
building good data visualizations?
The ability to ask good
questions is really what we start
with.
Amanda Cox
The right skill set
Seems like the right person is a unicorn,
someone who knows some design, some
programming and some statistics?
© Copyright 2000-2016 TIBCO Software Inc.
5 Tips for Presenting Data Analyses
WHAT
What is your data story?
WHO
Knowing your audience
HOW
picking the right tool for each message
Transforming complex ideas into simple visual representations
DATA VISUALISATION IS A PROCESS
WHERE
Telling the same story in different places
@sandolinic
«Data Visualization is a language.
It’s meant to convey an opinion, an
argument.»
Kim Rees – Founding Partner, Periscope
#DataViz Resources
Alberto Cairo
David McCanless
Stephen Few
Edward Tufte
Juacques Bertin
William Cleveland
@sandolinic
Data visualization is the graphical display
of abstract information for two purposes:
sense-making and communication
Few, Stephen (2014)
Data vitzualsaiion is the grihapcal dilpsay
of abratsct infriotmaon for two pusopres:
sense-maikng and cotunmicmaion
Typoglycemia
© Copyright 2000-2016 TIBCO Software Inc.
5 Tips for Presenting Data Analyses
WHAT
What is your data story?
WHO
Knowing your audience
HOW
picking the right tool for each message
Transforming complex ideas into simple visual representations
DATA VISUALISATION IS A PROCESS
WHERE
Telling the same story in different places
@sandolinic
Knowing your audience
How to communicate
using
Graphs and Tables?
200 Countries, 200 Years, 4
Minutes
Hans Rosling
New insights on poverty
@sandolinic
Inside P&G’s Digital Revolution – Real-Time Review
@sandolinic
Why Data Visualization
© Copyright 2000-2016 TIBCO Software Inc.
5 Tips for Presenting Data Analyses
WHAT
What is your data story?
WHO
Knowing your audience
HOW
picking the right tool for each message
Transforming complex ideas into simple visual representations
DATA VISUALISATION IS A PROCESS
WHERE
Telling the same story in different places
@sandolinic
Should Data Visualizations Be Beautiful?
© Copyright 2000-2014 TIBCO Software Inc.
Telling stories with data
France
Germany
China
@sandolinic
Pre-attentive attributes
@sandolinic
@sandolinic
Telling complex stories with data
@sandolinic
Data-Ink Ratio
© Copyright 2000-2016 TIBCO Software Inc.
5 Tips for Presenting Data Analyses
WHAT
What is your data story?
WHO
Knowing your audience
HOW
picking the right tool for each message
Transforming complex ideas into simple visual representations
DATA VISUALISATION IS A PROCESS
WHERE
Telling the same story in different places
@sandolinic
Telling the same story in different places
@sandolinic
Color should be used meaningfully
• Use natural colours
• Use intense colours only when
you wish to draw attention to
specific data.
• Use the same colour, except
when colour differences are
needed to indicate differences
in the data or encode a
dimension
• Use a single, neutral
background colour (if needed
at all)
• KEEP IT SIMPLE AND
CONSISTENT
Not only for deco ☺
@sandolinic
@sandolinic
© Copyright 2000-2016 TIBCO Software Inc.
5 Tips for Presenting Data Analyses
WHAT
What is your data story?
WHO
Knowing your audience
HOW
picking the right tool for each message
Transforming complex ideas into simple visual representations
DATA VISUALISATION IS A PROCESS
WHERE
Telling the same story in different places
@sandolinic
© Copyright 2000-2014 TIBCO Software Inc.
Marketshare
Company A
Company B
Marketshare
Company A
Company B
Data Story 1. - Pie Chart
@sandolinic
© Copyright 2000-2014 TIBCO Software Inc.
Answer in 3 seconds:
Which city has more «scuole comunali»?Why pie chart series doesn’t work
+ information - space
• Link color - number - legend
• Look for the highest number among
the darker slices
… what if I would like to know the
which is the second one?
Data Story 1. - Pie Chart
@sandolinic
http://spotfire.tibco.com/demos
DEMO GALLERY
NICOLA SANDOLI
TIBCO ANALYTICS SALES
@sandolinic
Five Tips for Presenting Data Analyses

More Related Content

Viewers also liked

Storyboarding for Data Visualization
Storyboarding for Data VisualizationStoryboarding for Data Visualization
Storyboarding for Data Visualization
Amanda Makulec
 
A data visualisation story - top tips from the Guardian Masterclass. Creative...
A data visualisation story - top tips from the Guardian Masterclass. Creative...A data visualisation story - top tips from the Guardian Masterclass. Creative...
A data visualisation story - top tips from the Guardian Masterclass. Creative...
CharityComms
 
The Economics of Regulation
The Economics of RegulationThe Economics of Regulation
The Economics of Regulation
Luke Wainscoat
 
Making Data Meaningful
Making Data MeaningfulMaking Data Meaningful
Making Data Meaningful
Amanda Makulec
 
Data Viz - telling stories with data
Data Viz - telling stories with dataData Viz - telling stories with data
Data Viz - telling stories with data
OCSI
 
Anti trust powerpoint
Anti trust powerpointAnti trust powerpoint
Anti trust powerpoint
chris5390
 
Po b lecture 3 macro economics and regulation students
Po b lecture 3   macro economics and regulation studentsPo b lecture 3   macro economics and regulation students
Po b lecture 3 macro economics and regulation students
Diana Shore
 
Andy Kirk's Facebook Talk
Andy Kirk's Facebook TalkAndy Kirk's Facebook Talk
Andy Kirk's Facebook Talk
Andy Kirk
 
Hfm intro
Hfm introHfm intro
Hfm intro
Amit Sharma
 
NCompass Live: Presenting Data in Meaningful and Interesting Ways
NCompass Live: Presenting Data in Meaningful and Interesting WaysNCompass Live: Presenting Data in Meaningful and Interesting Ways
NCompass Live: Presenting Data in Meaningful and Interesting Ways
Nebraska Library Commission
 
6 Strategies for Presenting Data & Charts
6 Strategies for Presenting Data & Charts6 Strategies for Presenting Data & Charts
6 Strategies for Presenting Data & Charts
MGT OPEN
 
A Pixar Twist on Presenting Data
A Pixar Twist on Presenting DataA Pixar Twist on Presenting Data
A Pixar Twist on Presenting Data
Amanda Makulec
 
Link Building Through Data Driven Storytelling by @staceycav #fos16
Link Building Through Data Driven Storytelling by @staceycav #fos16Link Building Through Data Driven Storytelling by @staceycav #fos16
Link Building Through Data Driven Storytelling by @staceycav #fos16
Stacey MacNaught
 
How to Tell a Story With Your Google Analytics Data
How to Tell a Story With Your Google Analytics DataHow to Tell a Story With Your Google Analytics Data
How to Tell a Story With Your Google Analytics Data
Jeff Sauer
 

Viewers also liked (14)

Storyboarding for Data Visualization
Storyboarding for Data VisualizationStoryboarding for Data Visualization
Storyboarding for Data Visualization
 
A data visualisation story - top tips from the Guardian Masterclass. Creative...
A data visualisation story - top tips from the Guardian Masterclass. Creative...A data visualisation story - top tips from the Guardian Masterclass. Creative...
A data visualisation story - top tips from the Guardian Masterclass. Creative...
 
The Economics of Regulation
The Economics of RegulationThe Economics of Regulation
The Economics of Regulation
 
Making Data Meaningful
Making Data MeaningfulMaking Data Meaningful
Making Data Meaningful
 
Data Viz - telling stories with data
Data Viz - telling stories with dataData Viz - telling stories with data
Data Viz - telling stories with data
 
Anti trust powerpoint
Anti trust powerpointAnti trust powerpoint
Anti trust powerpoint
 
Po b lecture 3 macro economics and regulation students
Po b lecture 3   macro economics and regulation studentsPo b lecture 3   macro economics and regulation students
Po b lecture 3 macro economics and regulation students
 
Andy Kirk's Facebook Talk
Andy Kirk's Facebook TalkAndy Kirk's Facebook Talk
Andy Kirk's Facebook Talk
 
Hfm intro
Hfm introHfm intro
Hfm intro
 
NCompass Live: Presenting Data in Meaningful and Interesting Ways
NCompass Live: Presenting Data in Meaningful and Interesting WaysNCompass Live: Presenting Data in Meaningful and Interesting Ways
NCompass Live: Presenting Data in Meaningful and Interesting Ways
 
6 Strategies for Presenting Data & Charts
6 Strategies for Presenting Data & Charts6 Strategies for Presenting Data & Charts
6 Strategies for Presenting Data & Charts
 
A Pixar Twist on Presenting Data
A Pixar Twist on Presenting DataA Pixar Twist on Presenting Data
A Pixar Twist on Presenting Data
 
Link Building Through Data Driven Storytelling by @staceycav #fos16
Link Building Through Data Driven Storytelling by @staceycav #fos16Link Building Through Data Driven Storytelling by @staceycav #fos16
Link Building Through Data Driven Storytelling by @staceycav #fos16
 
How to Tell a Story With Your Google Analytics Data
How to Tell a Story With Your Google Analytics DataHow to Tell a Story With Your Google Analytics Data
How to Tell a Story With Your Google Analytics Data
 

Similar to Data Visualization - 5 tips for presenting data analyses

Teejit - Portfolio 2023
Teejit - Portfolio 2023Teejit - Portfolio 2023
Teejit - Portfolio 2023
Teejit
 
Designing infographics
Designing infographicsDesigning infographics
Designing infographics
Vosnier Cambeses
 
Industry Preview 2015 - "The Future of Buying TV Everywhere" from AdExchanger...
Industry Preview 2015 - "The Future of Buying TV Everywhere" from AdExchanger...Industry Preview 2015 - "The Future of Buying TV Everywhere" from AdExchanger...
Industry Preview 2015 - "The Future of Buying TV Everywhere" from AdExchanger...
Ad Exchanger
 
Teradata Connect 2014 Unofficial Summary
Teradata Connect 2014 Unofficial SummaryTeradata Connect 2014 Unofficial Summary
Teradata Connect 2014 Unofficial Summary
Localz
 
Digital women 2017
Digital women 2017Digital women 2017
Digital women 2017
Fabiana Lanotte
 
A picture is worth a thousand words_Mathilda Eloff
A picture is worth a thousand words_Mathilda EloffA picture is worth a thousand words_Mathilda Eloff
A picture is worth a thousand words_Mathilda Eloff
Mathilda Eloff
 
Design Method for Visualizing Complex Data for Users
Design Method for Visualizing Complex Data for Users Design Method for Visualizing Complex Data for Users
Design Method for Visualizing Complex Data for Users
UXPA International
 
Caldwell_Reimagine the Way work Gets Done-DWX17.pptx
Caldwell_Reimagine the Way work Gets Done-DWX17.pptxCaldwell_Reimagine the Way work Gets Done-DWX17.pptx
Caldwell_Reimagine the Way work Gets Done-DWX17.pptx
Michelle Caldwell, PSM, SSGB
 
Communifix Case Study - Events, Pavillion & Activations - Aug 2018
Communifix Case Study - Events, Pavillion & Activations - Aug 2018Communifix Case Study - Events, Pavillion & Activations - Aug 2018
Communifix Case Study - Events, Pavillion & Activations - Aug 2018
Communifix Communication Pvt. Ltd.
 
Making a Dino Dance: integrating a user-centered design process into a natura...
Making a Dino Dance: integrating a user-centered design process into a natura...Making a Dino Dance: integrating a user-centered design process into a natura...
Making a Dino Dance: integrating a user-centered design process into a natura...
Barry Joseph
 
6 Data-Driven Leadership Trends for 2016
6 Data-Driven Leadership Trends for 20166 Data-Driven Leadership Trends for 2016
6 Data-Driven Leadership Trends for 2016
IBM THINK Leaders
 
2016 Data-Driven Predictions
2016 Data-Driven Predictions2016 Data-Driven Predictions
2016 Data-Driven Predictions
Christine Astovasadourian
 
Using Data to Enable Human Conversations in Email
Using Data to Enable Human Conversations in EmailUsing Data to Enable Human Conversations in Email
Using Data to Enable Human Conversations in Email
MediaPost
 
TheTin x SXSW 2017
TheTin x SXSW 2017TheTin x SXSW 2017
TheTin x SXSW 2017
Tim Harper
 
Forrester - X Factor - Scott Rigby v2
Forrester - X Factor - Scott Rigby v2Forrester - X Factor - Scott Rigby v2
Forrester - X Factor - Scott Rigby v2
Scott Rigby
 
Grow your startup with on deman talent by hayley conick at guru program sprin...
Grow your startup with on deman talent by hayley conick at guru program sprin...Grow your startup with on deman talent by hayley conick at guru program sprin...
Grow your startup with on deman talent by hayley conick at guru program sprin...
TechMeetups
 
Search++: Cognitive transformation of human-system interaction: Presented by ...
Search++: Cognitive transformation of human-system interaction: Presented by ...Search++: Cognitive transformation of human-system interaction: Presented by ...
Search++: Cognitive transformation of human-system interaction: Presented by ...
Lucidworks
 
How to Entertain audiences using data led content - Trend Report Spring 2015
How to Entertain audiences using data led content - Trend Report Spring 2015How to Entertain audiences using data led content - Trend Report Spring 2015
How to Entertain audiences using data led content - Trend Report Spring 2015
infogr8
 
Digital Workplace Experience Conference - Reimagine the way work gets done
Digital Workplace Experience Conference - Reimagine the way work gets done Digital Workplace Experience Conference - Reimagine the way work gets done
Digital Workplace Experience Conference - Reimagine the way work gets done
Michelle Caldwell, PSM, SSGB
 
Proctors Digital Futures Nov 2013 pdf
 Proctors Digital Futures Nov 2013 pdf Proctors Digital Futures Nov 2013 pdf
Proctors Digital Futures Nov 2013 pdf
Kevin Mason
 

Similar to Data Visualization - 5 tips for presenting data analyses (20)

Teejit - Portfolio 2023
Teejit - Portfolio 2023Teejit - Portfolio 2023
Teejit - Portfolio 2023
 
Designing infographics
Designing infographicsDesigning infographics
Designing infographics
 
Industry Preview 2015 - "The Future of Buying TV Everywhere" from AdExchanger...
Industry Preview 2015 - "The Future of Buying TV Everywhere" from AdExchanger...Industry Preview 2015 - "The Future of Buying TV Everywhere" from AdExchanger...
Industry Preview 2015 - "The Future of Buying TV Everywhere" from AdExchanger...
 
Teradata Connect 2014 Unofficial Summary
Teradata Connect 2014 Unofficial SummaryTeradata Connect 2014 Unofficial Summary
Teradata Connect 2014 Unofficial Summary
 
Digital women 2017
Digital women 2017Digital women 2017
Digital women 2017
 
A picture is worth a thousand words_Mathilda Eloff
A picture is worth a thousand words_Mathilda EloffA picture is worth a thousand words_Mathilda Eloff
A picture is worth a thousand words_Mathilda Eloff
 
Design Method for Visualizing Complex Data for Users
Design Method for Visualizing Complex Data for Users Design Method for Visualizing Complex Data for Users
Design Method for Visualizing Complex Data for Users
 
Caldwell_Reimagine the Way work Gets Done-DWX17.pptx
Caldwell_Reimagine the Way work Gets Done-DWX17.pptxCaldwell_Reimagine the Way work Gets Done-DWX17.pptx
Caldwell_Reimagine the Way work Gets Done-DWX17.pptx
 
Communifix Case Study - Events, Pavillion & Activations - Aug 2018
Communifix Case Study - Events, Pavillion & Activations - Aug 2018Communifix Case Study - Events, Pavillion & Activations - Aug 2018
Communifix Case Study - Events, Pavillion & Activations - Aug 2018
 
Making a Dino Dance: integrating a user-centered design process into a natura...
Making a Dino Dance: integrating a user-centered design process into a natura...Making a Dino Dance: integrating a user-centered design process into a natura...
Making a Dino Dance: integrating a user-centered design process into a natura...
 
6 Data-Driven Leadership Trends for 2016
6 Data-Driven Leadership Trends for 20166 Data-Driven Leadership Trends for 2016
6 Data-Driven Leadership Trends for 2016
 
2016 Data-Driven Predictions
2016 Data-Driven Predictions2016 Data-Driven Predictions
2016 Data-Driven Predictions
 
Using Data to Enable Human Conversations in Email
Using Data to Enable Human Conversations in EmailUsing Data to Enable Human Conversations in Email
Using Data to Enable Human Conversations in Email
 
TheTin x SXSW 2017
TheTin x SXSW 2017TheTin x SXSW 2017
TheTin x SXSW 2017
 
Forrester - X Factor - Scott Rigby v2
Forrester - X Factor - Scott Rigby v2Forrester - X Factor - Scott Rigby v2
Forrester - X Factor - Scott Rigby v2
 
Grow your startup with on deman talent by hayley conick at guru program sprin...
Grow your startup with on deman talent by hayley conick at guru program sprin...Grow your startup with on deman talent by hayley conick at guru program sprin...
Grow your startup with on deman talent by hayley conick at guru program sprin...
 
Search++: Cognitive transformation of human-system interaction: Presented by ...
Search++: Cognitive transformation of human-system interaction: Presented by ...Search++: Cognitive transformation of human-system interaction: Presented by ...
Search++: Cognitive transformation of human-system interaction: Presented by ...
 
How to Entertain audiences using data led content - Trend Report Spring 2015
How to Entertain audiences using data led content - Trend Report Spring 2015How to Entertain audiences using data led content - Trend Report Spring 2015
How to Entertain audiences using data led content - Trend Report Spring 2015
 
Digital Workplace Experience Conference - Reimagine the way work gets done
Digital Workplace Experience Conference - Reimagine the way work gets done Digital Workplace Experience Conference - Reimagine the way work gets done
Digital Workplace Experience Conference - Reimagine the way work gets done
 
Proctors Digital Futures Nov 2013 pdf
 Proctors Digital Futures Nov 2013 pdf Proctors Digital Futures Nov 2013 pdf
Proctors Digital Futures Nov 2013 pdf
 

More from Nicola Sandoli

Tibco Augmented Intelligence - Analytics, IoT, Big Data, Streaming 20161025
Tibco Augmented Intelligence - Analytics, IoT, Big Data, Streaming 20161025Tibco Augmented Intelligence - Analytics, IoT, Big Data, Streaming 20161025
Tibco Augmented Intelligence - Analytics, IoT, Big Data, Streaming 20161025
Nicola Sandoli
 
GeoAnalytics: Maximize the Value of Location Based Data
GeoAnalytics: Maximize the Value of Location Based DataGeoAnalytics: Maximize the Value of Location Based Data
GeoAnalytics: Maximize the Value of Location Based Data
Nicola Sandoli
 
Smart Manufacturing and Industry 4.0 - Tibco PoV
Smart Manufacturing and Industry 4.0 - Tibco PoVSmart Manufacturing and Industry 4.0 - Tibco PoV
Smart Manufacturing and Industry 4.0 - Tibco PoV
Nicola Sandoli
 
Data Visualization Challenge - Product Performance analysis
Data Visualization Challenge - Product Performance analysisData Visualization Challenge - Product Performance analysis
Data Visualization Challenge - Product Performance analysis
Nicola Sandoli
 
Data Visualization
Data VisualizationData Visualization
Data Visualization
Nicola Sandoli
 
Corso Partecipazione e Web
Corso Partecipazione e WebCorso Partecipazione e Web
Corso Partecipazione e Web
Nicola Sandoli
 
Six sigma green belt - catapult project
Six sigma green belt - catapult projectSix sigma green belt - catapult project
Six sigma green belt - catapult project
Nicola Sandoli
 
Graphs And Tables Design
Graphs And Tables DesignGraphs And Tables Design
Graphs And Tables Design
Nicola Sandoli
 

More from Nicola Sandoli (8)

Tibco Augmented Intelligence - Analytics, IoT, Big Data, Streaming 20161025
Tibco Augmented Intelligence - Analytics, IoT, Big Data, Streaming 20161025Tibco Augmented Intelligence - Analytics, IoT, Big Data, Streaming 20161025
Tibco Augmented Intelligence - Analytics, IoT, Big Data, Streaming 20161025
 
GeoAnalytics: Maximize the Value of Location Based Data
GeoAnalytics: Maximize the Value of Location Based DataGeoAnalytics: Maximize the Value of Location Based Data
GeoAnalytics: Maximize the Value of Location Based Data
 
Smart Manufacturing and Industry 4.0 - Tibco PoV
Smart Manufacturing and Industry 4.0 - Tibco PoVSmart Manufacturing and Industry 4.0 - Tibco PoV
Smart Manufacturing and Industry 4.0 - Tibco PoV
 
Data Visualization Challenge - Product Performance analysis
Data Visualization Challenge - Product Performance analysisData Visualization Challenge - Product Performance analysis
Data Visualization Challenge - Product Performance analysis
 
Data Visualization
Data VisualizationData Visualization
Data Visualization
 
Corso Partecipazione e Web
Corso Partecipazione e WebCorso Partecipazione e Web
Corso Partecipazione e Web
 
Six sigma green belt - catapult project
Six sigma green belt - catapult projectSix sigma green belt - catapult project
Six sigma green belt - catapult project
 
Graphs And Tables Design
Graphs And Tables DesignGraphs And Tables Design
Graphs And Tables Design
 

Recently uploaded

writing report business partner b1+ .pdf
writing report business partner b1+ .pdfwriting report business partner b1+ .pdf
writing report business partner b1+ .pdf
VyNguyen709676
 
一比一原版(曼大毕业证书)曼尼托巴大学毕业证如何办理
一比一原版(曼大毕业证书)曼尼托巴大学毕业证如何办理一比一原版(曼大毕业证书)曼尼托巴大学毕业证如何办理
一比一原版(曼大毕业证书)曼尼托巴大学毕业证如何办理
ytypuem
 
一比一原版(GWU,GW文凭证书)乔治·华盛顿大学毕业证如何办理
一比一原版(GWU,GW文凭证书)乔治·华盛顿大学毕业证如何办理一比一原版(GWU,GW文凭证书)乔治·华盛顿大学毕业证如何办理
一比一原版(GWU,GW文凭证书)乔治·华盛顿大学毕业证如何办理
bopyb
 
How To Control IO Usage using Resource Manager
How To Control IO Usage using Resource ManagerHow To Control IO Usage using Resource Manager
How To Control IO Usage using Resource Manager
Alireza Kamrani
 
A presentation that explain the Power BI Licensing
A presentation that explain the Power BI LicensingA presentation that explain the Power BI Licensing
A presentation that explain the Power BI Licensing
AlessioFois2
 
06-12-2024-BudapestDataForum-BuildingReal-timePipelineswithFLaNK AIM
06-12-2024-BudapestDataForum-BuildingReal-timePipelineswithFLaNK AIM06-12-2024-BudapestDataForum-BuildingReal-timePipelineswithFLaNK AIM
06-12-2024-BudapestDataForum-BuildingReal-timePipelineswithFLaNK AIM
Timothy Spann
 
一比一原版卡尔加里大学毕业证(uc毕业证)如何办理
一比一原版卡尔加里大学毕业证(uc毕业证)如何办理一比一原版卡尔加里大学毕业证(uc毕业证)如何办理
一比一原版卡尔加里大学毕业证(uc毕业证)如何办理
oaxefes
 
Palo Alto Cortex XDR presentation .......
Palo Alto Cortex XDR presentation .......Palo Alto Cortex XDR presentation .......
Palo Alto Cortex XDR presentation .......
Sachin Paul
 
4th Modern Marketing Reckoner by MMA Global India & Group M: 60+ experts on W...
4th Modern Marketing Reckoner by MMA Global India & Group M: 60+ experts on W...4th Modern Marketing Reckoner by MMA Global India & Group M: 60+ experts on W...
4th Modern Marketing Reckoner by MMA Global India & Group M: 60+ experts on W...
Social Samosa
 
一比一原版多伦多大学毕业证(UofT毕业证书)学历如何办理
一比一原版多伦多大学毕业证(UofT毕业证书)学历如何办理一比一原版多伦多大学毕业证(UofT毕业证书)学历如何办理
一比一原版多伦多大学毕业证(UofT毕业证书)学历如何办理
eoxhsaa
 
Experts live - Improving user adoption with AI
Experts live - Improving user adoption with AIExperts live - Improving user adoption with AI
Experts live - Improving user adoption with AI
jitskeb
 
Jio cinema Retention & Engagement Strategy.pdf
Jio cinema Retention & Engagement Strategy.pdfJio cinema Retention & Engagement Strategy.pdf
Jio cinema Retention & Engagement Strategy.pdf
inaya7568
 
End-to-end pipeline agility - Berlin Buzzwords 2024
End-to-end pipeline agility - Berlin Buzzwords 2024End-to-end pipeline agility - Berlin Buzzwords 2024
End-to-end pipeline agility - Berlin Buzzwords 2024
Lars Albertsson
 
一比一原版英国赫特福德大学毕业证(hertfordshire毕业证书)如何办理
一比一原版英国赫特福德大学毕业证(hertfordshire毕业证书)如何办理一比一原版英国赫特福德大学毕业证(hertfordshire毕业证书)如何办理
一比一原版英国赫特福德大学毕业证(hertfordshire毕业证书)如何办理
nyvan3
 
DSSML24_tspann_CodelessGenerativeAIPipelines
DSSML24_tspann_CodelessGenerativeAIPipelinesDSSML24_tspann_CodelessGenerativeAIPipelines
DSSML24_tspann_CodelessGenerativeAIPipelines
Timothy Spann
 
原版一比一爱尔兰都柏林大学毕业证(UCD毕业证书)如何办理
原版一比一爱尔兰都柏林大学毕业证(UCD毕业证书)如何办理 原版一比一爱尔兰都柏林大学毕业证(UCD毕业证书)如何办理
原版一比一爱尔兰都柏林大学毕业证(UCD毕业证书)如何办理
tzu5xla
 
The Ipsos - AI - Monitor 2024 Report.pdf
The  Ipsos - AI - Monitor 2024 Report.pdfThe  Ipsos - AI - Monitor 2024 Report.pdf
The Ipsos - AI - Monitor 2024 Report.pdf
Social Samosa
 
一比一原版格里菲斯大学毕业证(Griffith毕业证书)学历如何办理
一比一原版格里菲斯大学毕业证(Griffith毕业证书)学历如何办理一比一原版格里菲斯大学毕业证(Griffith毕业证书)学历如何办理
一比一原版格里菲斯大学毕业证(Griffith毕业证书)学历如何办理
lzdvtmy8
 
Build applications with generative AI on Google Cloud
Build applications with generative AI on Google CloudBuild applications with generative AI on Google Cloud
Build applications with generative AI on Google Cloud
Márton Kodok
 
在线办理(英国UCA毕业证书)创意艺术大学毕业证在读证明一模一样
在线办理(英国UCA毕业证书)创意艺术大学毕业证在读证明一模一样在线办理(英国UCA毕业证书)创意艺术大学毕业证在读证明一模一样
在线办理(英国UCA毕业证书)创意艺术大学毕业证在读证明一模一样
v7oacc3l
 

Recently uploaded (20)

writing report business partner b1+ .pdf
writing report business partner b1+ .pdfwriting report business partner b1+ .pdf
writing report business partner b1+ .pdf
 
一比一原版(曼大毕业证书)曼尼托巴大学毕业证如何办理
一比一原版(曼大毕业证书)曼尼托巴大学毕业证如何办理一比一原版(曼大毕业证书)曼尼托巴大学毕业证如何办理
一比一原版(曼大毕业证书)曼尼托巴大学毕业证如何办理
 
一比一原版(GWU,GW文凭证书)乔治·华盛顿大学毕业证如何办理
一比一原版(GWU,GW文凭证书)乔治·华盛顿大学毕业证如何办理一比一原版(GWU,GW文凭证书)乔治·华盛顿大学毕业证如何办理
一比一原版(GWU,GW文凭证书)乔治·华盛顿大学毕业证如何办理
 
How To Control IO Usage using Resource Manager
How To Control IO Usage using Resource ManagerHow To Control IO Usage using Resource Manager
How To Control IO Usage using Resource Manager
 
A presentation that explain the Power BI Licensing
A presentation that explain the Power BI LicensingA presentation that explain the Power BI Licensing
A presentation that explain the Power BI Licensing
 
06-12-2024-BudapestDataForum-BuildingReal-timePipelineswithFLaNK AIM
06-12-2024-BudapestDataForum-BuildingReal-timePipelineswithFLaNK AIM06-12-2024-BudapestDataForum-BuildingReal-timePipelineswithFLaNK AIM
06-12-2024-BudapestDataForum-BuildingReal-timePipelineswithFLaNK AIM
 
一比一原版卡尔加里大学毕业证(uc毕业证)如何办理
一比一原版卡尔加里大学毕业证(uc毕业证)如何办理一比一原版卡尔加里大学毕业证(uc毕业证)如何办理
一比一原版卡尔加里大学毕业证(uc毕业证)如何办理
 
Palo Alto Cortex XDR presentation .......
Palo Alto Cortex XDR presentation .......Palo Alto Cortex XDR presentation .......
Palo Alto Cortex XDR presentation .......
 
4th Modern Marketing Reckoner by MMA Global India & Group M: 60+ experts on W...
4th Modern Marketing Reckoner by MMA Global India & Group M: 60+ experts on W...4th Modern Marketing Reckoner by MMA Global India & Group M: 60+ experts on W...
4th Modern Marketing Reckoner by MMA Global India & Group M: 60+ experts on W...
 
一比一原版多伦多大学毕业证(UofT毕业证书)学历如何办理
一比一原版多伦多大学毕业证(UofT毕业证书)学历如何办理一比一原版多伦多大学毕业证(UofT毕业证书)学历如何办理
一比一原版多伦多大学毕业证(UofT毕业证书)学历如何办理
 
Experts live - Improving user adoption with AI
Experts live - Improving user adoption with AIExperts live - Improving user adoption with AI
Experts live - Improving user adoption with AI
 
Jio cinema Retention & Engagement Strategy.pdf
Jio cinema Retention & Engagement Strategy.pdfJio cinema Retention & Engagement Strategy.pdf
Jio cinema Retention & Engagement Strategy.pdf
 
End-to-end pipeline agility - Berlin Buzzwords 2024
End-to-end pipeline agility - Berlin Buzzwords 2024End-to-end pipeline agility - Berlin Buzzwords 2024
End-to-end pipeline agility - Berlin Buzzwords 2024
 
一比一原版英国赫特福德大学毕业证(hertfordshire毕业证书)如何办理
一比一原版英国赫特福德大学毕业证(hertfordshire毕业证书)如何办理一比一原版英国赫特福德大学毕业证(hertfordshire毕业证书)如何办理
一比一原版英国赫特福德大学毕业证(hertfordshire毕业证书)如何办理
 
DSSML24_tspann_CodelessGenerativeAIPipelines
DSSML24_tspann_CodelessGenerativeAIPipelinesDSSML24_tspann_CodelessGenerativeAIPipelines
DSSML24_tspann_CodelessGenerativeAIPipelines
 
原版一比一爱尔兰都柏林大学毕业证(UCD毕业证书)如何办理
原版一比一爱尔兰都柏林大学毕业证(UCD毕业证书)如何办理 原版一比一爱尔兰都柏林大学毕业证(UCD毕业证书)如何办理
原版一比一爱尔兰都柏林大学毕业证(UCD毕业证书)如何办理
 
The Ipsos - AI - Monitor 2024 Report.pdf
The  Ipsos - AI - Monitor 2024 Report.pdfThe  Ipsos - AI - Monitor 2024 Report.pdf
The Ipsos - AI - Monitor 2024 Report.pdf
 
一比一原版格里菲斯大学毕业证(Griffith毕业证书)学历如何办理
一比一原版格里菲斯大学毕业证(Griffith毕业证书)学历如何办理一比一原版格里菲斯大学毕业证(Griffith毕业证书)学历如何办理
一比一原版格里菲斯大学毕业证(Griffith毕业证书)学历如何办理
 
Build applications with generative AI on Google Cloud
Build applications with generative AI on Google CloudBuild applications with generative AI on Google Cloud
Build applications with generative AI on Google Cloud
 
在线办理(英国UCA毕业证书)创意艺术大学毕业证在读证明一模一样
在线办理(英国UCA毕业证书)创意艺术大学毕业证在读证明一模一样在线办理(英国UCA毕业证书)创意艺术大学毕业证在读证明一模一样
在线办理(英国UCA毕业证书)创意艺术大学毕业证在读证明一模一样
 

Data Visualization - 5 tips for presenting data analyses

  • 1. NICOLA SANDOLI TIBCO ANALYTICS SALES @sandolinic Five Tips for Presenting Data Analyses
  • 2. © Copyright 2000-2014 TIBCO Software Inc. Stories are everywhere: how do we tell them? @sandolinic
  • 3.
  • 4. What is the right skill set for building good data visualizations? The ability to ask good questions is really what we start with. Amanda Cox The right skill set Seems like the right person is a unicorn, someone who knows some design, some programming and some statistics?
  • 5. © Copyright 2000-2016 TIBCO Software Inc. 5 Tips for Presenting Data Analyses WHAT What is your data story? WHO Knowing your audience HOW picking the right tool for each message Transforming complex ideas into simple visual representations DATA VISUALISATION IS A PROCESS WHERE Telling the same story in different places @sandolinic
  • 6. © Copyright 2000-2016 TIBCO Software Inc. 5 Tips for Presenting Data Analyses WHAT What is your data story? WHO Knowing your audience HOW picking the right tool for each message Transforming complex ideas into simple visual representations DATA VISUALISATION IS A PROCESS WHERE Telling the same story in different places @sandolinic
  • 7. «Data Visualization is a language. It’s meant to convey an opinion, an argument.» Kim Rees – Founding Partner, Periscope
  • 8. #DataViz Resources Alberto Cairo David McCanless Stephen Few Edward Tufte Juacques Bertin William Cleveland @sandolinic
  • 9. Data visualization is the graphical display of abstract information for two purposes: sense-making and communication Few, Stephen (2014) Data vitzualsaiion is the grihapcal dilpsay of abratsct infriotmaon for two pusopres: sense-maikng and cotunmicmaion Typoglycemia
  • 10. © Copyright 2000-2016 TIBCO Software Inc. 5 Tips for Presenting Data Analyses WHAT What is your data story? WHO Knowing your audience HOW picking the right tool for each message Transforming complex ideas into simple visual representations DATA VISUALISATION IS A PROCESS WHERE Telling the same story in different places @sandolinic
  • 11. Knowing your audience How to communicate using Graphs and Tables? 200 Countries, 200 Years, 4 Minutes Hans Rosling New insights on poverty @sandolinic
  • 12. Inside P&G’s Digital Revolution – Real-Time Review @sandolinic
  • 14. © Copyright 2000-2016 TIBCO Software Inc. 5 Tips for Presenting Data Analyses WHAT What is your data story? WHO Knowing your audience HOW picking the right tool for each message Transforming complex ideas into simple visual representations DATA VISUALISATION IS A PROCESS WHERE Telling the same story in different places @sandolinic
  • 15. Should Data Visualizations Be Beautiful?
  • 16. © Copyright 2000-2014 TIBCO Software Inc. Telling stories with data France Germany China @sandolinic
  • 19. Telling complex stories with data @sandolinic
  • 21. © Copyright 2000-2016 TIBCO Software Inc. 5 Tips for Presenting Data Analyses WHAT What is your data story? WHO Knowing your audience HOW picking the right tool for each message Transforming complex ideas into simple visual representations DATA VISUALISATION IS A PROCESS WHERE Telling the same story in different places @sandolinic
  • 22. Telling the same story in different places @sandolinic
  • 23. Color should be used meaningfully • Use natural colours • Use intense colours only when you wish to draw attention to specific data. • Use the same colour, except when colour differences are needed to indicate differences in the data or encode a dimension • Use a single, neutral background colour (if needed at all) • KEEP IT SIMPLE AND CONSISTENT Not only for deco ☺ @sandolinic
  • 25. © Copyright 2000-2016 TIBCO Software Inc. 5 Tips for Presenting Data Analyses WHAT What is your data story? WHO Knowing your audience HOW picking the right tool for each message Transforming complex ideas into simple visual representations DATA VISUALISATION IS A PROCESS WHERE Telling the same story in different places @sandolinic
  • 26. © Copyright 2000-2014 TIBCO Software Inc. Marketshare Company A Company B Marketshare Company A Company B Data Story 1. - Pie Chart @sandolinic
  • 27. © Copyright 2000-2014 TIBCO Software Inc. Answer in 3 seconds: Which city has more «scuole comunali»?Why pie chart series doesn’t work + information - space • Link color - number - legend • Look for the highest number among the darker slices … what if I would like to know the which is the second one? Data Story 1. - Pie Chart @sandolinic
  • 29. NICOLA SANDOLI TIBCO ANALYTICS SALES @sandolinic Five Tips for Presenting Data Analyses