Downloaded 425 times

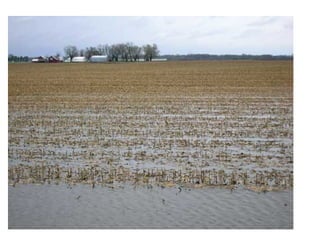
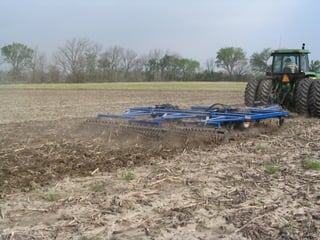
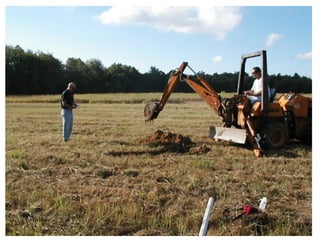
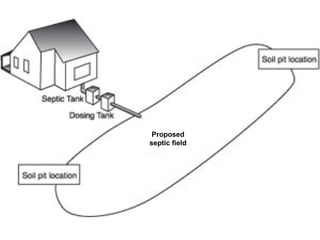
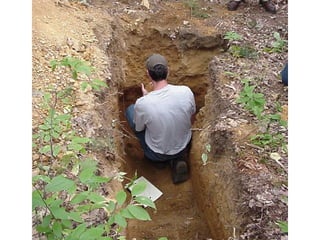
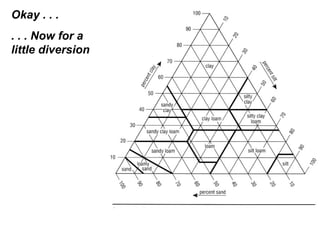
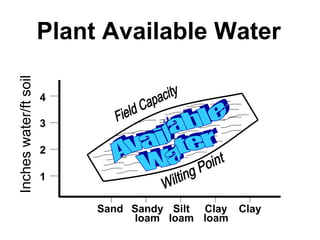
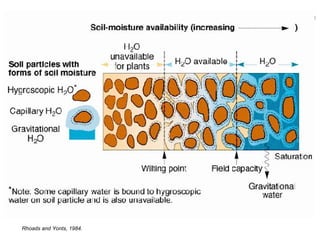
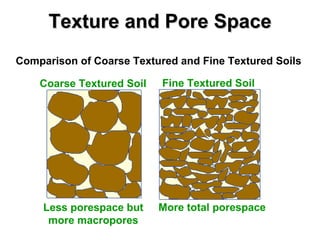
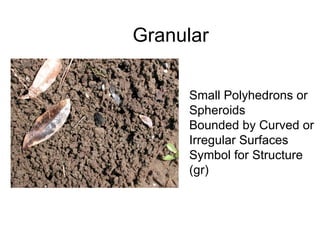
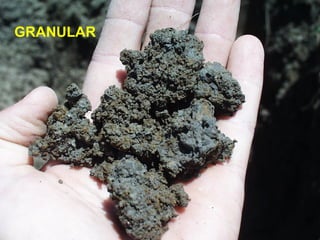
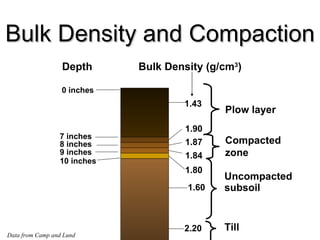

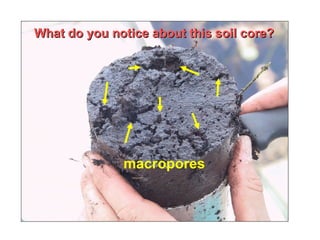
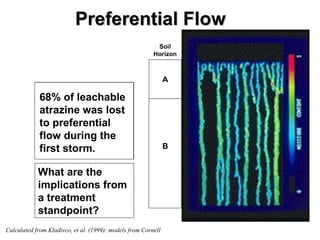

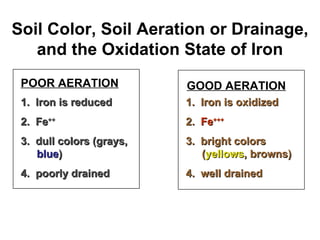
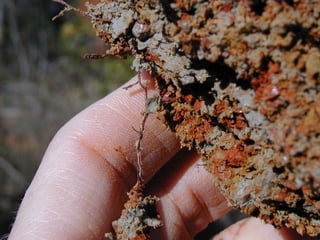
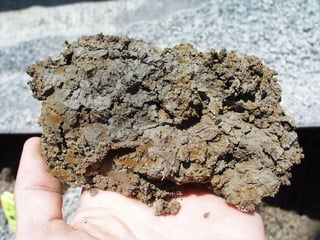
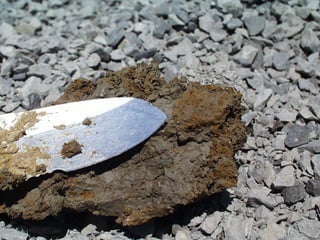

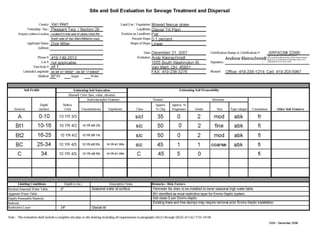
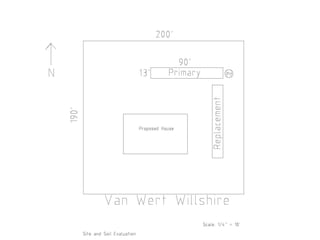
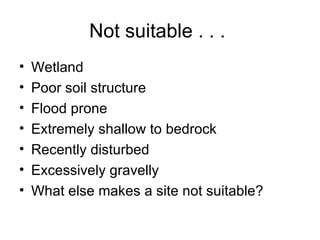
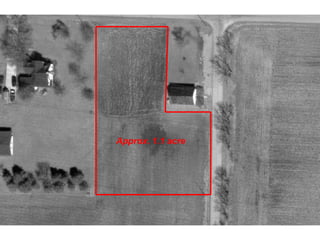
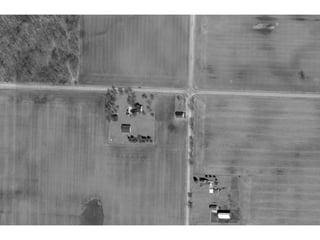
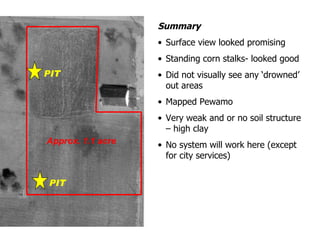
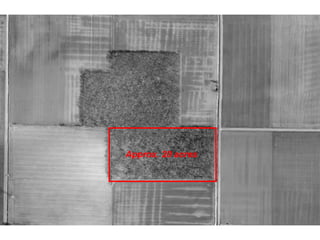
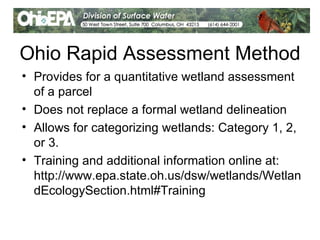
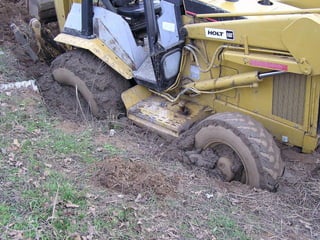
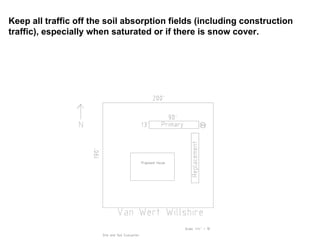
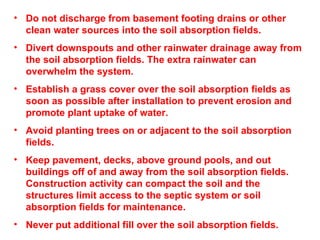

The document discusses site and soil evaluation for septic systems, highlighting factors like soil texture, bulk density, and pore space which affect soil quality and suitability for septic fields. It provides insights into the implications of soil structure on water drainage and aeration, as well as recommendations for soil absorption field maintenance to prevent compaction and drainage issues. Additionally, the Ohio Rapid Assessment Method is mentioned for evaluating wetlands, emphasizing that proper site assessment is crucial for effective septic system installation.


