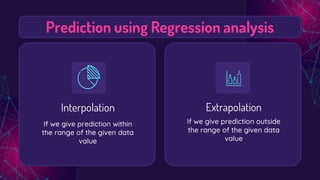
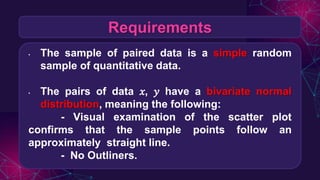
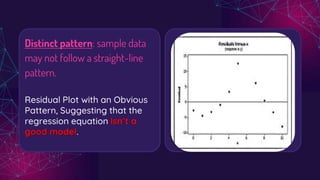
This document provides an overview of simple linear regression. It defines regression as measuring the average relationship between two variables. Simple linear regression finds the linear relationship between a dependent variable (y) and independent variable (x) using a regression equation of the form y = a + bx. It describes calculating the intercept (a) and slope (b) using the least squares method. An example demonstrates predicting y values from x using the regression equation. Residuals represent prediction errors and a residual plot can show if the regression model fits the data well with no obvious patterns.
Regression analysis is a powerful statistical method that allows you to examine the relationship between two or more variables of interest. Regression analysis is a reliable method of identifying which variables have impact on a topic of interest. The process of performing a regression allows you to confidently determine which factors matter most, which factors can be ignored, and how these factors influence each other.In this presentation a brief introduction about SLR and MLR and their codes in R are described
Data Science - Part XII - Ridge Regression, LASSO, and Elastic NetsDerek Kane
This lecture provides an overview of some modern regression techniques including a discussion of the bias variance tradeoff for regression errors and the topic of shrinkage estimators. This leads into an overview of ridge regression, LASSO, and elastic nets. These topics will be discussed in detail and we will go through the calibration/diagnostics and then conclude with a practical example highlighting the techniques.
This article provides a brief discussion on several statistical parameters that are most commonly used in any measurement and analysis process. There are a plethora of such parameters but the most important and widely used are briefed in here.
Regression Analysis -Meaning, Uses, Properties Difference between Regression and Correlation and Methods of Studying Regression are included in the ppt (only Theory part)
FSE 200AdkinsPage 1 of 10Simple Linear Regression Corr.docxbudbarber38650
FSE 200
Adkins Page 1 of 10
Simple Linear Regression
Correlation only measures the strength and direction of the linear relationship between two quantitative variables. If the relationship is linear, then we would like to try to model that relationship with the equation of a line. We will use a regression line to describe the relationship between an explanatory variable and a response variable.
A regression line is a straight line that describes how a response variable y changes as an explanatory variable x changes. We often use a regression line to predict the value of y for a given value of x.
Ex. It has been suggested that there is a relationship between sleep deprivation of employees and the ability to complete simple tasks. To evaluate this hypothesis, 12 people were asked to solve simple tasks after having been without sleep for 15, 18, 21, and 24 hours. The sample data are shown below.
Subject
Hours without sleep, x
Tasks completed, y
1
15
13
2
15
9
3
15
15
4
18
8
5
18
12
6
18
10
7
21
5
8
21
8
9
21
7
10
24
3
11
24
5
12
24
4
Draw a scatterplot and describe the relationship. Lay a straight-edge on top of the plot and move it around until you find what you think might be a “line of best fit.” Then try to predict the number of tasks completed for someone having been without sleep 16 hours.
Was your line the same as that of the classmate sitting next to you? Probably not. We need a method that we can use to find the “best” regression line to use for prediction. The method we will use is called least-squares. No line will pass exactly through all the points in the scatterplot. When we use the line to predict a y for a given x value, if there is a data point with that same x value, we can compute the error (residual):
Our goal is going to be to make the vertical distances from the line as small as possible. The most commonly used method for doing this is the least-squares method.
The least-squares regression line of y on x is the line that makes the sum of the squares of the vertical distances of the data points from the line as small as possible.
Equation of the Least-Squares Regression Line
· Least-Squares Regression Line:
· Slope of the Regression Line:
· Intercept of the Regression Line:
Generally, regression is performed using statistical software. Clearly, given the appropriate information, the above formulas are simple to use.
Once we have the regression line, how do we interpret it, and what can we do with it?
The slope of a regression line is the rate of change, that amount of change in when x increases by 1.
The intercept of the regression line is the value of when x = 0. It is statistically meaningful only when x can take on values that are close to zero.
To make a prediction, just substitute an x-value into the equation and find .
To plot the line on a scatterplot, just find a couple of points on the regression line, one near each end of the range of x in the data. Plot the points and connect them with a line. .
Lecture 4 - Linear Regression, a lecture in subject module Statistical & Mach...Maninda Edirisooriya
Simplest Machine Learning algorithm or one of the most fundamental Statistical Learning technique is Linear Regression. This was one of the lectures of a full course I taught in University of Moratuwa, Sri Lanka on 2023 second half of the year.
Hybrid optimization of pumped hydro system and solar- Engr. Abdul-Azeez.pdffxintegritypublishin
Advancements in technology unveil a myriad of electrical and electronic breakthroughs geared towards efficiently harnessing limited resources to meet human energy demands. The optimization of hybrid solar PV panels and pumped hydro energy supply systems plays a pivotal role in utilizing natural resources effectively. This initiative not only benefits humanity but also fosters environmental sustainability. The study investigated the design optimization of these hybrid systems, focusing on understanding solar radiation patterns, identifying geographical influences on solar radiation, formulating a mathematical model for system optimization, and determining the optimal configuration of PV panels and pumped hydro storage. Through a comparative analysis approach and eight weeks of data collection, the study addressed key research questions related to solar radiation patterns and optimal system design. The findings highlighted regions with heightened solar radiation levels, showcasing substantial potential for power generation and emphasizing the system's efficiency. Optimizing system design significantly boosted power generation, promoted renewable energy utilization, and enhanced energy storage capacity. The study underscored the benefits of optimizing hybrid solar PV panels and pumped hydro energy supply systems for sustainable energy usage. Optimizing the design of solar PV panels and pumped hydro energy supply systems as examined across diverse climatic conditions in a developing country, not only enhances power generation but also improves the integration of renewable energy sources and boosts energy storage capacities, particularly beneficial for less economically prosperous regions. Additionally, the study provides valuable insights for advancing energy research in economically viable areas. Recommendations included conducting site-specific assessments, utilizing advanced modeling tools, implementing regular maintenance protocols, and enhancing communication among system components.
Saudi Arabia stands as a titan in the global energy landscape, renowned for its abundant oil and gas resources. It's the largest exporter of petroleum and holds some of the world's most significant reserves. Let's delve into the top 10 oil and gas projects shaping Saudi Arabia's energy future in 2024.
About
Indigenized remote control interface card suitable for MAFI system CCR equipment. Compatible for IDM8000 CCR. Backplane mounted serial and TCP/Ethernet communication module for CCR remote access. IDM 8000 CCR remote control on serial and TCP protocol.
• Remote control: Parallel or serial interface.
• Compatible with MAFI CCR system.
• Compatible with IDM8000 CCR.
• Compatible with Backplane mount serial communication.
• Compatible with commercial and Defence aviation CCR system.
• Remote control system for accessing CCR and allied system over serial or TCP.
• Indigenized local Support/presence in India.
• Easy in configuration using DIP switches.
Technical Specifications
Indigenized remote control interface card suitable for MAFI system CCR equipment. Compatible for IDM8000 CCR. Backplane mounted serial and TCP/Ethernet communication module for CCR remote access. IDM 8000 CCR remote control on serial and TCP protocol.
Key Features
Indigenized remote control interface card suitable for MAFI system CCR equipment. Compatible for IDM8000 CCR. Backplane mounted serial and TCP/Ethernet communication module for CCR remote access. IDM 8000 CCR remote control on serial and TCP protocol.
• Remote control: Parallel or serial interface
• Compatible with MAFI CCR system
• Copatiable with IDM8000 CCR
• Compatible with Backplane mount serial communication.
• Compatible with commercial and Defence aviation CCR system.
• Remote control system for accessing CCR and allied system over serial or TCP.
• Indigenized local Support/presence in India.
Application
• Remote control: Parallel or serial interface.
• Compatible with MAFI CCR system.
• Compatible with IDM8000 CCR.
• Compatible with Backplane mount serial communication.
• Compatible with commercial and Defence aviation CCR system.
• Remote control system for accessing CCR and allied system over serial or TCP.
• Indigenized local Support/presence in India.
• Easy in configuration using DIP switches.
Sachpazis:Terzaghi Bearing Capacity Estimation in simple terms with Calculati...Dr.Costas Sachpazis
Terzaghi's soil bearing capacity theory, developed by Karl Terzaghi, is a fundamental principle in geotechnical engineering used to determine the bearing capacity of shallow foundations. This theory provides a method to calculate the ultimate bearing capacity of soil, which is the maximum load per unit area that the soil can support without undergoing shear failure. The Calculation HTML Code included.
Hierarchical Digital Twin of a Naval Power SystemKerry Sado
A hierarchical digital twin of a Naval DC power system has been developed and experimentally verified. Similar to other state-of-the-art digital twins, this technology creates a digital replica of the physical system executed in real-time or faster, which can modify hardware controls. However, its advantage stems from distributing computational efforts by utilizing a hierarchical structure composed of lower-level digital twin blocks and a higher-level system digital twin. Each digital twin block is associated with a physical subsystem of the hardware and communicates with a singular system digital twin, which creates a system-level response. By extracting information from each level of the hierarchy, power system controls of the hardware were reconfigured autonomously. This hierarchical digital twin development offers several advantages over other digital twins, particularly in the field of naval power systems. The hierarchical structure allows for greater computational efficiency and scalability while the ability to autonomously reconfigure hardware controls offers increased flexibility and responsiveness. The hierarchical decomposition and models utilized were well aligned with the physical twin, as indicated by the maximum deviations between the developed digital twin hierarchy and the hardware.
Explore the innovative world of trenchless pipe repair with our comprehensive guide, "The Benefits and Techniques of Trenchless Pipe Repair." This document delves into the modern methods of repairing underground pipes without the need for extensive excavation, highlighting the numerous advantages and the latest techniques used in the industry.
Learn about the cost savings, reduced environmental impact, and minimal disruption associated with trenchless technology. Discover detailed explanations of popular techniques such as pipe bursting, cured-in-place pipe (CIPP) lining, and directional drilling. Understand how these methods can be applied to various types of infrastructure, from residential plumbing to large-scale municipal systems.
Ideal for homeowners, contractors, engineers, and anyone interested in modern plumbing solutions, this guide provides valuable insights into why trenchless pipe repair is becoming the preferred choice for pipe rehabilitation. Stay informed about the latest advancements and best practices in the field.
4. Definition
Regression is the measure of the average
relationship between two or more variables in
terms of the original units of the data.
It is unquestionable the most widely used statistical
technique in social sciences. It is also widely used
in biological and physical science.
5. Prediction using Regression analysis
Interpolation
If we give prediction within
the range of the given data
value
If we give prediction outside
the range of the given data
value
Extrapolation
7. Relationship
Benefits of Regression analysis
Estimate
It provides estimate of
values of dependent
variables from values
of independent
variables
Extended
It can be extended
to 2 or more
variables, which is
known as multiple
regression
It shows the nature
of relationship
between two or
more variables
8. In the field of Business
The success of a
business depends on the
correctness of the
estimates in predicting
future production,
prices, profits, sales etc.
9. It’s an important tool for modelling and analysing data. It’s
used for many purposes like:
● Forecasting
● Predicting
● Finding the causal effect of one variable on another
For example, the effects of price increase on the customer’s
demand or an increase in salary causing a change in
spending etc…
Uses of Regression
11. Requirements
• The sample of paired data is a simple random
sample of quantitative data.
• The pairs of data 𝑥, 𝑦 have a bivariate normal
distribution, meaning the following:
- Visual examination of the scatter plot
confirms that the sample points follow an
approximately straight line.
- No Outliners.
12. Methods of regression study
Graphically
By using free
hand curve or
the least squares
method
Algebrically
By using the Least
Square Method or
the deviation
method from
arithmatic or
Assumed Mean
13. The Linear Equation
Y = a + bX
Where
Y = dependent variable
X = independent variable
a = constant (value of Y when X = 0)
b = the slope of the regression line
14. Least Square Method
∑𝒀 = 𝒏𝒂 + 𝒃∑𝑿
∑𝑿𝒀 = 𝒂∑𝑿 + 𝒃∑𝑿𝟐
The values of a and b are found with the
help of least of Squares-reference
method’s normal equations
Y=Dependent variable
X=Independent variable
Y = a + b X
01
02
03
15. Equation parameters
“a”
• a is the point at which the
slope line passes through the
Y axis.
• can be positive or negative
• may be referred to a as the
intercept.
“b”
• (the slope coefficient)
• can be positive or
negative.
• denotes a positive
or negative relationship.
21. To Use the Equation in Predictions
1. If the graph of the regression line on the scatter plot confirms
that the line fits the points reasonably well.
2. If the data used for prediction does not go much beyond the
scope of the available sample data.
3. If there is a significant linear correlation indicated between the
two variables, 𝑥 and 𝑦.
23. Residual - Error
Residual – for a pair of sample 𝑥 and 𝑦 values, the difference
between the observed sample value of 𝑦 (a true value observed)
and the y-value that is predicted by using the regression equation 𝑦
is the residual
• 𝑅𝑒𝑠𝑖𝑑𝑢𝑎𝑙 = 𝑂𝑏𝑠𝑒𝑟𝑣𝑒𝑑 - 𝑃𝑟𝑒𝑑𝑖𝑐𝑡𝑒𝑑
= 𝒀𝑶𝒃𝒔𝒆𝒓𝒗𝒆𝒅 - 𝒀𝑷𝒓𝒆𝒅𝒊𝒄𝒕𝒆𝒅
• A residual represents a type of inherent prediction error
• The regression equation does not, typically, pass through all the
observed data values that we have
25. Residual Plot
Residual Plot – a scatter plot of the 𝑥, 𝑦 values after each
of the y-values has been replaced by the residual
value, “𝒀𝑶𝒃𝒔𝒆𝒓𝒗𝒆𝒅 - 𝒀𝑷𝒓𝒆𝒅𝒊𝒄𝒕𝒆𝒅”
• That is, a residual plot is a graph of the points
𝑥, ( 𝒀𝑶𝒃𝒔𝒆𝒓𝒗𝒆𝒅 - 𝒀𝑷𝒓𝒆𝒅𝒊𝒄𝒕𝒆𝒅 )
26. Residula Plot Analysis
When analysing a residual plot, look for a pattern
in the way the points are configured, and use
these criteria:
1. The residual plot should not have any obvious patterns
(not even a straight line pattern). This confirms that the
scatterplot of the sample data is a straight-line pattern.
27. Residula Plot Analysis
When analysing a residual plot, look for a pattern
in the way the points are configured, and use
these criteria:
2. The residual plot should not become thicker (or thinner)
when viewed from left to right. This confirms the
requirement that for different fixed values of x, the
distributions of the corresponding y values all have the
same standard deviation.
28. Let’s observe what is good or bad
about the individual regression
models.
29. Regression model is a good
model
Residual Plot Suggesting that
the regression Eqution is a
Good Model
30. Distinct pattern: sample data
may not follow a straight-line
pattern.
Residual Plot with an Obvious
Pattern, Suggesting that the
regression equation Isn’t a
good model.
31. Residual plot becoming
thicker: equal standard
deviations violated
Residual Plot that becomes
thicker. Suggesting that the
regression equation Isn’t a
good model
32. CREDITS: This presentation template was
created by Slidesgo, including icons by
Flaticon, and infographics & images by
Freepik
Many
Thanks!
Presented by: