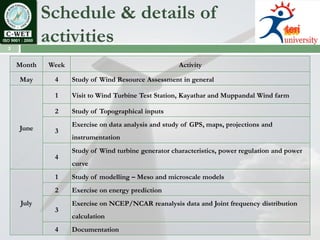
A STUDY ON WIND RESOURCE ASSESSMENT


                           Minor Project
                                   done at
                       C-WET, Chennai
                      May 2010 - July 2010

                             Presented by
                             S. Lakshmi
                               0907MER
Objectives
2


    • Exhaustive Study of WRA methodology, steps and
    concepts
    • Study of different kinds of terrain features and their
    influence on wind speeds.
    • Calculation of the essential parameters of WRA from
    the measured data.
    • Estimation of energy output for the given data.
    • Study of types of modelling for wind flow analysis.
Schedule & details of
3
            activities
    Month   Week                                     Activity

    May      4     Study of Wind Resource Assessment in general

             1     Visit to Wind Turbine Test Station, Kayathar and Muppandal Wind farm

             2     Study of Topographical inputs
                   Exercise on data analysis and study of GPS, maps, projections and
    June     3
                   instrumentation
                   Study of Wind turbine generator characteristics, power regulation and power
             4
                   curve
             1     Study of modelling – Meso and microscale models
             2     Exercise on energy prediction
     July          Exercise on NCEP/NCAR reanalysis data and Joint frequency distribution
             3
                   calculation
             4     Documentation
Wind energy scenario
4


                                                                      Gross      Total Capacity (MW)
                                                        State        Potential             till
                                                                      (MW)              31.03.09

                                                    Andhra Pradesh     8968             122.5
                                                       Gujarat        10,645           1566.5
                                                      Karnataka       11,531           1327.4
                                                        Kerala         1171             27.0
                                                    Madhya Pradesh     1019             212.8
                                                     Maharashtra       4584            1938.9
                                                        Orissa         255                -
                                                      Rajasthan        4858             738.4
                                                     West Bengal                         1.1
                                                      Tamil Nadu       5530            4304.5
                                                        Others                           3.2
                                                        Total
                                                                      48,561           10242.3
                                                      (All India)


    Wind power installations worldwide                Indian wind power installation
      (Source: World Wind Energy Report, 2009)   (Source: http://www.inwea.org/aboutwindenergy.htm)
Basic science of wind
5
            power
     Wind – manifestation of solar power and rotation of
    earth
                   Kinetic energy = (mV2)/2
               Where m= Density (ρ) x Volume
                     m= ρ x A x V x time
       Therefore, Kinetic energy = (ρ x A x V3 x time)/2
        Kinetic energy / time = Power = (ρ x A x V3)/2
       Power / Area = Wind power density = (ρ x V3)/2

     WRA involves Regional assessment and Siting
     Need for modelling
        • Meso- scale modelling
             Large area screening & Field visit
             Validation (Data collection & Screening)
             Micro siting
        • Micro-scale modelling
6


                                                                        Overview
                                                                        of WRA


Source: http://www.wind-energy-the-facts.org/images/fig/chap1/2-2.jpg
Inputs
7


    Climatological   Topographical   Wind turbine
        inputs           inputs        generator
                                     characteristics
Climatological and
8
     topographical inputs

    • Monthly wind speed
                                            • Terrain
    • Wind power density – at measured
      level as well as extrapolated to 50     • Roughness
      m level                                 • Obstacle
    • Power law index                         • Orography
    • Energy pattern factor                 • Maps and map projections
    • Air density                           • SRTM
    • Turbulence intensity                  • GPS
    • Weibull parameters                    • GIS
    • Wind rose                             • UTM co-ordinate system


    Climatological                          Topographical
    inputs                                  inputs
Modeling
9


    Meso-scale modeling


       NCEP/NCAR                                                            Generalised
        reanalysis                                                            regional
        long term                  Orography               Roughness        wind climate
           data                                                              for large
                                                                             domains


    Micro-scale modeling

                                                                                 Regional
    Measured               Wind                  Wind             Terrain           Wind
      Time                 Speed               direction         features       Climate for
     Series                                                                      the given
                                                                                  location


    Combined meso and micro scale modeling
    Ex: WAsP- KAMM model
WTG Characteristics
 10


1. Classification

                                                            • Constant speed induction
                                                Generator     (asynchronous) machines
                                                            • Variable speed induction generator
      Axis of       • Vertical axis (Darrieus
                      type)                     concepts    • Synchronous generator (only variable
      rotation      • Horizontal axis                         speed)


                    •   Single bladed                       • Turbines with gear box (mostly
       Blade        •   Two bladed              Gearbox       constant speed generators)
                                                            • Turbines without gear box (mostly
      concept       •
                    •
                        Three bladed
                        Multi bladed
                                                concepts      slow variable speed synchronous
                                                              generators used)


    Power           • Stall regulated
  regulation        • Pitch regulated
                                                 Tower
                                                            •
                                                            •
                                                                Tubular towers (steel)
                                                                Lattice towers (steel)
                    • Active stall concept
   concept                                      concepts    •   Flexible towers (steel)
                                                            •   Concrete tubular towers
WTG Characteristics
11


2. Power regulation
                                                                                 Passive
                                                                                  stall
The driving aerodynamic forces can be reduced by                                 control

• altering the rotor blade’s aerodynamic angle of attack
• reducing the projected rotor-swept area or                                                           Active
                                                            Yaw
                                                                                                        pitch
• changing the flow velocity at the rotor blades           control
                                                                                                       control
                                                                                  Power
                                                                                regulation


                                                                                             Passive
                                                                 Active stall
                                                                                              pitch
                                                                  control
                                                                                             control


     Pitch adjustment (left) and yaw adjustment (right)
WTG Characteristics
12


3. Power curve and thrust curve


                                                             • Thrust curve - related to losses of energy
                                                             transformed onto turbulent kinetic energy.
                                                             • Used to calculate energy losses due to wake
                                                             effect.
                                                             • For this reason the thrust curve is also
     Source: http://zone.ni.com/devzone/cda/tut/p/id/8189    included as input.

4. Annual energy output prediction
• Annual Frequency distribution
                                                            Capacity factor = Average loads for a period
• Power curve of specific turbine                                              of time/ Plant capacity
• Capacity factor
• Losses
WTTS, Kayathar
13


      Need for       • To analyze the suitability
                     • To satisfy the requirements of purchaser

       Testing       • For verification and monitoring
                     • For the investor to analyse performance


       Testing       • Power performance
                     • Yaw efficiency

        done         • Safety and functional testing
                     • Load measurements


     Facilities at   • 2 test beds in Kayathar, conforming to the IEC
                       standards, without obstacles upto 1.5 km.
                     • Nine 200 kW capacity Micon machines
      the WTTS       • A 600 kW Suzlon machine
                     • 2 MW Kenersys machine under installation
Snapshots from WTTS
14
ஆரல்வாய்ம   ாழி
15
Exercises & results
16


1. Wind resource assessment                                         Wind Speed
                                                                                      Frequency distribution (%)

                                                                      (m/s)      at 50 m       at 30 m        at 10 m
              Mean                                        Wind
                                                Energy                 0-2.5     2.407          4.120         7.361
     Height   Wind    Standard    Turbulenc               Power
                                                Pattern               2.5-3.5    5.347          7.384         13.287
      (m)     Speed   Deviation   e Intensity             Density     3.5-4.5    11.921         14.398        18.889
                                                Factor
              (m/s)                                       (W/m2)      4.5-5.5    16.065         17.014        17.037
       50      6.58     1.06         0.179       1.37      238.16     5.5-6.5    16.111         15.764        16.343
                                                                      6.5-7.5    14.676         14.514        12.338
       30      6.14     1.14         0.208       1.41      199.8
                                                                      7.5-8.5    13.380         11.690         8.472
       10      5.3      1.21         0.258       1.47      133.58     8.5-9.5    9.861          8.333          4.352
                                                                     9.5-10.5    6.343          4.421          1.134
                                                                     10.5-11.5    2.338         1.250          0.347
                                                                     11.5-12.5    0.718         0.556          0.347
                                                                     12.5-13.5    0.556         0.394          0.093
                                                                     13.5-14.5    0.231         0.139          0.000
                                                                     14.5-15.5    0.046         0.023          0.000
                                                                     15.5-16.5    0.000         0.000          0.000
                                                                     16.5-17.5    0.000         0.000          0.000
                                                                     17.5-18.5    0.000         0.000          0.000
                                                                     18.5-19.5    0.000         0.000          0.000
                                                                     19.5-20.5    0.000         0.000          0.000
                                                                      >20.5       0.000         0.000          0.000
Exercises & results
17


 2. Energy estimation
 3. Long term wind speed estimation using NCEP/NCAR Reanalysis data set

     Year   Jan   Feb   Mar   Apr   May   Jun   Jul   Aug   Sep   Oct   Nov   Dec   Avg
     2000   3.9   2.8   4.5   6.4   7.1   6.2   4.9   3.4   3     2.1   1.4   2.1    4
     2001   2.5   3.3   2.1   4.7   7.7   5.4   4.5   3.5   2.7   1.8   0.9   1.3   3.4
     2002   1.3   2.3   3.1   5.1   7.5   3.8   7.2   2.6   3.9   1.3   0.6   2.4   3.4
     2003   1.9   2.5   2.9   4.1   6.8   6.3   3.3   3.8   2.9   1.7   2.3   2.1   3.4
     2004   1.7   2.2   3.2   5.2   4.5   4.4   4.4   3.3   1.3   0.3   0.5   1.3   2.7
     2005   2.8   4.3   3.5   3.7   5.7   4.5   4.7   4.1   1.4    1    0.9   0.6   3.1
     2006   2.9   2.9   2.5   3.8   5.9   4.2   4.5   2.4   1.2   0.9   0.1   2.3   2.8
     2007   1.8   3.4   3.1   3.2   5.6   3.9   4.4   2.8   1.7   1.6   1.2    1    2.8
     2008   1.7   2.4   2.4   3.5   8.2   6.1   5.6   3.7   0.9   1.3   0.9   0.7   3.1
     2009   2.5   3.2   3.2   5.3   6.4   5.1   3.5   4.2   3.5   1.1   0.7   1.6   3.4
     2010   1.3   2.6   3.9   5.3   7.3   5.7                                       4.35
Exercises & results
18


                            Trend of average
                           wind speeds for ten
                                  years
Exercises & results
19
                                                                  Number of hours
                       Direction
                                   N          NE       E           SE         S          SW         W          NW
                       Speed
                       (m/s)
                            1      361.75     361.75   361.75      361.75     361.75     361.75     361.75     361.75
                            3      345.19     99.84    25.93         2.71         7.35   136.99     171.44      13.54
                            4      318.54      92.13   23.93            2.5       6.79   126.42      158.2       12.5
                            5      126.57     22.89         4.2          0        0.93   165.81     374.11      21.48
                            6      118.79      21.48       3.95          0        0.88   155.62     351.12      20.16
     Joint frequency
                            7      109.43      19.79       3.63          0        0.81   143.34     323.43      18.57
       distribution
                            8      30.67        2.36         0           0          0    196.99     586.24     37.75
                            9          9.98     0.77         0           0          0     64.12     190.84      12.29
                           10           6.1     0.47         0           0          0     39.21      116.7       7.51
                           11          1.52        0         0           0          0     16.67      73.23       8.59
                           12          0.74        0         0           0          0      8.17      35.88       4.21
                           13          0.38        0         0           0          0      4.17      18.31       2.15
                           14          0.18        0         0           0          0          2      8.79       1.03
                           15          0.11        0         0           0          0      1.17         5.13      0.6
                           16          0.05        0         0           0          0         0.5       2.2      0.26
                           17          0.02        0         0           0          0      0.17       0.73       0.09
                           18          0.02        0         0           0          0      0.17       0.73       0.09
                       JFD (%)      16.28       7.08       4.82      4.18         4.31     16.2      31.64       5.95
Exercises & results
20


                           Observed wind
                              climate
Discussion and
21
           conclusion
WIND RESOURCE ASSESSMENT
MWS of 6.58 m/s and MWPD of 238 W/m2 at 50 m. Very good wind power potential for this
particular month. With further data for the rest of the year and any turbine’s characteristics (power
curve), the annual energy output can also be predicted.

ENERGY ESTIMATION
Annual energy output predicted is slightly over 50 lakh units. It also gives a capacity factor of about
32% (without losses), which justifies setting up a wind farm using this particular class of wind
turbines in this location.

NCEP/ NCAR REANALYSIS DATA SET
Given the actual measured values of wind speeds during any intermediate period of time, necessary
comparison and correlation can be done with this data to analyse and thus calculate the percentage
uncertainty factor involved in the energy estimation using this data.

JOINT FREQUENCY DISTRIBUTION
The annual wind speed and direction data recorded by old Second Wind data logger has been
converted to a WAsP compatible .tab file format. This file can be used to further obtain the OWC for
this location, which will also allow an estimation of the mean annual wind speed and wind power
density value. Following that, micrositing can be undertaken.
References
22

Centre for Wind Energy Technology (C-WET) 2005, Wind Energy Resource Survey in India –VII, Centre for Wind Energy
    Technology, Chennai.
Centre for Wind Energy Technology (C-WET) 2006, Course material – 2nd International Training Program on Wind Turbine
    Technology and Applications, Centre for Wind Energy Technology, Chennai
Centre for Wind Energy Technology (C-WET) 2006, Course material – National Training Program on Wind Farm Development and
    Related Issues, 1st and 2nd September 2005, Centre for Wind Energy Technology, Chennai
Centre for Wind Energy Technology (C-WET) 2010, Indian Wind Atlas, Centre for Wind Energy Technology, Chennai
European Wind Energy Association (EWEA) (2009), Wind Energy – The Facts – A guide to the technology, economics and future of
    wind power, Earthscan, London
Gary L, Johnson 2006, Wind Energy Systems, Electronic Edition, Manhattan
Gipe, Paul 2004, Wind Power, James & James (Science Publishers) Ltd, London
Hau, Erich 2006, Wind Turbines – Fundamentals, Technologies, Application, Economics, 2nd edition Springer
Mani, A 1990, Wind Energy Resource Survey for India – I, Allied Publishers, New Delhi.
Mani, A 1992, Wind Energy Resource Survey for India – II, Allied Publishers, New Delhi.
Mani, A 1994, Wind Energy Resource Survey for India – III, Allied Publishers, New Delhi.
Manwell, JF, McGowan, JG & Rogers, AL 2002, Wind Energy Explained, John Wiley & Sons Ltd., England
Pillai, GM 2006, Wind Power Development in India, World Institute of Sustainable Energy, Pune
Sathyajith Mathew 2006, Wind Energy – Fundamentals, Resource Analysis and Economics, Springer
Skamarock. W., Dudhia. J. et al., (2005) A Description of the Advanced Research WRF Version 2, NCAR Technical note.
Stiebler, Manfred 2008, Wind Energy Systems for Electric Power Generation, Springer, Heidelberg
Strack, M & Riedel, V 2004, State of the Art in Application of Flow Models for Micrositing, DEWEK 2004 Proceedings
Vaughn Nelson 2009, Wind Energy – Renewable Energy and the Environment, CRC Press, New York
World Wind Energy Association (WWEA) 2010, World Wind Energy Report, World Wind Energy Association, Germany
Indian Wind Energy Association (InWEA) 2007, viewed 30 July 2010, http://www.inwea.org/

Si presentation

  • 1.
    A STUDY ONWIND RESOURCE ASSESSMENT Minor Project done at C-WET, Chennai May 2010 - July 2010 Presented by S. Lakshmi 0907MER
  • 2.
    Objectives 2 • Exhaustive Study of WRA methodology, steps and concepts • Study of different kinds of terrain features and their influence on wind speeds. • Calculation of the essential parameters of WRA from the measured data. • Estimation of energy output for the given data. • Study of types of modelling for wind flow analysis.
  • 3.
    Schedule & detailsof 3 activities Month Week Activity May 4 Study of Wind Resource Assessment in general 1 Visit to Wind Turbine Test Station, Kayathar and Muppandal Wind farm 2 Study of Topographical inputs Exercise on data analysis and study of GPS, maps, projections and June 3 instrumentation Study of Wind turbine generator characteristics, power regulation and power 4 curve 1 Study of modelling – Meso and microscale models 2 Exercise on energy prediction July Exercise on NCEP/NCAR reanalysis data and Joint frequency distribution 3 calculation 4 Documentation
  • 4.
    Wind energy scenario 4 Gross Total Capacity (MW) State Potential till (MW) 31.03.09 Andhra Pradesh 8968 122.5 Gujarat 10,645 1566.5 Karnataka 11,531 1327.4 Kerala 1171 27.0 Madhya Pradesh 1019 212.8 Maharashtra 4584 1938.9 Orissa 255 - Rajasthan 4858 738.4 West Bengal 1.1 Tamil Nadu 5530 4304.5 Others 3.2 Total 48,561 10242.3 (All India) Wind power installations worldwide Indian wind power installation (Source: World Wind Energy Report, 2009) (Source: http://www.inwea.org/aboutwindenergy.htm)
  • 5.
    Basic science ofwind 5 power  Wind – manifestation of solar power and rotation of earth Kinetic energy = (mV2)/2 Where m= Density (ρ) x Volume m= ρ x A x V x time Therefore, Kinetic energy = (ρ x A x V3 x time)/2 Kinetic energy / time = Power = (ρ x A x V3)/2 Power / Area = Wind power density = (ρ x V3)/2  WRA involves Regional assessment and Siting  Need for modelling • Meso- scale modelling Large area screening & Field visit Validation (Data collection & Screening) Micro siting • Micro-scale modelling
  • 6.
    6 Overview of WRA Source: http://www.wind-energy-the-facts.org/images/fig/chap1/2-2.jpg
  • 7.
    Inputs 7 Climatological Topographical Wind turbine inputs inputs generator characteristics
  • 8.
    Climatological and 8 topographical inputs • Monthly wind speed • Terrain • Wind power density – at measured level as well as extrapolated to 50 • Roughness m level • Obstacle • Power law index • Orography • Energy pattern factor • Maps and map projections • Air density • SRTM • Turbulence intensity • GPS • Weibull parameters • GIS • Wind rose • UTM co-ordinate system Climatological Topographical inputs inputs
  • 9.
    Modeling 9 Meso-scale modeling NCEP/NCAR Generalised reanalysis regional long term Orography Roughness wind climate data for large domains Micro-scale modeling Regional Measured Wind Wind Terrain Wind Time Speed direction features Climate for Series the given location Combined meso and micro scale modeling Ex: WAsP- KAMM model
  • 10.
    WTG Characteristics 10 1.Classification • Constant speed induction Generator (asynchronous) machines • Variable speed induction generator Axis of • Vertical axis (Darrieus type) concepts • Synchronous generator (only variable rotation • Horizontal axis speed) • Single bladed • Turbines with gear box (mostly Blade • Two bladed Gearbox constant speed generators) • Turbines without gear box (mostly concept • • Three bladed Multi bladed concepts slow variable speed synchronous generators used) Power • Stall regulated regulation • Pitch regulated Tower • • Tubular towers (steel) Lattice towers (steel) • Active stall concept concept concepts • Flexible towers (steel) • Concrete tubular towers
  • 11.
    WTG Characteristics 11 2. Powerregulation Passive stall The driving aerodynamic forces can be reduced by control • altering the rotor blade’s aerodynamic angle of attack • reducing the projected rotor-swept area or Active Yaw pitch • changing the flow velocity at the rotor blades control control Power regulation Passive Active stall pitch control control Pitch adjustment (left) and yaw adjustment (right)
  • 12.
    WTG Characteristics 12 3. Powercurve and thrust curve • Thrust curve - related to losses of energy transformed onto turbulent kinetic energy. • Used to calculate energy losses due to wake effect. • For this reason the thrust curve is also Source: http://zone.ni.com/devzone/cda/tut/p/id/8189 included as input. 4. Annual energy output prediction • Annual Frequency distribution Capacity factor = Average loads for a period • Power curve of specific turbine of time/ Plant capacity • Capacity factor • Losses
  • 13.
    WTTS, Kayathar 13 Need for • To analyze the suitability • To satisfy the requirements of purchaser Testing • For verification and monitoring • For the investor to analyse performance Testing • Power performance • Yaw efficiency done • Safety and functional testing • Load measurements Facilities at • 2 test beds in Kayathar, conforming to the IEC standards, without obstacles upto 1.5 km. • Nine 200 kW capacity Micon machines the WTTS • A 600 kW Suzlon machine • 2 MW Kenersys machine under installation
  • 14.
  • 15.
  • 16.
    Exercises & results 16 1.Wind resource assessment Wind Speed Frequency distribution (%) (m/s) at 50 m at 30 m at 10 m Mean Wind Energy 0-2.5 2.407 4.120 7.361 Height Wind Standard Turbulenc Power Pattern 2.5-3.5 5.347 7.384 13.287 (m) Speed Deviation e Intensity Density 3.5-4.5 11.921 14.398 18.889 Factor (m/s) (W/m2) 4.5-5.5 16.065 17.014 17.037 50 6.58 1.06 0.179 1.37 238.16 5.5-6.5 16.111 15.764 16.343 6.5-7.5 14.676 14.514 12.338 30 6.14 1.14 0.208 1.41 199.8 7.5-8.5 13.380 11.690 8.472 10 5.3 1.21 0.258 1.47 133.58 8.5-9.5 9.861 8.333 4.352 9.5-10.5 6.343 4.421 1.134 10.5-11.5 2.338 1.250 0.347 11.5-12.5 0.718 0.556 0.347 12.5-13.5 0.556 0.394 0.093 13.5-14.5 0.231 0.139 0.000 14.5-15.5 0.046 0.023 0.000 15.5-16.5 0.000 0.000 0.000 16.5-17.5 0.000 0.000 0.000 17.5-18.5 0.000 0.000 0.000 18.5-19.5 0.000 0.000 0.000 19.5-20.5 0.000 0.000 0.000 >20.5 0.000 0.000 0.000
  • 17.
    Exercises & results 17 2. Energy estimation 3. Long term wind speed estimation using NCEP/NCAR Reanalysis data set Year Jan Feb Mar Apr May Jun Jul Aug Sep Oct Nov Dec Avg 2000 3.9 2.8 4.5 6.4 7.1 6.2 4.9 3.4 3 2.1 1.4 2.1 4 2001 2.5 3.3 2.1 4.7 7.7 5.4 4.5 3.5 2.7 1.8 0.9 1.3 3.4 2002 1.3 2.3 3.1 5.1 7.5 3.8 7.2 2.6 3.9 1.3 0.6 2.4 3.4 2003 1.9 2.5 2.9 4.1 6.8 6.3 3.3 3.8 2.9 1.7 2.3 2.1 3.4 2004 1.7 2.2 3.2 5.2 4.5 4.4 4.4 3.3 1.3 0.3 0.5 1.3 2.7 2005 2.8 4.3 3.5 3.7 5.7 4.5 4.7 4.1 1.4 1 0.9 0.6 3.1 2006 2.9 2.9 2.5 3.8 5.9 4.2 4.5 2.4 1.2 0.9 0.1 2.3 2.8 2007 1.8 3.4 3.1 3.2 5.6 3.9 4.4 2.8 1.7 1.6 1.2 1 2.8 2008 1.7 2.4 2.4 3.5 8.2 6.1 5.6 3.7 0.9 1.3 0.9 0.7 3.1 2009 2.5 3.2 3.2 5.3 6.4 5.1 3.5 4.2 3.5 1.1 0.7 1.6 3.4 2010 1.3 2.6 3.9 5.3 7.3 5.7 4.35
  • 18.
    Exercises & results 18 Trend of average wind speeds for ten years
  • 19.
    Exercises & results 19 Number of hours Direction N NE E SE S SW W NW Speed (m/s) 1 361.75 361.75 361.75 361.75 361.75 361.75 361.75 361.75 3 345.19 99.84 25.93 2.71 7.35 136.99 171.44 13.54 4 318.54 92.13 23.93 2.5 6.79 126.42 158.2 12.5 5 126.57 22.89 4.2 0 0.93 165.81 374.11 21.48 6 118.79 21.48 3.95 0 0.88 155.62 351.12 20.16 Joint frequency 7 109.43 19.79 3.63 0 0.81 143.34 323.43 18.57 distribution 8 30.67 2.36 0 0 0 196.99 586.24 37.75 9 9.98 0.77 0 0 0 64.12 190.84 12.29 10 6.1 0.47 0 0 0 39.21 116.7 7.51 11 1.52 0 0 0 0 16.67 73.23 8.59 12 0.74 0 0 0 0 8.17 35.88 4.21 13 0.38 0 0 0 0 4.17 18.31 2.15 14 0.18 0 0 0 0 2 8.79 1.03 15 0.11 0 0 0 0 1.17 5.13 0.6 16 0.05 0 0 0 0 0.5 2.2 0.26 17 0.02 0 0 0 0 0.17 0.73 0.09 18 0.02 0 0 0 0 0.17 0.73 0.09 JFD (%) 16.28 7.08 4.82 4.18 4.31 16.2 31.64 5.95
  • 20.
    Exercises & results 20 Observed wind climate
  • 21.
    Discussion and 21 conclusion WIND RESOURCE ASSESSMENT MWS of 6.58 m/s and MWPD of 238 W/m2 at 50 m. Very good wind power potential for this particular month. With further data for the rest of the year and any turbine’s characteristics (power curve), the annual energy output can also be predicted. ENERGY ESTIMATION Annual energy output predicted is slightly over 50 lakh units. It also gives a capacity factor of about 32% (without losses), which justifies setting up a wind farm using this particular class of wind turbines in this location. NCEP/ NCAR REANALYSIS DATA SET Given the actual measured values of wind speeds during any intermediate period of time, necessary comparison and correlation can be done with this data to analyse and thus calculate the percentage uncertainty factor involved in the energy estimation using this data. JOINT FREQUENCY DISTRIBUTION The annual wind speed and direction data recorded by old Second Wind data logger has been converted to a WAsP compatible .tab file format. This file can be used to further obtain the OWC for this location, which will also allow an estimation of the mean annual wind speed and wind power density value. Following that, micrositing can be undertaken.
  • 22.
    References 22 Centre for WindEnergy Technology (C-WET) 2005, Wind Energy Resource Survey in India –VII, Centre for Wind Energy Technology, Chennai. Centre for Wind Energy Technology (C-WET) 2006, Course material – 2nd International Training Program on Wind Turbine Technology and Applications, Centre for Wind Energy Technology, Chennai Centre for Wind Energy Technology (C-WET) 2006, Course material – National Training Program on Wind Farm Development and Related Issues, 1st and 2nd September 2005, Centre for Wind Energy Technology, Chennai Centre for Wind Energy Technology (C-WET) 2010, Indian Wind Atlas, Centre for Wind Energy Technology, Chennai European Wind Energy Association (EWEA) (2009), Wind Energy – The Facts – A guide to the technology, economics and future of wind power, Earthscan, London Gary L, Johnson 2006, Wind Energy Systems, Electronic Edition, Manhattan Gipe, Paul 2004, Wind Power, James & James (Science Publishers) Ltd, London Hau, Erich 2006, Wind Turbines – Fundamentals, Technologies, Application, Economics, 2nd edition Springer Mani, A 1990, Wind Energy Resource Survey for India – I, Allied Publishers, New Delhi. Mani, A 1992, Wind Energy Resource Survey for India – II, Allied Publishers, New Delhi. Mani, A 1994, Wind Energy Resource Survey for India – III, Allied Publishers, New Delhi. Manwell, JF, McGowan, JG & Rogers, AL 2002, Wind Energy Explained, John Wiley & Sons Ltd., England Pillai, GM 2006, Wind Power Development in India, World Institute of Sustainable Energy, Pune Sathyajith Mathew 2006, Wind Energy – Fundamentals, Resource Analysis and Economics, Springer Skamarock. W., Dudhia. J. et al., (2005) A Description of the Advanced Research WRF Version 2, NCAR Technical note. Stiebler, Manfred 2008, Wind Energy Systems for Electric Power Generation, Springer, Heidelberg Strack, M & Riedel, V 2004, State of the Art in Application of Flow Models for Micrositing, DEWEK 2004 Proceedings Vaughn Nelson 2009, Wind Energy – Renewable Energy and the Environment, CRC Press, New York World Wind Energy Association (WWEA) 2010, World Wind Energy Report, World Wind Energy Association, Germany Indian Wind Energy Association (InWEA) 2007, viewed 30 July 2010, http://www.inwea.org/