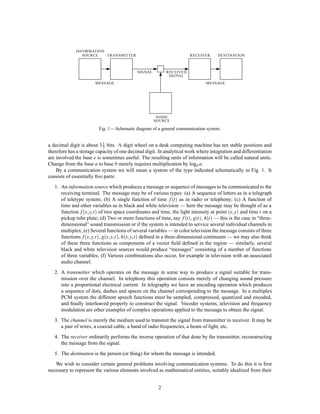
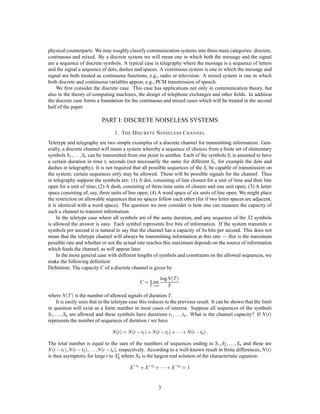
This document is the introduction to Claude Shannon's seminal 1948 paper "A Mathematical Theory of Communication". In the introduction, Shannon outlines the goal of developing a general theory of communication and discusses some key concepts. He defines communication as reproducing a message at one point that was selected at another point. Shannon introduces the concept of measuring information using a logarithmic scale, with the specific unit of "bit" if using base 2. He provides a schematic diagram of the basic elements of a communication system and classifies systems as discrete, continuous, or mixed. The introduction lays the groundwork for Shannon's mathematical analysis of discrete noiseless systems in the first part of the paper.
This document introduces a mathematical theory of communication developed by Claude Shannon. It begins with an overview of communication systems and their components. Shannon then defines the capacity of a discrete channel as the maximum rate at which information can be transmitted, which is the logarithm of the number of possible signals over time. He examines discrete noiseless systems and sources of information, explaining how the statistical structure of messages can be used to reduce the required channel capacity through proper encoding.
This document is an introduction to Claude Shannon's seminal 1948 paper "A Mathematical Theory of Communication". It provides an overview of communication systems and introduces Shannon's concept of using a logarithmic measure to quantify information. Specifically:
1) It defines the key components of a general communication system including an information source, transmitter, channel, receiver, and destination.
2) It explains Shannon's proposal to use a logarithmic measure (typically base 2, resulting in units called "bits") to quantify the information content of messages. This provides a convenient way to measure the capacity of communication channels.
3) It outlines Shannon's plan to develop a mathematical theory of communication by modeling different types of systems - discrete, continuous,
1. The document summarizes Shannon's seminal paper on "A Mathematical Theory of Communication" which established information theory. It introduces discrete, continuous, and mixed communication systems and discusses measuring a channel's information capacity.
2. For discrete systems like telegraphy with a finite set of symbols, the channel capacity can be measured as the base-2 logarithm of the number of possible symbols transmitted per second.
3. The paper aims to develop a mathematical theory to represent communication systems and analyze factors like noise and message statistics to understand information transmission.
IJERA (International journal of Engineering Research and Applications) is International online, ... peer reviewed journal. For more detail or submit your article, please visit www.ijera.com
Distributed Spatial Modulation based Cooperative Diversity Schemeijwmn
: In this paper, a distributed spatial modulation based cooperative diversity scheme for relay
wireless networks is proposed. Where, the space-time block code is exploited to integrate with distributed
spatial modulation. Therefore, the interested transmission scheme achieves high diversity gain. By using
Monte-Carlo simulation based on computer, we showed that our proposed transmission scheme outperforms
state-of-the-art cooperative relaying schemes in terms bit error rate (BER) performance.
- The document discusses data communication fundamentals including data, signals, analog vs digital signals, and time domain vs frequency domain representations of signals.
- It defines key concepts such as bandwidth, bit rate, noise sources, and baseband vs broadband signals.
- Examples are provided to explain periodic and aperiodic signals, and how signals can be represented in both the time and frequency domains.
Comparative evaluation of bit error rate for different ofdm subcarriers in ra...ijmnct
In the present situation, the expectation about the quality of signals in wireless communication is as high as possible. This quality issue is dependent upon the different communication parameters. One of the most important issues is to reduce the bit error rate (BER) to enhance the performance of the system. This paper provides a comparative analysis on the basis of this bit error rate. I have compared the BER for different number of subcarriers in OFDM system for BPSK modulation scheme. I have taken 6 varieties of data subcarriers to analyze this comparison. Here my target is to reach at the lowest level of BER for BPSK modulation. That is achieved at 2048 number of subcarriers.
This document summarizes and compares existing routing protocols for delay tolerant networks. It presents routing protocols such as first contact, direct delivery, PROPHET, spray and wait, and epidemic routing. It also proposes a new dynamic spray and wait protocol that considers the quality of nodes based on their activity level. Simulation results show that the proposed algorithm that considers message size, number of copies, and time to live performs better than the traditional drop front approach in terms of delivery probability, buffer time average, overhead ratio, packets dropped, and hop count average.
Mathematical Explanation of channel capacityHere we can see that the channel capacity is measured with the multiplication of pulses per second and information. This is how we can measure the channel capacity.
This document summarizes a study on modeling GPRS session time distribution. The study group was asked to construct a model for simultaneous transmission of voice and data on mobile networks and determine equipment needs to provide a required quality of service. The summary develops:
1) A Markov chain model where voice calls have priority over data calls. The model accounts for variable voice, data arrival rates and data call sizes.
2) An initial model where each data call uses one channel. Balance equations are developed to calculate the stationary distribution.
3) Future work is outlined to model variable data call channel usage and develop numerical solutions to understand performance metrics like mean wait times.
Towards efficient content dissemination over DTNAmir Krifa
This document summarizes a PhD thesis on content dissemination over disruption tolerant networks. It discusses challenges like disruption, dynamic environments, and selfish nodes. It presents optimal solutions like GBSD that require global knowledge for point-to-point routing, and a distributed solution called HBSD. It also introduces a content-centric approach called MobiTrade that optimizes resource allocation per content channel. Validation results show HBSD performs close to optimal and outperforms epidemic routing, and MobiTrade approximates the optimal channel allocation.
Efficient Query Evaluation of Probabilistic Top-k Queries in Wireless Sensor ...ijceronline
The document summarizes research on efficient query evaluation methods for probabilistic top-k queries in wireless sensor networks. It proposes three algorithms (SSB, NSB, BB) that use the concepts of sufficient and necessary sets to prune data and reduce transmissions between clusters and the base station. It also develops an adaptive algorithm that dynamically switches between the three based on estimated costs. Experimental results show the algorithms outperform baselines and the adaptive approach achieves near-optimal performance under different conditions.
New strategy to optimize the performance of spray and wait routing protocolijwmn
Delay Tolerant Networks have been (DTN) have been developed to support the irregular connectivity often
separate networks. The main routing problem in this type of network is embarrassed by time that is
extremely long, since connections are intermittent and opportunistic. Routing protocols must take into
account the maximum constraint encountered in this type of environment , use effective strategies
regarding the choice of relay nodes and buffer management nodes to improve the delivery of messages and
the time of their delivery . This article proposes a new strategy that optimizes the routing Spray and wait.
The proposed method uses the information contained in the messages delivered mostly paths traversed by
the messages before arriving at their destination and the time when nodes have receive these messages.
Simulation results show that the proposed strategy can increase the probability of delivery and minimizing
overhead unlike FIFO technology used with the default routing ' sprat and wait'
Speaker identification using mel frequency Phan Duy
This document summarizes a paper that presents a speaker identification system using Mel Frequency Cepstral Coefficients (MFCCs). MFCCs are used to extract features from speech signals that are less susceptible to variations between recordings of the same speaker. Vector quantization is then used to compress the extracted features for matching against enrolled speaker models. The system contains modules for feature extraction using MFCCs and feature matching, which are the two main components of all speaker recognition systems.
AGPM: An Authenticated Secure Group Communication Protocol for MANETsIDES Editor
This document summarizes the AGPM protocol for secure group communication in mobile ad hoc networks (MANETs). It authenticates mobile nodes using transitive signature schemes during routing. It establishes a collaborative group key using a tree-based approach and performs rekeying at time intervals instead of on every join/leave. Performance is evaluated against other protocols based on metrics like throughput, rekeying time, delay and overhead. Simulation results show AGPM has advantages over other protocols.
Performance Analysis of Bfsk Multi-Hop Communication Systems Over K-μ Fading ...ijwmn
Multi-hop communication systems gained popularity in wireless communications; they can be used to
extend the coverage of the network and reduce the transmitted power. The transmission of data from the
source node to the destination node in multi-hop communications undergoes through intermediate relay
nodes. In this paper, we study the performance of multi-hop communication systems, in terms of average bit
error rate (BER) with Binary frequency shift keying assuming the κ-µ fading channel model. Due to the
difficulty in finding the probability density function (PDF) of the end-to-end signal to noise ratio (SNR) and
hence for the performance metrics, we use Gaussian Mixture (GM) approximation technique to
approximate the PDF of the end to end SNR assuming the κ-µ fading models as weighted sums of Gaussian
distributions. Numerical results are provided for the BER of binary frequency shift keying (BFSK) of
amplify and forward (AF) multi-hop communication systems assuming different values for the fading
parameters (, ) and for different number of hops. Numerical results are validated by comparing them
with simulation results.
This document summarizes a student's DSP project on linear prediction models presented to Viet Nam National University- Ho Chi Minh City. It covers topics such as linear predictive coding (LPC), the least mean square error, the Levinson-Durbin algorithm, sub-band linear prediction models, and using prediction models for frequency-domain signal restoration. LPC is introduced as a powerful speech analysis technique that models the spectral envelope of digital speech signals using a linear predictive model of past samples. The prediction error signal and mean square prediction error are also discussed.
This document provides an overview of key concepts about data, signals, and their transmission. It discusses:
- The difference between data and signals, and advantages of digital over analog.
- The three components of signals: amplitude, frequency, and phase.
- How signal strength decreases over transmission due to attenuation.
- The four combinations of transmitting data and signals: analog data with analog signals, digital data with digital signals, digital data with analog signals, and analog data with digital signals.
- Several digital encoding schemes for transmitting digital data with digital signals, including NRZ-L, NRZI, Manchester, and Differential Manchester.
Speaker recognition systems aim to automatically identify or verify a speaker's identity based on characteristics of their voice. There are two main types: speaker identification determines which registered speaker is speaking, while speaker verification accepts or rejects a speaker's claimed identity. All systems contain modules for feature extraction and feature matching. Feature extraction represents the voice signal with parameters like MFCCs that can distinguish speakers. Feature matching compares extracted features from an unknown voice to known speaker models. The document describes the process of MFCC feature extraction in detail, including framing the speech signal, windowing frames, taking the FFT, mapping to the mel scale, and finally the DCT to produce MFCC coefficients.
IMPROVING SCHEDULING OF DATA TRANSMISSION IN TDMA SYSTEMScsandit
In an era where communication has a most important role in modern societies, designing efficient
algorithms for data transmission is of the outmost importance. TDMA is a technology used in many
communication systems such as satellites and cell phones. In order to transmit data in such systems we
need to cluster them in packages. To achieve a faster transmission we are allowed to preempt the
transmission of any packet in order to resume at a later time. Such preemptions though come with a delay
in order to setup for the next transmission. In this paper we propose an algorithm which yields improved
transmission scheduling. This algorithm we call MGA. We have proven an approximation ratio for MGA
and ran experiments to establish that it works even better in practice. In order to conclude that MGA will
be a very helpful tool in constructing an improved schedule for packet routing using preemtion with a setup
cost, we compare its results to two other efficient algorithms designed by researchers in the past.
Text-Independent Speaker Verification ReportCody Ray
Provides an introduction to the task of speaker recognition, and describes a not-so-novel speaker recognition system based upon a minimum-distance classification scheme. We describe both the theory and practical details for a reference implementation. Furthermore, we discuss an advanced technique for classification based upon Gaussian Mixture Models (GMM). Finally, we discuss the results of a set of experiments performed using our reference implementation.
The document analyzes and compares the performance of two Medium Access Control (MAC) protocols for wireless sensor networks: Sensor MAC (S-MAC) and Hybrid MAC (H-MAC).
[1] S-MAC is a contention-based protocol that reduces energy waste from idle listening by implementing synchronized sleep and listen schedules. Nodes form virtual clusters to wake up and communicate at the same time. H-MAC improves on this with a slotted frame structure that dynamically allocates slots.
[2] The performance of the two protocols is evaluated based on end-to-end delay, packet delivery ratio, packet drop rate, and energy consumption using the NS2 simulation tool.
[3] Spatial correlation
Differential pulse code modulation (DPCM) is a technique that encodes analog signals digitally by sampling the signal, predicting the next sample value based on previous samples, quantizing the difference between the actual and predicted values, and transmitting the quantized difference. DPCM reduces the required transmission bandwidth compared to standard PCM by exploiting the fact that differences between successive samples are typically smaller than the sample amplitudes themselves. It works by quantizing and transmitting the differences between actual and predicted sample values rather than directly quantizing the sample amplitudes.
PERFORMANCE IMPROVEMENT OF PAPR REDUCTION FOR OFDM SIGNAL IN LTE SYSTEMijwmn
This document discusses performance improvement of peak-to-average power ratio (PAPR) reduction for orthogonal frequency division multiplexing (OFDM) signals in long-term evolution (LTE) systems. It proposes an improved amplitude clipping and filtering method for PAPR reduction that shows significant improvement over existing methods, with a slight increase in bit error rate. The document provides background on OFDM, PAPR issues in OFDM, and motivations for reducing PAPR such as improving power amplifier efficiency.
Multihop Routing In Camera Sensor NetworksChuka Okoye
This poster abstract summarizes an experimental study of multihop routing in camera sensor networks. The experiments tested the Collection Tree Protocol (CTP) using CITRIC camera motes and TelosB motes. The experiments varied payload size and delay between packet transmissions to evaluate data rate, reception rate, and latency over different hop counts. The results show that there is a tradeoff between reception rate and latency. Adding a delay between transmissions can improve both data rate and reception rate compared to best effort transmission. The optimal delay depends on the network density and hop count.
Raul Oliva started his house cleaning business, Raul Enterprises, 7 years ago after working unofficially in the industry for over 18 years. He began the business to capitalize on an opportunity for steady work after a previous employer recommended him. The business has seen successes like retaining customers and receiving perks, but also faces challenges with scheduling and competitive pricing.
Ionic compounds consist of positively charged cations and negatively charged anions held together by ionic bonds. Common examples include sodium chloride (NaCl), where sodium atoms form Na+ ions by losing electrons and chloride atoms form Cl- ions by gaining electrons, resulting in an electrostatic attraction between the ions to form the solid ionic compound. Ionic compounds generally have high melting and boiling points and are soluble in water.
El documento resume la historia y evolución de la logística desde 1950 hasta la actualidad. Comenzó enfocándose en reducir costos de manera sistémica y equilibrar costos con servicio al cliente. En las décadas siguientes, surgió el enfoque de justo a tiempo, outsourcing, planificación global con proveedores, y sistemas integrados de planificación, previsión y reposición. Finalmente, la globalización llevó a la necesidad de fusiones logísticas para ofrecer cobertura global a los clientes.
3) When translating from the functional currency to the presentation currency, assets and liabilities are translated using the closing rate, income and expenses are translated using transaction date rates, and resulting
This document provides tips for a successful job search. It discusses preparing for a job search through self-assessment, researching career options and employers. It emphasizes the importance of networking to get job interviews over blind applications. Finally, it offers tips for preparing job search materials like resumes and cover letters, practicing interviews, and maintaining emotional and physical well-being during a job search. The overall message is to pursue multiple options until receiving a job offer.
The document discusses key concepts relating to financial instruments including definitions, classification, measurement and hedge accounting. It defines financial instruments as contracts that give rise to financial assets of one entity and financial liabilities or equity of another. It also discusses the classification of financial assets and liabilities under IAS 39 and IFRS 9. The document provides examples of different types of financial instruments like debt, equity and derivatives. It explains the accounting for compound financial instruments. Finally, the document discusses hedge accounting and provides examples of fair value and cash flow hedges.
Key milestones in prenatal development include the formation of structures to support growth in the first two weeks, the development of the head, eyes, nose, ears and mouth between 3-8 weeks, and the completion of the physical structure and development of body systems from 9 weeks until birth. Newborns develop gross motor skills like sitting and crawling, fine motor skills such as holding a spoon, and sensory, language and social skills in their first year. Parents can support development by singing, reading, cuddling, and encouraging play to help children succeed in school and life.
[1] D.Bushey Taxidermy was founded two years ago by David Bushey after he graduated from college and received taxidermy training.
[2] The small business focuses on producing high quality taxidermy mounts within a timely manner, which can be challenging due to the seasonal nature of the work.
[3] David overcomes this challenge by having two seasonal jobs - taxidermy in the winter and working for the U.S. Fish and Wildlife Service in the summer.
This document discusses accounting for income taxes according to IAS 12. It covers current tax liabilities and assets, deferred taxes, and timing differences between accounting and taxable profits. Examples are provided to illustrate accounting entries for current tax, deferred tax liabilities and assets from temporary differences, and the calculation of tax base amounts. The key concepts of permanent and temporary differences that affect the tax base are also explained.
IAS 36 provides guidance on impairment of assets. An impairment loss occurs when an asset's carrying amount exceeds its recoverable amount. A cash generating unit is the smallest identifiable group of assets that generates cash inflows independently of other assets. Impairment losses are first allocated to goodwill associated with the CGU, then proportionately to other assets in the CGU based on their carrying amounts.
The document discusses several costing techniques including throughput accounting, theory of constraints (TOC), target costing, and backflush costing. Throughput accounting focuses on increasing throughput and reducing inventory and expenses. TOC identifies bottlenecks limiting throughput and ways to remove them. Target costing determines the maximum allowable cost for a new product based on the anticipated selling price and desired profit. Backflush costing calculates product costs retrospectively at the end of the accounting period without tracking costs throughout production.
The document discusses IAS 2, which provides guidance on accounting for inventories. It defines inventories as assets held for sale, in production, or in the form of materials or supplies. The cost of inventories includes purchase costs, conversion costs, and other costs to bring them to their present location and condition. Inventories must be measured at the lower of cost or net realizable value.
Earnings per share (EPS) is a company's profit divided by its number of outstanding shares. It is important for investors to compare EPS over time and between companies. EPS can be basic, diluted, or adjusted for events like stock splits, bonus issues, or rights issues that affect the number of shares. Diluted EPS accounts for potentially dilutive securities like convertible debt. Anti-dilutive effects that increase EPS are ignored. Worked examples show how to calculate EPS under different circumstances.
This document discusses break even analysis, including cost-volume-profit (CVP) analysis, contribution, break even point, margin of safety, and break even charts. It defines key terms like contribution, break even point, and margin of safety. The break even point is where total sales equal total variable costs plus fixed costs. Margin of safety is the point above which profit is made. Break even charts graphically show the break even point and relationship between costs, sales, and activity levels. The document also covers multi-product break even analysis and the limitations of CVP analysis.
This document discusses accounting for construction contracts under IAS 11. It defines a construction contract, explains how to recognize contract revenue and costs over time using the percentage of completion method when the outcome can be reliably measured. It also discusses how to account for fixed price and cost plus contracts, as well as loss making contracts, contract variations, claims, incentives and how to determine the stage of completion.
This document is an introduction to Claude Shannon's seminal 1948 paper "A Mathematical Theory of Communication". It provides an overview of communication systems and introduces key concepts like discrete, continuous, and mixed systems. It also defines key terms like information source, transmitter, channel, receiver, and destination. The introduction lays the groundwork for Shannon's information theory by discussing measurement of information and choice of a logarithmic base (usually binary) to quantify information in bits.
Iaetsd a novel scheduling algorithms for mimo based wireless networksIaetsd Iaetsd
This document proposes new scheduling algorithms for MIMO wireless networks to improve system performance. It discusses designing practical user scheduling algorithms to maximize capacity in MIMO systems. Various MAC scheduling policies are implemented and modified to provide distributed traffic control, robustness against interference, and increased efficiency of resource utilization. Simulations using MATLAB compare the different policies and draw important results and conclusions. The paper suggests new priority scheduling and partially fair scheduling algorithms incorporating awareness of interference to improve system-level performance in MIMO wireless networks.
In this paper, we analyzed a numerical evaluation of the performance of MIMO radio systems in the LTE network environment. Downlink physical layer of the OFDM-MIMO based radio interface is considered for system model and a theoretical analysis of the bit error rate of the two space-time codes (SFBC 2×1 and FSTD 4×2 codes are adopted by the LTE norm as a function of the signal to noise ratio. Analytical expressions are given for transmission over a Rayleigh channel without spatial correlation which is then compared with Monte-Carlo simulations. Further evaluated channel capacity and simulation results show throughput almost reaches to the capacity limit.
The document discusses various types of guided transmission media used for data communication, including twisted pair cables, coaxial cables, and fiber optic cables. It explains that twisted pair cables are commonly used to connect devices within buildings and can support speeds up to 1 Gbps. Coaxial cables have better shielding and bandwidth than twisted pair and can transmit signals over longer distances. Fiber optic cables have the highest bandwidth capacity and can support speeds over 70 Gbps. The document also provides details on the construction and properties of coaxial cables.
Bit Error Rate Performance of MIMO Spatial Multiplexing with MPSK Modulation ...ijsrd.com
Wireless communication is one of the most effective areas of technology development of our time. Wireless communications today covers a very wide array of applications. In this, we study the performance of general MIMO system, the general V-BLAST architecture with MPSK Modulation in Rayleigh fading channels. Based on bit error rate, we show the performance of the 2x2 schemes with MPSK Modulation in noisy environment. We also show the bit error rate performance of 2x2, 3x3, 4x4 systems with BPSK modulation. We see that the bit error rate performance of 2x2 systems with QPSK modulation gives us the best performance among other schemes analysed here.
Popular Interview Wireless Question with AnswerVARUN KUMAR
Favourable propagation refers to the orthogonality among vector-valued wireless channels that can maximize total system throughput. It occurs when the interference terms in the channel capacity equation, which involve the product of different channel coefficients, approach zero. Time division duplexing (TDD) is more complex than frequency division duplexing (FDD) due to hardware mismatches across base stations and user equipment for uplink and downlink channels. Channel reciprocity can be achieved through FDD if the uplink and downlink carrier frequencies are nearly equal, but not if they are significantly different.
The document provides information about the syllabus for the course "Information Theory & Error Correction Coding". It discusses the details of the final exam which has two parts worth 50 marks total. Part A is 20 marks and covers topics like channel capacity, coding models, error control types, and linear block codes. Part B is 30 marks and covers additional topics such as linear block codes, convolutional codes, decoding algorithms, and error correction capabilities. It also provides background information on discrete channels, channel capacity theorem, Shannon's channel coding theorem, and the purpose of channel coding. Key concepts discussed include linear codes, block codes, convolutional codes, encoding, decoding, and error detection/correction techniques.
Dear students get fully solved assignments
Send your semester & Specialization name to our mail id :
“ help.mbaassignments@gmail.com ”
or
Call us at : 08263069601
This document provides an outline for a course on communication systems. It covers several key topics:
1) The different types of modulation techniques used in analog and digital communication systems including amplitude, frequency, phase, and pulse modulation.
2) The basic components and functioning of a communication system including information sources, encoding, transmission over a channel, reception and decoding.
3) Characteristics of communication channels such as bandwidth, transmitted power, and how these resources are used efficiently.
4) Differences between analog and digital communication systems and some advantages of digital systems.
This document discusses frequency hop codes for use in multiple access communication systems and multiuser radar/sonar systems. It introduces a new family of frequency hop codes called hyperbolic frequency hop codes, which are constructed based on congruence equations over finite fields. Hyperbolic frequency hop codes have several ideal characteristics. In communication systems, they achieve minimum error probability by ensuring at most one frequency "hit" between any two codes. In radar/sonar systems, they have at most two hits in their auto- and cross-ambiguity functions, providing high range/Doppler resolution while minimizing crosstalk between users. Examples are provided to illustrate address assignment and ambiguity functions using hyperbolic frequency hop codes.
Information theory deals with quantifying and transmitting information. It answers questions about data compression and transmission rates. Shannon showed that transmission rates can exceed the channel capacity as long as they remain below it, and that random processes have an irreducible complexity below which they cannot be compressed. Information theory relates to fields like computer science, probability theory, and communication theory. It had its beginnings in the early 20th century but was developed further after World War II by scientists like Shannon and Wiener.
This document provides an introduction to communication systems. It defines a communication system as a system that transfers information from one place to another. Communication systems have various components including a source that generates a message, a transmitter that converts the message to a signal, a channel that conveys the signal, a receiver that converts the signal back to a message, and a destination. Communication systems can transfer both analog and digital signals and messages. Key aspects of communication systems discussed include modulation, encoding, bandwidth, and the tradeoff between communication resources and system performance.
PERFORMANCE ANALYSIS OF CLIPPED STBC CODED MIMO OFDM SYSTEMIAEME Publication
A combination of Multiple-Input Multiple-Output Spatial Division Multiplexing technology and Orthogonal Frequency Division Multiplexing technique, namely MIMO-OFDM systems, been well-known as a potential technology to provide high speed data transmission and spectrum efficiency to attain throughput of 1 Gbit/sec and beyond improves link reliability for modern wireless communications. The rising development of Internet related contents and demand of multimedia services leads to increasing curiosity to high speed communications. It has been shown that by using MIMO system, it is possible to increase that capacity considerably.
This document discusses channel estimation in space-time trellis coding (STTC) for orthogonal frequency division multiplexing (OFDM) using multiple-input multiple-output (MIMO) systems with 4G networks. It presents the STTC-based MIMO-OFDM system model and describes how STTC achieves transmit diversity. It also discusses channel estimation and different decoding techniques for STTC codes, including minimum mean square error, zero forcing, and maximum likelihood decoding using the Viterbi algorithm. The goal is to achieve a low bit error rate and high signal-to-noise ratio to evaluate system performance.
Channel Estimation In The STTC For OFDM Using MIMO With 4G SystemIOSR Journals
This document summarizes a research paper on channel estimation in space-time trellis coding (STTC) for orthogonal frequency division multiplexing (OFDM) using multiple-input multiple-output (MIMO) technology in 4G wireless systems. It describes how STTC achieves transmit diversity by using specially designed channel codes at the transmitter along with signal processing at the receiver. Simulation results show that STTC for OFDM-MIMO systems can achieve a bit error rate of 10-5 at lower signal-to-noise ratios when using phase-shift keying modulation schemes like 2-PSK, 4-PSK, 8-PSK and 16-PSK. Decoding techniques like minimum mean square error, zero forcing and
The document discusses single carrier transmission using LabVIEW & NI-USRP. It covers several topics:
1. Symbol synchronization using the maximum output energy solution which introduces an adaptive element to find the optimal sampling time that maximizes output power.
2. The role of pseudo-noise sequences in frame synchronization, which provide properties like balance and unpredictability needed for random sequences.
3. The Moose algorithm for carrier frequency offset estimation and correction which exploits least squares to determine the phase shift between training sequences and correct sample phases.
4. The effects of multipath propagation including fading caused by constructive/destructive interference from multiple propagation paths, and intersymbol interference when path delays cause symbol interference.
For ease of analog or digital information transmission and reception, modulation is the foremost important technique. In the present project, we’ll discuss about different modulation scheme in digital mode done by operating a switch/ key by the digital data. As we know, by modifying basic three parameters of the carrier signal, three basic modulation schemes can be obtained; generation and detection of these three modulations are discussed and compared with respect to probability of error or bit error rate (BER).
In a network, one-to-all broadcasting is the process of disseminating messages from a source node to all the nodes existing in the network through successive data transmissions between pairs of nodes. Broadcasting is the most primary communication process in a network. In this paper, we study on multiport wormhole-routed multicomputers where nodes are able to send multiple messages into the network at a
time. We propose efficient broadcast algorithms in multi-port wormhole-routed multicomputers which are characterized by 3D mesh topology. The proposed algorithm Three-Dimension Broadcast Layers (3-DBl) is designed such that can send messages to destinations within two start-up communication phases for each 2-D mesh. The second proposed algorithm Three-Dimension Broadcast Surfaces (3-DBS) is designed such that can send messages to destinations within six start-up communication phases. The performance study in
this paper clearly shows the advantage of the proposed algorithm.
A fast-adaptive-tomlinson-harashima-precoder-for-indoor-wireless-communicationsCemal Ardil
This document summarizes a research paper that proposes a fast adaptive Tomlinson-Harashima precoder for indoor wireless communications. The precoder uses a variable step size least mean squares algorithm to dynamically adjust its parameters according to channel variations over short time spans. It estimates the channel at the end of the uplink frame using system identification, rather than assuming the channel is time-invariant over both uplink and downlink frames as in conventional precoders. Simulation results show the adaptive precoder converges faster than LMS and has similar bit error rate performance to conventional precoders but with lower transmitter complexity.
1. A teoria funcionalista da comunicação analisa os efeitos globais da mídia de massa na sociedade e como ela desempenha funções de integração e manutenção do sistema social.
2. A mídia pode reforçar valores e normas culturais existentes, mas também pode ter efeitos disfuncionais como ameaçar a estrutura social ou causar pânico com notícias alarmantes.
3. A teoria funcionalista substitui a noção de que a mídia causa efeitos diretos no comportamento pelas consequências objetivas de seus pap
O documento descreve as etapas da evolução da comunicação humana desde 15 milhões de anos atrás até a era da informatização atual. Ele destaca importantes marcos como o controle do fogo, desenvolvimento de ferramentas, postura ereta, aumento do cérebro e uso das mãos, além das eras dos símbolos, da fala, da escrita, da impressão e da comunicação de massa.
A teoria da informação estabelece que quanto maior a incerteza de um sistema de signos ou mensagem, maior sua informação. Mensagens organizadas em sistemas complexos tendem ao caos e são entrópicas, enquanto ruídos podem ser fontes de criação ou novas funções para a mídia. O modelo original da teoria da informação é unilateral e pode ser aprimorado para contemplar maior interatividade entre emissor e receptor.
1. A teoria funcionalista da comunicação analisa os efeitos globais da mídia de massa na sociedade e como ela desempenha funções de integração e manutenção do sistema social.
2. A mídia pode reforçar valores e normas culturais existentes, mas também pode ter efeitos disfuncionais como ameaçar a estrutura social ou causar pânico com notícias alarmantes.
3. A teoria funcionalista substitui a noção de que a mídia causa efeitos diretos no comportamento pelas consequências objetivas de sua a
O seminário abordará as transformações do vídeo nas plataformas de compartilhamento e de transmissão ao vivo, como o surgimento de um "audiovisual 2.0" onde o vídeo se constitui em rede através da interface e apropriações amadoras e profissionais. Isso aponta para uma "audiovisualização da cultura" como efeito da contemporaneidade. O seminário será dividido em duas partes, abordando questões constitutivas do vídeo nesse cenário e possibilidades de apropriações.
O seminário abordará as transformações do vídeo nas plataformas de compartilhamento e de transmissão ao vivo, como o surgimento de um "audiovisual 2.0" onde o vídeo se constitui em rede através da interface e apropriações amadoras e profissionais. Isso aponta para uma "audiovisualização da cultura" como efeito da contemporaneidade. Na primeira parte do seminário analisar-se-ão as questões constitutivas do vídeo nesse cenário, e na segunda parte focar-se-ão as possibilidades de apro
O seminário abordará as transformações do vídeo nas plataformas de compartilhamento e de transmissão ao vivo, analisando a emergência de um audiovisual 2.0 e as apropriações e usos amadores e profissionais do vídeo em redes. A primeira parte do seminário discutirá as questões constitutivas do vídeo nesse cenário, enquanto a segunda parte se concentrará nas possibilidades de apropriações.
Este documento discute a morte como um acontecimento fundamental na constituição da cultura humana e como ela se transformou em um acontecimento midiático que agora circula nas redes sociais. Analisa como as postagens no Twitter sobre a morte da cantora Amy Winehouse passaram a fazer parte da narrativa jornalística sobre o evento, desconstruindo e reafirmando sentidos sobre a morte.
O documento discute a convergência midiática, definida como a integração entre meios distintos através da produção de conteúdos em multiplataformas e da reorganização das redações. A convergência também envolve aspectos culturais e econômicos e confere novas possibilidades de narrativa e interação para o jornalismo online.
O documento discute como as linguagens são sistemas de signos organizados através de códigos e como elas são processos auto-organizacionais que geram complexidade. Também aborda como os meios de comunicação ampliam e transformam a percepção humana ao situar pessoas e mensagens em novos planos de existência, fazendo com que a própria percepção seja um fenômeno histórico.
O artigo discute a importância da alfabetização semiótica para a leitura crítica dos textos midiáticos. Propõe exercícios de leitura das estruturas diagramáticas e relacionais desses textos para examinar como os acontecimentos são representados e os argumentos são construídos. Defende que a leitura das linguagens visuais deve ser disseminada para promover o acesso aos bens culturais e cognitivos representados nesses textos.
1. O Paradigma JDBD (Jornalismo Digital em Base de Dados) vem se expandindo continuamente como um modelo teórico para entender o papel das bases de dados no jornalismo contemporâneo.
2. Uma extensão notável é o chamado Jornalismo Guiado por Dados, que enfatiza a existência e o uso de dados públicos disponíveis.
3. Essas novas extensões do JDBD se materializam principalmente em novos modos de narrar, formatos variados de conteúdo e visualizações complexas de inform
O documento discute como diferentes meios de comunicação afetam a cultura e a linguagem. A introdução da imprensa transformou a poesia de Dylan Thomas ao permitir que ele lesse sua poesia no rádio. A cultura americana se desenvolveu principalmente através de livros impressos, mas foi mais impactada pelos meios visuais e sonoros. A forma de comunicação de um meio é tão importante quanto seu conteúdo.
1) O documento discute a convergência midiática sob três frentes: a convergência dos modos de codificação, dos tipos de suporte e dos modos de distribuição.
2) A autora argumenta que a convergência não necessariamente leva a formatos mais criativos e que pode causar a obsolescência de mídias e formas de expressão.
3) Embora a interatividade digital seja uma novidade, a autora afirma que ela não empodera necessariamente os receptores, que permanecem limitados a opções pré-definidas.
O documento discute a necessidade de alfabetização semiótica para a leitura de estruturas relacionais e diagramáticas nos textos de comunicação. Propõe exercícios de leitura estrutural de textos jornalísticos para examinar como os acontecimentos significam e se tornam textos através dos instrumentos das linguagens. Pretende compreender como os textos podem ser lidos considerando a variedade de códigos em sua composição.
Este documento apresenta o plano de aula para uma unidade temática sobre linguagens e convergência da web em um curso de pós-graduação. A unidade abordará conceitos de código, linguagem e suas dinâmicas no ambiente digital, com foco em convergência entre formatos e potencialidades criativas. As aulas tratarão de temas como linguagens auto-organizacionais, transmídia, jornalismo em base de dados, narrativas em redes sociais e exercícios de análise.
O documento discute a convergência midiática, definida como a integração entre meios de comunicação através da produção e distribuição de conteúdos em múltiplas plataformas. A convergência ocorre a nível técnico, cultural e econômico, reconfigurando as narrativas jornalísticas para aproveitar recursos interativos e multimídia da internet. Novas tecnologias permitem novas formas de apresentar informações e ampliar a participação do público.
O documento discute três tópicos principais: 1) o papel do impresso na configuração do pensamento ocidental segundo McLuhan; 2) as distinções entre mídias primária, secundária e terciária segundo Harry Pross; 3) a diferença entre perspectivas tecnológicas e culturais da cultura da convergência.
Este documento discute as três categorias de mídia humana - mídia primária, secundária e terciária. A mídia primária envolve comunicação cara a cara através de linguagem corporal e expressões faciais. A mídia secundária inclui imagens, escrita e outros meios que transportam mensagens sem a necessidade de aparelhos. A mídia terciária usa aparelhos eletrônicos como televisão e internet para tanto emissão quanto recepção de mensagens. O documento levanta preocupações sobre os efeitos de um excesso de mí
Goodbye Windows 11: Make Way for Nitrux Linux 3.5.0!SOFTTECHHUB
As the digital landscape continually evolves, operating systems play a critical role in shaping user experiences and productivity. The launch of Nitrux Linux 3.5.0 marks a significant milestone, offering a robust alternative to traditional systems such as Windows 11. This article delves into the essence of Nitrux Linux 3.5.0, exploring its unique features, advantages, and how it stands as a compelling choice for both casual users and tech enthusiasts.
Dr. Sean Tan, Head of Data Science, Changi Airport Group
Discover how Changi Airport Group (CAG) leverages graph technologies and generative AI to revolutionize their search capabilities. This session delves into the unique search needs of CAG’s diverse passengers and customers, showcasing how graph data structures enhance the accuracy and relevance of AI-generated search results, mitigating the risk of “hallucinations” and improving the overall customer journey.
Sudheer Mechineni, Head of Application Frameworks, Standard Chartered Bank
Discover how Standard Chartered Bank harnessed the power of Neo4j to transform complex data access challenges into a dynamic, scalable graph database solution. This keynote will cover their journey from initial adoption to deploying a fully automated, enterprise-grade causal cluster, highlighting key strategies for modelling organisational changes and ensuring robust disaster recovery. Learn how these innovations have not only enhanced Standard Chartered Bank’s data infrastructure but also positioned them as pioneers in the banking sector’s adoption of graph technology.
Generative AI Deep Dive: Advancing from Proof of Concept to ProductionAggregage
Join Maher Hanafi, VP of Engineering at Betterworks, in this new session where he'll share a practical framework to transform Gen AI prototypes into impactful products! He'll delve into the complexities of data collection and management, model selection and optimization, and ensuring security, scalability, and responsible use.
GraphSummit Singapore | The Art of the Possible with Graph - Q2 2024Neo4j
Neha Bajwa, Vice President of Product Marketing, Neo4j
Join us as we explore breakthrough innovations enabled by interconnected data and AI. Discover firsthand how organizations use relationships in data to uncover contextual insights and solve our most pressing challenges – from optimizing supply chains, detecting fraud, and improving customer experiences to accelerating drug discoveries.
Pushing the limits of ePRTC: 100ns holdover for 100 daysAdtran
At WSTS 2024, Alon Stern explored the topic of parametric holdover and explained how recent research findings can be implemented in real-world PNT networks to achieve 100 nanoseconds of accuracy for up to 100 days.
UiPath Test Automation using UiPath Test Suite series, part 5DianaGray10
Welcome to UiPath Test Automation using UiPath Test Suite series part 5. In this session, we will cover CI/CD with devops.
Topics covered:
CI/CD with in UiPath
End-to-end overview of CI/CD pipeline with Azure devops
Speaker:
Lyndsey Byblow, Test Suite Sales Engineer @ UiPath, Inc.
Maruthi Prithivirajan, Head of ASEAN & IN Solution Architecture, Neo4j
Get an inside look at the latest Neo4j innovations that enable relationship-driven intelligence at scale. Learn more about the newest cloud integrations and product enhancements that make Neo4j an essential choice for developers building apps with interconnected data and generative AI.
Climate Impact of Software Testing at Nordic Testing DaysKari Kakkonen
My slides at Nordic Testing Days 6.6.2024
Climate impact / sustainability of software testing discussed on the talk. ICT and testing must carry their part of global responsibility to help with the climat warming. We can minimize the carbon footprint but we can also have a carbon handprint, a positive impact on the climate. Quality characteristics can be added with sustainability, and then measured continuously. Test environments can be used less, and in smaller scale and on demand. Test techniques can be used in optimizing or minimizing number of tests. Test automation can be used to speed up testing.
“An Outlook of the Ongoing and Future Relationship between Blockchain Technologies and Process-aware Information Systems.” Invited talk at the joint workshop on Blockchain for Information Systems (BC4IS) and Blockchain for Trusted Data Sharing (B4TDS), co-located with with the 36th International Conference on Advanced Information Systems Engineering (CAiSE), 3 June 2024, Limassol, Cyprus.
TrustArc Webinar - 2024 Global Privacy SurveyTrustArc
How does your privacy program stack up against your peers? What challenges are privacy teams tackling and prioritizing in 2024?
In the fifth annual Global Privacy Benchmarks Survey, we asked over 1,800 global privacy professionals and business executives to share their perspectives on the current state of privacy inside and outside of their organizations. This year’s report focused on emerging areas of importance for privacy and compliance professionals, including considerations and implications of Artificial Intelligence (AI) technologies, building brand trust, and different approaches for achieving higher privacy competence scores.
See how organizational priorities and strategic approaches to data security and privacy are evolving around the globe.
This webinar will review:
- The top 10 privacy insights from the fifth annual Global Privacy Benchmarks Survey
- The top challenges for privacy leaders, practitioners, and organizations in 2024
- Key themes to consider in developing and maintaining your privacy program
Building RAG with self-deployed Milvus vector database and Snowpark Container...Zilliz
This talk will give hands-on advice on building RAG applications with an open-source Milvus database deployed as a docker container. We will also introduce the integration of Milvus with Snowpark Container Services.
20 Comprehensive Checklist of Designing and Developing a WebsitePixlogix Infotech
Dive into the world of Website Designing and Developing with Pixlogix! Looking to create a stunning online presence? Look no further! Our comprehensive checklist covers everything you need to know to craft a website that stands out. From user-friendly design to seamless functionality, we've got you covered. Don't miss out on this invaluable resource! Check out our checklist now at Pixlogix and start your journey towards a captivating online presence today.
GraphSummit Singapore | The Future of Agility: Supercharging Digital Transfor...Neo4j
Leonard Jayamohan, Partner & Generative AI Lead, Deloitte
This keynote will reveal how Deloitte leverages Neo4j’s graph power for groundbreaking digital twin solutions, achieving a staggering 100x performance boost. Discover the essential role knowledge graphs play in successful generative AI implementations. Plus, get an exclusive look at an innovative Neo4j + Generative AI solution Deloitte is developing in-house.
Enchancing adoption of Open Source Libraries. A case study on Albumentations.AIVladimir Iglovikov, Ph.D.
Presented by Vladimir Iglovikov:
- https://www.linkedin.com/in/iglovikov/
- https://x.com/viglovikov
- https://www.instagram.com/ternaus/
This presentation delves into the journey of Albumentations.ai, a highly successful open-source library for data augmentation.
Created out of a necessity for superior performance in Kaggle competitions, Albumentations has grown to become a widely used tool among data scientists and machine learning practitioners.
This case study covers various aspects, including:
People: The contributors and community that have supported Albumentations.
Metrics: The success indicators such as downloads, daily active users, GitHub stars, and financial contributions.
Challenges: The hurdles in monetizing open-source projects and measuring user engagement.
Development Practices: Best practices for creating, maintaining, and scaling open-source libraries, including code hygiene, CI/CD, and fast iteration.
Community Building: Strategies for making adoption easy, iterating quickly, and fostering a vibrant, engaged community.
Marketing: Both online and offline marketing tactics, focusing on real, impactful interactions and collaborations.
Mental Health: Maintaining balance and not feeling pressured by user demands.
Key insights include the importance of automation, making the adoption process seamless, and leveraging offline interactions for marketing. The presentation also emphasizes the need for continuous small improvements and building a friendly, inclusive community that contributes to the project's growth.
Vladimir Iglovikov brings his extensive experience as a Kaggle Grandmaster, ex-Staff ML Engineer at Lyft, sharing valuable lessons and practical advice for anyone looking to enhance the adoption of their open-source projects.
Explore more about Albumentations and join the community at:
GitHub: https://github.com/albumentations-team/albumentations
Website: https://albumentations.ai/
LinkedIn: https://www.linkedin.com/company/100504475
Twitter: https://x.com/albumentations
In the rapidly evolving landscape of technologies, XML continues to play a vital role in structuring, storing, and transporting data across diverse systems. The recent advancements in artificial intelligence (AI) present new methodologies for enhancing XML development workflows, introducing efficiency, automation, and intelligent capabilities. This presentation will outline the scope and perspective of utilizing AI in XML development. The potential benefits and the possible pitfalls will be highlighted, providing a balanced view of the subject.
We will explore the capabilities of AI in understanding XML markup languages and autonomously creating structured XML content. Additionally, we will examine the capacity of AI to enrich plain text with appropriate XML markup. Practical examples and methodological guidelines will be provided to elucidate how AI can be effectively prompted to interpret and generate accurate XML markup.
Further emphasis will be placed on the role of AI in developing XSLT, or schemas such as XSD and Schematron. We will address the techniques and strategies adopted to create prompts for generating code, explaining code, or refactoring the code, and the results achieved.
The discussion will extend to how AI can be used to transform XML content. In particular, the focus will be on the use of AI XPath extension functions in XSLT, Schematron, Schematron Quick Fixes, or for XML content refactoring.
The presentation aims to deliver a comprehensive overview of AI usage in XML development, providing attendees with the necessary knowledge to make informed decisions. Whether you’re at the early stages of adopting AI or considering integrating it in advanced XML development, this presentation will cover all levels of expertise.
By highlighting the potential advantages and challenges of integrating AI with XML development tools and languages, the presentation seeks to inspire thoughtful conversation around the future of XML development. We’ll not only delve into the technical aspects of AI-powered XML development but also discuss practical implications and possible future directions.
1. Reprinted with corrections from The Bell System Technical Journal,
Vol. 27, pp. 379–423, 623–656, July, October, 1948.
A Mathematical Theory of Communication
By C. E. SHANNON
T
I NTRODUCTION
HE recent development of various methods of modulation such as PCM and PPM which exchange
bandwidth for signal-to-noise ratio has intensified the interest in a general theory of communication. A
basis for such a theory is contained in the important papers of Nyquist 1 and Hartley2 on this subject. In the
present paper we will extend the theory to include a number of new factors, in particular the effect of noise
in the channel, and the savings possible due to the statistical structure of the original message and due to the
nature of the final destination of the information.
The fundamental problem of communication is that of reproducing at one point either exactly or ap-
proximately a message selected at another point. Frequently the messages have meaning; that is they refer
to or are correlated according to some system with certain physical or conceptual entities. These semantic
aspects of communication are irrelevant to the engineering problem. The significant aspect is that the actual
message is one selected from a set of possible messages. The system must be designed to operate for each
possible selection, not just the one which will actually be chosen since this is unknown at the time of design.
If the number of messages in the set is finite then this number or any monotonic function of this number
can be regarded as a measure of the information produced when one message is chosen from the set, all
choices being equally likely. As was pointed out by Hartley the most natural choice is the logarithmic
function. Although this definition must be generalized considerably when we consider the influence of the
statistics of the message and when we have a continuous range of messages, we will in all cases use an
essentially logarithmic measure.
The logarithmic measure is more convenient for various reasons:
1. It is practically more useful. Parameters of engineering importance such as time, bandwidth, number
of relays, etc., tend to vary linearly with the logarithm of the number of possibilities. For example,
adding one relay to a group doubles the number of possible states of the relays. It adds 1 to the base 2
logarithm of this number. Doubling the time roughly squares the number of possible messages, or
doubles the logarithm, etc.
2. It is nearer to our intuitive feeling as to the proper measure. This is closely related to (1) since we in-
tuitively measures entities by linear comparison with common standards. One feels, for example, that
two punched cards should have twice the capacity of one for information storage, and two identical
channels twice the capacity of one for transmitting information.
3. It is mathematically more suitable. Many of the limiting operations are simple in terms of the loga-
rithm but would require clumsy restatement in terms of the number of possibilities.
The choice of a logarithmic base corresponds to the choice of a unit for measuring information. If the
base 2 is used the resulting units may be called binary digits, or more briefly bits, a word suggested by
J. W. Tukey. A device with two stable positions, such as a relay or a flip-flop circuit, can store one bit of
information. N such devices can store N bits, since the total number of possible states is 2N and log2 2N = N.
If the base 10 is used the units may be called decimal digits. Since
=
log2 M = log10 M log10 2
:
= 3 32 log10 M ;
1 Nyquist, H., “Certain Factors Affecting Telegraph Speed,” Bell System Technical Journal, April 1924, p. 324; “Certain Topics in
Telegraph Transmission Theory,” A.I.E.E. Trans., v. 47, April 1928, p. 617.
2 Hartley, R. V. L., “Transmission of Information,” Bell System Technical Journal, July 1928, p. 535.
1
2. INFORMATION
SOURCE TRANSMITTER RECEIVER DESTINATION
SIGNAL RECEIVED
SIGNAL
MESSAGE MESSAGE
NOISE
SOURCE
Fig. 1 — Schematic diagram of a general communication system.
a decimal digit is about 3 1 bits. A digit wheel on a desk computing machine has ten stable positions and
3
therefore has a storage capacity of one decimal digit. In analytical work where integration and differentiation
are involved the base e is sometimes useful. The resulting units of information will be called natural units.
Change from the base a to base b merely requires multiplication by logb a.
By a communication system we will mean a system of the type indicated schematically in Fig. 1. It
consists of essentially five parts:
1. An information source which produces a message or sequence of messages to be communicated to the
receiving terminal. The message may be of various types: (a) A sequence of letters as in a telegraph
of teletype system; (b) A single function of time f t as in radio or telephony; (c) A function of
time and other variables as in black and white television — here the message may be thought of as a
;; ;
function f x y t of two space coordinates and time, the light intensity at point x y and time t on a
pickup tube plate; (d) Two or more functions of time, say f t , gt , ht — this is the case in “three-
dimensional” sound transmission or if the system is intended to service several individual channels in
multiplex; (e) Several functions of several variables — in color television the message consists of three
;; ;; ;;
functions f x y t , gx y t , hx y t defined in a three-dimensional continuum — we may also think
of these three functions as components of a vector field defined in the region — similarly, several
black and white television sources would produce “messages” consisting of a number of functions
of three variables; (f) Various combinations also occur, for example in television with an associated
audio channel.
2. A transmitter which operates on the message in some way to produce a signal suitable for trans-
mission over the channel. In telephony this operation consists merely of changing sound pressure
into a proportional electrical current. In telegraphy we have an encoding operation which produces
a sequence of dots, dashes and spaces on the channel corresponding to the message. In a multiplex
PCM system the different speech functions must be sampled, compressed, quantized and encoded,
and finally interleaved properly to construct the signal. Vocoder systems, television and frequency
modulation are other examples of complex operations applied to the message to obtain the signal.
3. The channel is merely the medium used to transmit the signal from transmitter to receiver. It may be
a pair of wires, a coaxial cable, a band of radio frequencies, a beam of light, etc.
4. The receiver ordinarily performs the inverse operation of that done by the transmitter, reconstructing
the message from the signal.
5. The destination is the person (or thing) for whom the message is intended.
We wish to consider certain general problems involving communication systems. To do this it is first
necessary to represent the various elements involved as mathematical entities, suitably idealized from their
2
3. physical counterparts. We may roughly classify communication systems into three main categories: discrete,
continuous and mixed. By a discrete system we will mean one in which both the message and the signal
are a sequence of discrete symbols. A typical case is telegraphy where the message is a sequence of letters
and the signal a sequence of dots, dashes and spaces. A continuous system is one in which the message and
signal are both treated as continuous functions, e.g., radio or television. A mixed system is one in which
both discrete and continuous variables appear, e.g., PCM transmission of speech.
We first consider the discrete case. This case has applications not only in communication theory, but
also in the theory of computing machines, the design of telephone exchanges and other fields. In addition
the discrete case forms a foundation for the continuous and mixed cases which will be treated in the second
half of the paper.
PART I: DISCRETE NOISELESS SYSTEMS
1. T HE D ISCRETE N OISELESS C HANNEL
Teletype and telegraphy are two simple examples of a discrete channel for transmitting information. Gen-
erally, a discrete channel will mean a system whereby a sequence of choices from a finite set of elementary
symbols S1 ;:::;
Sn can be transmitted from one point to another. Each of the symbols Si is assumed to have
a certain duration in time ti seconds (not necessarily the same for different Si , for example the dots and
dashes in telegraphy). It is not required that all possible sequences of the Si be capable of transmission on
the system; certain sequences only may be allowed. These will be possible signals for the channel. Thus
in telegraphy suppose the symbols are: (1) A dot, consisting of line closure for a unit of time and then line
open for a unit of time; (2) A dash, consisting of three time units of closure and one unit open; (3) A letter
space consisting of, say, three units of line open; (4) A word space of six units of line open. We might place
the restriction on allowable sequences that no spaces follow each other (for if two letter spaces are adjacent,
it is identical with a word space). The question we now consider is how one can measure the capacity of
such a channel to transmit information.
In the teletype case where all symbols are of the same duration, and any sequence of the 32 symbols
is allowed the answer is easy. Each symbol represents five bits of information. If the system transmits n
symbols per second it is natural to say that the channel has a capacity of 5n bits per second. This does not
mean that the teletype channel will always be transmitting information at this rate — this is the maximum
possible rate and whether or not the actual rate reaches this maximum depends on the source of information
which feeds the channel, as will appear later.
In the more general case with different lengths of symbols and constraints on the allowed sequences, we
make the following definition:
Definition: The capacity C of a discrete channel is given by
logN T
C = Lim
T !∞ T
where N T is the number of allowed signals of duration T .
It is easily seen that in the teletype case this reduces to the previous result. It can be shown that the limit
in question will exist as a finite number in most cases of interest. Suppose all sequences of the symbols
S1;:::; Sn are allowed and these symbols have durations t1 ;:::;
tn . What is the channel capacity? If N t
represents the number of sequences of duration t we have
N t = N t , t1 + N t , t2 + + N t , tn :
The total number is equal to the sum of the numbers of sequences ending in S1 S2 ; ;:::;
Sn and these are
; ;:::;
N t , t1 N t , t2 N t , tn , respectively. According to a well-known result in finite differences, N t
t
is then asymptotic for large t to X0 where X0 is the largest real solution of the characteristic equation:
X ,t1 + X ,t2 + + X ,tn =1
3
4. and therefore
C = logX0 :
In case there are restrictions on allowed sequences we may still often obtain a difference equation of this
type and find C from the characteristic equation. In the telegraphy case mentioned above
N t = N t , 2 + N t , 4 + N t , 5 + N t , 7 + N t , 8 + N t , 10
as we see by counting sequences of symbols according to the last or next to the last symbol occurring.
Hence C is , log 0 where 0 is the positive root of 1 = 2 + 4 + 5 + 7 + 8 + 10 . Solving this we find
:
C = 0 539.
A very general type of restriction which may be placed on allowed sequences is the following: We
; ;:::;
imagine a number of possible states a1 a2 am . For each state only certain symbols from the set S1 ;:::;
Sn
can be transmitted (different subsets for the different states). When one of these has been transmitted the
state changes to a new state depending both on the old state and the particular symbol transmitted. The
telegraph case is a simple example of this. There are two states depending on whether or not a space was
the last symbol transmitted. If so, then only a dot or a dash can be sent next and the state always changes.
If not, any symbol can be transmitted and the state changes if a space is sent, otherwise it remains the same.
The conditions can be indicated in a linear graph as shown in Fig. 2. The junction points correspond to the
DASH
DOT DOT
LETTER SPACE DASH
WORD SPACE
Fig. 2 — Graphical representation of the constraints on telegraph symbols.
states and the lines indicate the symbols possible in a state and the resulting state. In Appendix 1 it is shown
that if the conditions on allowed sequences can be described in this form C will exist and can be calculated
in accordance with the following result:
s
Theorem 1: Let bi j be the duration of the sth symbol which is allowable in state i and leads to state j.
Then the channel capacity C is equal to logW where W is the largest real root of the determinant equation:
∑ W ,bi j ,
s
ij = 0
s
where i j = 1 if i = j and is zero otherwise.
For example, in the telegraph case (Fig. 2) the determinant is:
,1 W ,2 + W ,4
:
W ,3 + W ,6 ,
W ,2 + W ,4 1
=0
On expansion this leads to the equation given above for this case.
2. T HE D ISCRETE S OURCE OF I NFORMATION
We have seen that under very general conditions the logarithm of the number of possible signals in a discrete
channel increases linearly with time. The capacity to transmit information can be specified by giving this
rate of increase, the number of bits per second required to specify the particular signal used.
We now consider the information source. How is an information source to be described mathematically,
and how much information in bits per second is produced in a given source? The main point at issue is the
effect of statistical knowledge about the source in reducing the required capacity of the channel, by the use
4
5. of proper encoding of the information. In telegraphy, for example, the messages to be transmitted consist of
sequences of letters. These sequences, however, are not completely random. In general, they form sentences
and have the statistical structure of, say, English. The letter E occurs more frequently than Q, the sequence
TH more frequently than XP, etc. The existence of this structure allows one to make a saving in time (or
channel capacity) by properly encoding the message sequences into signal sequences. This is already done
to a limited extent in telegraphy by using the shortest channel symbol, a dot, for the most common English
letter E; while the infrequent letters, Q, X, Z are represented by longer sequences of dots and dashes. This
idea is carried still further in certain commercial codes where common words and phrases are represented
by four- or five-letter code groups with a considerable saving in average time. The standardized greeting
and anniversary telegrams now in use extend this to the point of encoding a sentence or two into a relatively
short sequence of numbers.
We can think of a discrete source as generating the message, symbol by symbol. It will choose succes-
sive symbols according to certain probabilities depending, in general, on preceding choices as well as the
particular symbols in question. A physical system, or a mathematical model of a system which produces
such a sequence of symbols governed by a set of probabilities, is known as a stochastic process.3 We may
consider a discrete source, therefore, to be represented by a stochastic process. Conversely, any stochastic
process which produces a discrete sequence of symbols chosen from a finite set may be considered a discrete
source. This will include such cases as:
1. Natural written languages such as English, German, Chinese.
2. Continuous information sources that have been rendered discrete by some quantizing process. For
example, the quantized speech from a PCM transmitter, or a quantized television signal.
3. Mathematical cases where we merely define abstractly a stochastic process which generates a se-
quence of symbols. The following are examples of this last type of source.
(A) Suppose we have five letters A, B, C, D, E which are chosen each with probability .2, successive
choices being independent. This would lead to a sequence of which the following is a typical
example.
BDCBCECCCADCBDDAAECEEA
A B B D A E E C A C E E B A E E C B C E A D.
This was constructed with the use of a table of random numbers.4
(B) Using the same five letters let the probabilities be .4, .1, .2, .2, .1, respectively, with successive
choices independent. A typical message from this source is then:
AAACDCBDCEAADADACEDA
E A D C A B E D A D D C E C A A A A A D.
(C) A more complicated structure is obtained if successive symbols are not chosen independently
but their probabilities depend on preceding letters. In the simplest case of this type a choice
depends only on the preceding letter and not on ones before that. The statistical structure can
then be described by a set of transition probabilities pi j, the probability that letter i is followed
by letter j. The indices i and j range over all the possible symbols. A second equivalent way of
;
specifying the structure is to give the “digram” probabilities pi j, i.e., the relative frequency of
the digram i j. The letter frequencies pi, (the probability of letter i), the transition probabilities
3 See, for example, S. Chandrasekhar, “Stochastic Problems in Physics and Astronomy,” Reviews of Modern Physics, v. 15, No. 1,
January 1943, p. 1.
4 Kendall and Smith, Tables of Random Sampling Numbers, Cambridge, 1939.
5
6. ;
pi j and the digram probabilities pi j are related by the following formulas:
; ;
pi = ∑ pi j = ∑ p j i = ∑ p j p j i
j j j
;
pi j = pi pi j
∑ pi j = ∑ pi = ∑ pi; j = 1:
j i i; j
As a specific example suppose there are three letters A, B, C with the probability tables:
pi j
j i pi ;
pi j j
A B C A B C
9
A 0 4
5
1
5 A 27 A 0 4
15
1
15
16
i B 1 2
2
1
0 B 27 i B 8
27
8
27 0
2
2
2
C 1 5 1
10 C 27 C 1
27
4
135
1
135
A typical message from this source is the following:
ABBABABABABABABBBABBBBBABABABABABBBACACAB
B A B B B B A B B A B A C B B B A B A.
The next increase in complexity would involve trigram frequencies but no more. The choice of
a letter would depend on the preceding two letters but not on the message before that point. A
;;
set of trigram frequencies pi j k or equivalently a set of transition probabilities pi j k would
be required. Continuing in this way one obtains successively more complicated stochastic pro-
cesses. In the general n-gram case a set of n-gram probabilities pi1 i2 ; ;:::;
in or of transition
probabilities pi1 ;i2 ;:::;in,1 in is required to specify the statistical structure.
(D) Stochastic processes can also be defined which produce a text consisting of a sequence of
“words.” Suppose there are five letters A, B, C, D, E and 16 “words” in the language with
associated probabilities:
.10 A .16 BEBE .11 CABED .04 DEB
.04 ADEB .04 BED .05 CEED .15 DEED
.05 ADEE .02 BEED .08 DAB .01 EAB
.01 BADD .05 CA .04 DAD .05 EE
Suppose successive “words” are chosen independently and are separated by a space. A typical
message might be:
DAB EE A BEBE DEED DEB ADEE ADEE EE DEB BEBE BEBE BEBE ADEE BED DEED
DEED CEED ADEE A DEED DEED BEBE CABED BEBE BED DAB DEED ADEB.
If all the words are of finite length this process is equivalent to one of the preceding type, but
the description may be simpler in terms of the word structure and probabilities. We may also
generalize here and introduce transition probabilities between words, etc.
These artificial languages are useful in constructing simple problems and examples to illustrate vari-
ous possibilities. We can also approximate to a natural language by means of a series of simple artificial
languages. The zero-order approximation is obtained by choosing all letters with the same probability and
independently. The first-order approximation is obtained by choosing successive letters independently but
each letter having the same probability that it has in the natural language.5 Thus, in the first-order ap-
proximation to English, E is chosen with probability .12 (its frequency in normal English) and W with
probability .02, but there is no influence between adjacent letters and no tendency to form the preferred
5 Letter, digram and trigram frequencies are given in Secret and Urgent by Fletcher Pratt, Blue Ribbon Books, 1939. Word frequen-
cies are tabulated in Relative Frequency of English Speech Sounds, G. Dewey, Harvard University Press, 1923.
6
7. digrams such as TH, ED, etc. In the second-order approximation, digram structure is introduced. After a
letter is chosen, the next one is chosen in accordance with the frequencies with which the various letters
follow the first one. This requires a table of digram frequencies pi j. In the third-order approximation,
trigram structure is introduced. Each letter is chosen with probabilities which depend on the preceding two
letters.
3. T HE S ERIES OF A PPROXIMATIONS TO E NGLISH
To give a visual idea of how this series of processes approaches a language, typical sequences in the approx-
imations to English have been constructed and are given below. In all cases we have assumed a 27-symbol
“alphabet,” the 26 letters and a space.
1. Zero-order approximation (symbols independent and equiprobable).
XFOML RXKHRJFFJUJ ZLPWCFWKCYJ FFJEYVKCQSGHYD QPAAMKBZAACIBZL-
HJQD.
2. First-order approximation (symbols independent but with frequencies of English text).
OCRO HLI RGWR NMIELWIS EU LL NBNESEBYA TH EEI ALHENHTTPA OOBTTVA
NAH BRL.
3. Second-order approximation (digram structure as in English).
ON IE ANTSOUTINYS ARE T INCTORE ST BE S DEAMY ACHIN D ILONASIVE TU-
COOWE AT TEASONARE FUSO TIZIN ANDY TOBE SEACE CTISBE.
4. Third-order approximation (trigram structure as in English).
IN NO IST LAT WHEY CRATICT FROURE BIRS GROCID PONDENOME OF DEMONS-
TURES OF THE REPTAGIN IS REGOACTIONA OF CRE.
:::
5. First-order word approximation. Rather than continue with tetragram, , n-gram structure it is easier
and better to jump at this point to word units. Here words are chosen independently but with their
appropriate frequencies.
REPRESENTING AND SPEEDILY IS AN GOOD APT OR COME CAN DIFFERENT NAT-
URAL HERE HE THE A IN CAME THE TO OF TO EXPERT GRAY COME TO FURNISHES
THE LINE MESSAGE HAD BE THESE.
6. Second-order word approximation. The word transition probabilities are correct but no further struc-
ture is included.
THE HEAD AND IN FRONTAL ATTACK ON AN ENGLISH WRITER THAT THE CHAR-
ACTER OF THIS POINT IS THEREFORE ANOTHER METHOD FOR THE LETTERS THAT
THE TIME OF WHO EVER TOLD THE PROBLEM FOR AN UNEXPECTED.
The resemblance to ordinary English text increases quite noticeably at each of the above steps. Note that
these samples have reasonably good structure out to about twice the range that is taken into account in their
construction. Thus in (3) the statistical process insures reasonable text for two-letter sequences, but four-
letter sequences from the sample can usually be fitted into good sentences. In (6) sequences of four or more
words can easily be placed in sentences without unusual or strained constructions. The particular sequence
of ten words “attack on an English writer that the character of this” is not at all unreasonable. It appears then
that a sufficiently complex stochastic process will give a satisfactory representation of a discrete source.
The first two samples were constructed by the use of a book of random numbers in conjunction with
(for example 2) a table of letter frequencies. This method might have been continued for (3), (4) and (5),
since digram, trigram and word frequency tables are available, but a simpler equivalent method was used.
7
8. To construct (3) for example, one opens a book at random and selects a letter at random on the page. This
letter is recorded. The book is then opened to another page and one reads until this letter is encountered.
The succeeding letter is then recorded. Turning to another page this second letter is searched for and the
succeeding letter recorded, etc. A similar process was used for (4), (5) and (6). It would be interesting if
further approximations could be constructed, but the labor involved becomes enormous at the next stage.
4. G RAPHICAL R EPRESENTATION OF A M ARKOFF P ROCESS
Stochastic processes of the type described above are known mathematically as discrete Markoff processes
and have been extensively studied in the literature.6 The general case can be described as follows: There
exist a finite number of possible “states” of a system; S1 S2 ; ;:::;
Sn . In addition there is a set of transition
probabilities; pi j the probability that if the system is in state Si it will next go to state S j . To make this
Markoff process into an information source we need only assume that a letter is produced for each transition
from one state to another. The states will correspond to the “residue of influence” from preceding letters.
The situation can be represented graphically as shown in Figs. 3, 4 and 5. The “states” are the junction
A
.1
.4 B
E .2
.1 C
D .2
Fig. 3 — A graph corresponding to the source in example B.
points in the graph and the probabilities and letters produced for a transition are given beside the correspond-
ing line. Figure 3 is for the example B in Section 2, while Fig. 4 corresponds to the example C. In Fig. 3
C B
A
.8
.2
A
.5
.5
B
C B .4 .5
.1
Fig. 4 — A graph corresponding to the source in example C.
there is only one state since successive letters are independent. In Fig. 4 there are as many states as letters.
If a trigram example were constructed there would be at most n2 states corresponding to the possible pairs
of letters preceding the one being chosen. Figure 5 is a graph for the case of word structure in example D.
Here S corresponds to the “space” symbol.
5. E RGODIC AND M IXED S OURCES
As we have indicated above a discrete source for our purposes can be considered to be represented by a
Markoff process. Among the possible discrete Markoff processes there is a group with special properties
of significance in communication theory. This special class consists of the “ergodic” processes and we
shall call the corresponding sources ergodic sources. Although a rigorous definition of an ergodic process is
somewhat involved, the general idea is simple. In an ergodic process every sequence produced by the process
6 For a detailed treatment see M. Fr´ chet, M´ thode des fonctions arbitraires. Th´ orie des ev´ nements en chaˆne dans le cas d’un
e e e ´ e ı
nombre fini d’´ tats possibles. Paris, Gauthier-Villars, 1938.
e
8
9. is the same in statistical properties. Thus the letter frequencies, digram frequencies, etc., obtained from
particular sequences, will, as the lengths of the sequences increase, approach definite limits independent
of the particular sequence. Actually this is not true of every sequence but the set for which it is false has
probability zero. Roughly the ergodic property means statistical homogeneity.
All the examples of artificial languages given above are ergodic. This property is related to the structure
of the corresponding graph. If the graph has the following two properties 7 the corresponding process will
be ergodic:
1. The graph does not consist of two isolated parts A and B such that it is impossible to go from junction
points in part A to junction points in part B along lines of the graph in the direction of arrows and also
impossible to go from junctions in part B to junctions in part A.
2. A closed series of lines in the graph with all arrows on the lines pointing in the same orientation will
be called a “circuit.” The “length” of a circuit is the number of lines in it. Thus in Fig. 5 series BEBES
is a circuit of length 5. The second property required is that the greatest common divisor of the lengths
of all circuits in the graph be one.
D E
B
E
S A B
E E
D
A
B D E
S B E D
C A E E
B B
D E
A D
B
E
E
A
S
Fig. 5 — A graph corresponding to the source in example D.
If the first condition is satisfied but the second one violated by having the greatest common divisor equal
to d 1, the sequences have a certain type of periodic structure. The various sequences fall into d different
classes which are statistically the same apart from a shift of the origin (i.e., which letter in the sequence is
called letter 1). By a shift of from 0 up to d , 1 any sequence can be made statistically equivalent to any
other. A simple example with d = 2 is the following: There are three possible letters a b c. Letter a is ;;
followed with either b or c with probabilities 1 and 2 respectively. Either b or c is always followed by letter
3 3
a. Thus a typical sequence is
abacacacabacababacac :
This type of situation is not of much importance for our work.
If the first condition is violated the graph may be separated into a set of subgraphs each of which satisfies
the first condition. We will assume that the second condition is also satisfied for each subgraph. We have in
this case what may be called a “mixed” source made up of a number of pure components. The components
correspond to the various subgraphs. If L1 , L2 , L3 ;:::
are the component sources we may write
L = p1 L1 + p2L2 + p3 L3 +
7 These are restatements in terms of the graph of conditions given in Fr´chet.
e
9
10. where pi is the probability of the component source Li .
Physically the situation represented is this: There are several different sources L1 , L2 , L3 ;:::
which are
each of homogeneous statistical structure (i.e., they are ergodic). We do not know a priori which is to be
used, but once the sequence starts in a given pure component Li , it continues indefinitely according to the
statistical structure of that component.
As an example one may take two of the processes defined above and assume p1 = 2 and p2 = 8. A: :
sequence from the mixed source
:
L = 2L1 + 8L2 :
would be obtained by choosing first L1 or L2 with probabilities .2 and .8 and after this choice generating a
sequence from whichever was chosen.
Except when the contrary is stated we shall assume a source to be ergodic. This assumption enables one
to identify averages along a sequence with averages over the ensemble of possible sequences (the probability
of a discrepancy being zero). For example the relative frequency of the letter A in a particular infinite
sequence will be, with probability one, equal to its relative frequency in the ensemble of sequences.
If Pi is the probability of state i and pi j the transition probability to state j, then for the process to be
stationary it is clear that the Pi must satisfy equilibrium conditions:
Pj = ∑ Pi pi j :
i
In the ergodic case it can be shown that with any starting conditions the probabilities Pj N of being in state
j after N symbols, approach the equilibrium values as N ! ∞.
6. C HOICE , U NCERTAINTY AND E NTROPY
We have represented a discrete information source as a Markoff process. Can we define a quantity which
will measure, in some sense, how much information is “produced” by such a process, or better, at what rate
information is produced?
Suppose we have a set of possible events whose probabilities of occurrence are p1 p2 ; ;:::;
pn . These
probabilities are known but that is all we know concerning which event will occur. Can we find a measure
of how much “choice” is involved in the selection of the event or of how uncertain we are of the outcome?
; ;:::;
If there is such a measure, say H p1 p2 pn , it is reasonable to require of it the following properties:
1. H should be continuous in the pi .
2. If all the pi are equal, pi = 1 , then H should be a monotonic increasing function of n. With equally
n
likely events there is more choice, or uncertainty, when there are more possible events.
3. If a choice be broken down into two successive choices, the original H should be the weighted sum
of the individual values of H. The meaning of this is illustrated in Fig. 6. At the left we have three
1 2 1 2
1 2
1 3
2 3
1 3
1 2
1 6
1 3 1 6
Fig. 6— Decomposition of a choice from three possibilities.
possibilities p1 = 1 , p2 = 1 , p3 = 1 . On the right we first choose between two possibilities each with
2 3 6
probability 1 , and if the second occurs make another choice with probabilities 2 , 1 . The final results
2 3 3
have the same probabilities as before. We require, in this special case, that
H 1
2 ; 1 ; 1 = H 1 ; 1 + 1 H 2 ; 1 :
3 6 2 2 2 3 3
1
The coefficient 2 is because this second choice only occurs half the time.
10
11. In Appendix 2, the following result is established:
Theorem 2: The only H satisfying the three above assumptions is of the form:
n
H = ,K ∑ pi log pi
i=1
where K is a positive constant.
This theorem, and the assumptions required for its proof, are in no way necessary for the present theory.
It is given chiefly to lend a certain plausibility to some of our later definitions. The real justification of these
definitions, however, will reside in their implications.
Quantities of the form H = ,∑ pi log pi (the constant K merely amounts to a choice of a unit of measure)
play a central role in information theory as measures of information, choice and uncertainty. The form of H
will be recognized as that of entropy as defined in certain formulations of statistical mechanics8 where pi is
the probability of a system being in cell i of its phase space. H is then, for example, the H in Boltzmann’s
famous H theorem. We shall call H = , ∑ pi log pi the entropy of the set of probabilities p1 ;:::;
pn . If x is a
chance variable we will write H x for its entropy; thus x is not an argument of a function but a label for a
number, to differentiate it from H y say, the entropy of the chance variable y.
The entropy in the case of two possibilities with probabilities p and q = 1 , p, namely
H = , p log p + q logq
is plotted in Fig. 7 as a function of p.
1.0
.9
.8
.7
H
BITS .6
.5
.4
.3
.2
.1
0
0 .1 .2 .3 .4 .5 .6 .7 .8 .9 1.0
p
Fig. 7 — Entropy in the case of two possibilities with probabilities p and 1 , p.
The quantity H has a number of interesting properties which further substantiate it as a reasonable
measure of choice or information.
1. H = 0 if and only if all the pi but one are zero, this one having the value unity. Thus only when we
are certain of the outcome does H vanish. Otherwise H is positive.
2. For a given n, H is a maximum and equal to logn when all the pi are equal (i.e., 1 ). This is also
n
intuitively the most uncertain situation.
8 See, for example, R. C. Tolman, Principles of Statistical Mechanics, Oxford, Clarendon, 1938.
11
12. 3. Suppose there are two events, x and y, in question with m possibilities for the first and n for the second.
;
Let pi j be the probability of the joint occurrence of i for the first and j for the second. The entropy of the
joint event is
;
H x y = , ∑ pi j log pi j ; ;
i; j
while
H x = , ∑ pi j log ∑ pi j ; ;
i; j j
H y = , ∑ pi j log ∑ pi j ; ; :
i; j i
It is easily shown that
;
H x y H x + H y
;
with equality only if the events are independent (i.e., pi j = pi p j). The uncertainty of a joint event is
less than or equal to the sum of the individual uncertainties.
4. Any change toward equalization of the probabilities p1 p2 ; ;:::;
pn increases H. Thus if p1 p2 and
we increase p1 , decreasing p2 an equal amount so that p1 and p2 are more nearly equal, then H increases.
More generally, if we perform any “averaging” operation on the pi of the form
p0 = ∑ ai j p j
i
j
where ∑i ai j = ∑ j ai j = 1, and all ai j 0, then H increases (except in the special case where this transfor-
mation amounts to no more than a permutation of the p j with H of course remaining the same).
5. Suppose there are two chance events x and y as in 3, not necessarily independent. For any particular
value i that x can assume there is a conditional probability pi j that y has the value j. This is given by
;
; :
pi j
pi j =
∑ j pi j
We define the conditional entropy of y, Hx y as the average of the entropy of y for each value of x, weighted
according to the probability of getting that particular x. That is
Hx y = , ∑ pi j log pi j ; :
i; j
This quantity measures how uncertain we are of y on the average when we know x. Substituting the value of
pi j we obtain
; ;
Hx y = , ∑ pi j log pi j + ∑ pi j log ∑ pi j ; ;
i; j i; j j
= H x ; y , H x
or
;
H x y = H x + Hx y :
;
The uncertainty (or entropy) of the joint event x y is the uncertainty of x plus the uncertainty of y when x is
known.
6. From 3 and 5 we have
H x + H y H x y = H x + Hx y ; :
Hence
H y Hx y :
The uncertainty of y is never increased by knowledge of x. It will be decreased unless x and y are independent
events, in which case it is not changed.
12
13. 7. T HE E NTROPY OF AN I NFORMATION S OURCE
Consider a discrete source of the finite state type considered above. For each possible state i there will be a
set of probabilities pi j of producing the various possible symbols j. Thus there is an entropy Hi for each
state. The entropy of the source will be defined as the average of these Hi weighted in accordance with the
probability of occurrence of the states in question:
H = ∑ Pi Hi
i
= , ∑ Pi pi j log pi j :
i; j
This is the entropy of the source per symbol of text. If the Markoff process is proceeding at a definite time
rate there is also an entropy per second
H 0 = ∑ fi Hi
i
where fi is the average frequency (occurrences per second) of state i. Clearly
H 0 = mH
where m is the average number of symbols produced per second. H or H 0 measures the amount of informa-
tion generated by the source per symbol or per second. If the logarithmic base is 2, they will represent bits
per symbol or per second.
If successive symbols are independent then H is simply , ∑ pi log pi where pi is the probability of sym-
bol i. Suppose in this case we consider a long message of N symbols. It will contain with high probability
about p1 N occurrences of the first symbol, p2 N occurrences of the second, etc. Hence the probability of this
particular message will be roughly
p = p1 1 p2 2 pn n N
p N p N p
or
:
log p = N ∑ pi log pi
: ,NH
log p =
i
H=
: log1= p :
N
H is thus approximately the logarithm of the reciprocal probability of a typical long sequence divided by the
number of symbols in the sequence. The same result holds for any source. Stated more precisely we have
(see Appendix 3):
Theorem 3: Given any 0 and 0, we can find an N0 such that the sequences of any length N N0
fall into two classes:
1. A set whose total probability is less than .
2. The remainder, all of whose members have probabilities satisfying the inequality
log p,1
N
,H :
log p,1
In other words we are almost certain to have very close to H when N is large.
N
A closely related result deals with the number of sequences of various probabilities. Consider again the
sequences of length N and let them be arranged in order of decreasing probability. We define nq to be
the number we must take from this set starting with the most probable one in order to accumulate a total
probability q for those taken.
13
14. Theorem 4:
log nq
Lim =H
N !∞ N
when q does not equal 0 or 1.
We may interpret log nq as the number of bits required to specify the sequence when we consider only
log nq
the most probable sequences with a total probability q. Then is the number of bits per symbol for
N
the specification. The theorem says that for large N this will be independent of q and equal to H. The rate
of growth of the logarithm of the number of reasonably probable sequences is given by H, regardless of our
interpretation of “reasonably probable.” Due to these results, which are proved in Appendix 3, it is possible
for most purposes to treat the long sequences as though there were just 2HN of them, each with a probability
2,HN .
The next two theorems show that H and H 0 can be determined by limiting operations directly from
the statistics of the message sequences, without reference to the states and transition probabilities between
states.
Theorem 5: Let pBi be the probability of a sequence Bi of symbols from the source. Let
GN = , N ∑ pBi log pBi
1
i
where the sum is over all sequences Bi containing N symbols. Then GN is a monotonic decreasing function
of N and
Lim GN = H
N !∞
:
;
Theorem 6: Let pBi S j be the probability of sequence Bi followed by symbol S j and pBi S j =
; =
pBi S j pBi be the conditional probability of S j after Bi . Let
;
FN = , ∑ pBi S j log pBi S j
i; j
where the sum is over all blocks Bi of N , 1 symbols and over all symbols S j . Then FN is a monotonic
decreasing function of N ,
FN = NGN , N , 1GN,1;
N
GN =
1
∑ Fn
N n=1
;
FN GN ;
and LimN !∞ FN = H .
These results are derived in Appendix 3. They show that a series of approximations to H can be obtained
; ;:::;
by considering only the statistical structure of the sequences extending over 1 2 N symbols. FN is the
better approximation. In fact FN is the entropy of the N th order approximation to the source of the type
discussed above. If there are no statistical influences extending over more than N symbols, that is if the
conditional probability of the next symbol knowing the preceding N , 1 is not changed by a knowledge of
any before that, then FN = H. FN of course is the conditional entropy of the next symbol when the N , 1
preceding ones are known, while GN is the entropy per symbol of blocks of N symbols.
The ratio of the entropy of a source to the maximum value it could have while still restricted to the same
symbols will be called its relative entropy. This is the maximum compression possible when we encode into
the same alphabet. One minus the relative entropy is the redundancy. The redundancy of ordinary English,
not considering statistical structure over greater distances than about eight letters, is roughly 50%. This
means that when we write English half of what we write is determined by the structure of the language and
half is chosen freely. The figure 50% was found by several independent methods which all gave results in
14
15. this neighborhood. One is by calculation of the entropy of the approximations to English. A second method
is to delete a certain fraction of the letters from a sample of English text and then let someone attempt to
restore them. If they can be restored when 50% are deleted the redundancy must be greater than 50%. A
third method depends on certain known results in cryptography.
Two extremes of redundancy in English prose are represented by Basic English and by James Joyce’s
book “Finnegans Wake”. The Basic English vocabulary is limited to 850 words and the redundancy is very
high. This is reflected in the expansion that occurs when a passage is translated into Basic English. Joyce
on the other hand enlarges the vocabulary and is alleged to achieve a compression of semantic content.
The redundancy of a language is related to the existence of crossword puzzles. If the redundancy is
zero any sequence of letters is a reasonable text in the language and any two-dimensional array of letters
forms a crossword puzzle. If the redundancy is too high the language imposes too many constraints for large
crossword puzzles to be possible. A more detailed analysis shows that if we assume the constraints imposed
by the language are of a rather chaotic and random nature, large crossword puzzles are just possible when
the redundancy is 50%. If the redundancy is 33%, three-dimensional crossword puzzles should be possible,
etc.
8. R EPRESENTATION OF THE E NCODING AND D ECODING O PERATIONS
We have yet to represent mathematically the operations performed by the transmitter and receiver in en-
coding and decoding the information. Either of these will be called a discrete transducer. The input to the
transducer is a sequence of input symbols and its output a sequence of output symbols. The transducer may
have an internal memory so that its output depends not only on the present input symbol but also on the past
history. We assume that the internal memory is finite, i.e., there exist a finite number m of possible states of
the transducer and that its output is a function of the present state and the present input symbol. The next
state will be a second function of these two quantities. Thus a transducer can be described by two functions:
yn = f xn; n
n+1 = gxn ; n
where
xn is the nth input symbol,
n is the state of the transducer when the nth input symbol is introduced,
yn is the output symbol (or sequence of output symbols) produced when xn is introduced if the state is n.
If the output symbols of one transducer can be identified with the input symbols of a second, they can be
connected in tandem and the result is also a transducer. If there exists a second transducer which operates
on the output of the first and recovers the original input, the first transducer will be called non-singular and
the second will be called its inverse.
Theorem 7: The output of a finite state transducer driven by a finite state statistical source is a finite
state statistical source, with entropy (per unit time) less than or equal to that of the input. If the transducer
is non-singular they are equal.
Let represent the state of the source, which produces a sequence of symbols xi ; and let be the state of
the transducer, which produces, in its output, blocks of symbols y j . The combined system can be represented
by the “product state space” of pairs ; ; ;
. Two points in the space 1 1 and 2 2 , are connected by
a line if 1 can produce an x which changes 1 to 2 , and this line is given the probability of that x in this
case. The line is labeled with the block of y j symbols produced by the transducer. The entropy of the output
can be calculated as the weighted sum over the states. If we sum first on each resulting term is less than or
equal to the corresponding term for , hence the entropy is not increased. If the transducer is non-singular
0 0 0
let its output be connected to the inverse transducer. If H1 , H2 and H3 are the output entropies of the source,
the first and second transducers respectively, then H1 0 H 0 H 0 = H 0 and therefore H 0 = H 0 .
2 3 1 1 2
15
16. Suppose we have a system of constraints on possible sequences of the type which can be represented by
s
a linear graph as in Fig. 2. If probabilities pi j were assigned to the various lines connecting state i to state j
this would become a source. There is one particular assignment which maximizes the resulting entropy (see
Appendix 4).
Theorem 8: Let the system of constraints considered as a channel have a capacity C = logW . If we
assign
pi j = W ,`i j
s Bj s
Bi
where `i sj
is the duration of the sth symbol leading from state i to state j and the Bi satisfy
Bi = ∑ B jW ,`i j
s
s; j
then H is maximized and equal to C.
By proper assignment of the transition probabilities the entropy of symbols on a channel can be maxi-
mized at the channel capacity.
9. T HE F UNDAMENTAL T HEOREM FOR A N OISELESS C HANNEL
We will now justify our interpretation of H as the rate of generating information by proving that H deter-
mines the channel capacity required with most efficient coding.
Theorem 9: Let a source have entropy H bits per symbol and a channel have a capacity C bits per
second. Then it is possible to encode the output of the source in such a way as to transmit at the average
rate , symbols per second over the channel where is arbitrarily small. It is not possible to transmit at
C
H
C
an average rate greater than .
H
C
The converse part of the theorem, that cannot be exceeded, may be proved by noting that the entropy
H
of the channel input per second is equal to that of the source, since the transmitter must be non-singular, and
also this entropy cannot exceed the channel capacity. Hence H 0 C and the number of symbols per second
=
= H 0 H C H. =
The first part of the theorem will be proved in two different ways. The first method is to consider the
set of all sequences of N symbols produced by the source. For N large we can divide these into two groups,
one containing less than 2H +N members and the second containing less than 2RN members (where R is
the logarithm of the number of different symbols) and having a total probability less than . As N increases
and approach zero. The number of signals of duration T in the channel is greater than 2C,
19. T=
H
C
+ N
then there will be a sufficient number of sequences of channel symbols for the high probability group when
N and T are sufficiently large (however small ) and also some additional ones. The high probability group
is coded in an arbitrary one-to-one way into this set. The remaining sequences are represented by larger
sequences, starting and ending with one of the sequences not used for the high probability group. This
special sequence acts as a start and stop signal for a different code. In between a sufficient time is allowed
to give enough different sequences for all the low probability messages. This will require
20. T1 =
R
C
+ ' N
where ' is small. The mean rate of transmission in message symbols per second will then be greater than
,1
H
R ,1
1 , T
+
N
T1
N
= 1 ,
C
+ +
C
+ ' :
16
21. '
As N increases , and approach zero and the rate approaches .
H
C
Another method of performing this coding and thereby proving the theorem can be described as follows:
Arrange the messages of length N in order of decreasing probability and suppose their probabilities are
p1 p2 p3 pn . Let Ps = ∑s,1 pi ; that is Ps is the cumulative probability up to, but not including, ps .
1
We first encode into a binary system. The binary code for message s is obtained by expanding Ps as a binary
number. The expansion is carried out to ms places, where ms is the integer satisfying:
log2
1
ps
ms 1 + log2
1
ps
:
Thus the messages of high probability are represented by short codes and those of low probability by long
codes. From these inequalities we have
1
2ms
ps 1
2ms ,1
:
The code for Ps will differ from all succeeding ones in one or more of its ms places, since all the remaining
1
Pi are at least 2ms larger and their binary expansions therefore differ in the first ms places. Consequently all
the codes are different and it is possible to recover the message from its code. If the channel sequences are
not already sequences of binary digits, they can be ascribed binary numbers in an arbitrary fashion and the
binary code thus translated into signals suitable for the channel.
The average number H 0 of binary digits used per symbol of original message is easily estimated. We
have
H 0 = ∑ ms ps
1
N
:
But,
1
1 1
1
ps ∑ ms ps
1
N∑ N∑
log2 1 + log2 ps
ps N ps
and therefore,
GN
N
H0
1
GN +
As N increases GN approaches H, the entropy of the source and H 0 approaches H.
We see from this that the inefficiency in coding, when only a finite delay of N symbols is used, need
1
not be greater than N plus the difference between the true entropy H and the entropy GN calculated for
sequences of length N. The per cent excess time needed over the ideal is therefore less than
GN
H
+
1
HN
, 1:
This method of encoding is substantially the same as one found independently by R. M. Fano.9 His
method is to arrange the messages of length N in order of decreasing probability. Divide this series into two
groups of as nearly equal probability as possible. If the message is in the first group its first binary digit
will be 0, otherwise 1. The groups are similarly divided into subsets of nearly equal probability and the
particular subset determines the second binary digit. This process is continued until each subset contains
only one message. It is easily seen that apart from minor differences (generally in the last digit) this amounts
to the same thing as the arithmetic process described above.
10. D ISCUSSION AND E XAMPLES
In order to obtain the maximum power transfer from a generator to a load, a transformer must in general be
introduced so that the generator as seen from the load has the load resistance. The situation here is roughly
analogous. The transducer which does the encoding should match the source to the channel in a statistical
sense. The source as seen from the channel through the transducer should have the same statistical structure
9 Technical Report No. 65, The Research Laboratory of Electronics, M.I.T., March 17, 1949.
17
22. as the source which maximizes the entropy in the channel. The content of Theorem 9 is that, although an
exact match is not in general possible, we can approximate it as closely as desired. The ratio of the actual
rate of transmission to the capacity C may be called the efficiency of the coding system. This is of course
equal to the ratio of the actual entropy of the channel symbols to the maximum possible entropy.
In general, ideal or nearly ideal encoding requires a long delay in the transmitter and receiver. In the
noiseless case which we have been considering, the main function of this delay is to allow reasonably good
matching of probabilities to corresponding lengths of sequences. With a good code the logarithm of the
reciprocal probability of a long message must be proportional to the duration of the corresponding signal, in
fact
log p,1
T
,C
must be small for all but a small fraction of the long messages.
If a source can produce only one particular message its entropy is zero, and no channel is required. For
example, a computing machine set up to calculate the successive digits of produces a definite sequence
with no chance element. No channel is required to “transmit” this to another point. One could construct a
second machine to compute the same sequence at the point. However, this may be impractical. In such a case
we can choose to ignore some or all of the statistical knowledge we have of the source. We might consider
the digits of to be a random sequence in that we construct a system capable of sending any sequence of
digits. In a similar way we may choose to use some of our statistical knowledge of English in constructing
a code, but not all of it. In such a case we consider the source with the maximum entropy subject to the
statistical conditions we wish to retain. The entropy of this source determines the channel capacity which
is necessary and sufficient. In the example the only information retained is that all the digits are chosen
; ;:::;
from the set 0 1 9. In the case of English one might wish to use the statistical saving possible due to
letter frequencies, but nothing else. The maximum entropy source is then the first approximation to English
and its entropy determines the required channel capacity.
As a simple example of some of these results consider a source which produces a sequence of letters
chosen from among A, B, C, D with probabilities 1 , 1 , 1 , 1 , successive symbols being chosen independently.
2 4 8 8
We have
,1
H =, 2 log 1 + 1 log 1 + 2 log 1
2 4 4 8 8
7
= 4 bits per symbol :
Thus we can approximate a coding system to encode messages from this source into binary digits with an
average of 7 binary digit per symbol. In this case we can actually achieve the limiting value by the following
4
code (obtained by the method of the second proof of Theorem 9):
A 0
B 10
C 110
D 111
The average number of binary digits used in encoding a sequence of N symbols will be
,1
N 2 1+ 1 2+ 2 3
4 8
7
= 4N :
It is easily seen that the binary digits 0, 1 have probabilities 1 , 1 so the H for the coded sequences is one
2 2
bit per symbol. Since, on the average, we have 7 binary symbols per original letter, the entropies on a time
4
basis are the same. The maximum possible entropy for the original set is log4 = 2, occurring when A, B, C,
D have probabilities 1 , 1 , 1 , 1 . Hence the relative entropy is 7 . We can translate the binary sequences into
4 4 4 4 8
the original set of symbols on a two-to-one basis by the following table:
00 A0
01 B0
10 C0
11 D0
18
23. This double process then encodes the original message into the same symbols but with an average compres-
sion ratio 7 .
8
As a second example consider a source which produces a sequence of A’s and B’s with probability p for
A and q for B. If p q we have
H = , log p p 1 , p1, p
= , p log p1 , p 1, p = p
=
: p log
e
:
p
In such a case one can construct a fairly good coding of the message on a 0, 1 channel by sending a special
sequence, say 0000, for the infrequent symbol A and then a sequence indicating the number of B’s following
it. This could be indicated by the binary representation with all numbers containing the special sequence
deleted. All numbers up to 16 are represented as usual; 16 is represented by the next binary number after 16
which does not contain four zeros, namely 17 = 10001, etc.
It can be shown that as p ! 0 the coding approaches ideal provided the length of the special sequence is
properly adjusted.
PART II: THE DISCRETE CHANNEL WITH NOISE
11. R EPRESENTATION OF A N OISY D ISCRETE C HANNEL
We now consider the case where the signal is perturbed by noise during transmission or at one or the other
of the terminals. This means that the received signal is not necessarily the same as that sent out by the
transmitter. Two cases may be distinguished. If a particular transmitted signal always produces the same
received signal, i.e., the received signal is a definite function of the transmitted signal, then the effect may be
called distortion. If this function has an inverse — no two transmitted signals producing the same received
signal — distortion may be corrected, at least in principle, by merely performing the inverse functional
operation on the received signal.
The case of interest here is that in which the signal does not always undergo the same change in trans-
mission. In this case we may assume the received signal E to be a function of the transmitted signal S and a
second variable, the noise N.
E = f S N ;
The noise is considered to be a chance variable just as the message was above. In general it may be repre-
sented by a suitable stochastic process. The most general type of noisy discrete channel we shall consider
is a generalization of the finite state noise-free channel described previously. We assume a finite number of
states and a set of probabilities
p ;i j ; :
This is the probability, if the channel is in state and symbol i is transmitted, that symbol j will be received
and the channel left in state . Thus and range over the possible states, i over the possible transmitted
signals and j over the possible received signals. In the case where successive symbols are independently per-
turbed by the noise there is only one state, and the channel is described by the set of transition probabilities
pi j, the probability of transmitted symbol i being received as j.
If a noisy channel is fed by a source there are two statistical processes at work: the source and the noise.
Thus there are a number of entropies that can be calculated. First there is the entropy H x of the source
or of the input to the channel (these will be equal if the transmitter is non-singular). The entropy of the
output of the channel, i.e., the received signal, will be denoted by H y. In the noiseless case H y = H x.
The joint entropy of input and output will be H xy. Finally there are two conditional entropies Hx y and
Hy x, the entropy of the output when the input is known and conversely. Among these quantities we have
the relations
;
H x y = H x + Hx y = H y + Hy x :
All of these entropies can be measured on a per-second or a per-symbol basis.
19
24. 12. E QUIVOCATION AND C HANNEL C APACITY
If the channel is noisy it is not in general possible to reconstruct the original message or the transmitted
signal with certainty by any operation on the received signal E. There are, however, ways of transmitting
the information which are optimal in combating noise. This is the problem which we now consider.
Suppose there are two possible symbols 0 and 1, and we are transmitting at a rate of 1000 symbols per
second with probabilities p0 = p1 = 1 . Thus our source is producing information at the rate of 1000 bits
2
per second. During transmission the noise introduces errors so that, on the average, 1 in 100 is received
incorrectly (a 0 as 1, or 1 as 0). What is the rate of transmission of information? Certainly less than 1000
bits per second since about 1% of the received symbols are incorrect. Our first impulse might be to say
the rate is 990 bits per second, merely subtracting the expected number of errors. This is not satisfactory
since it fails to take into account the recipient’s lack of knowledge of where the errors occur. We may carry
it to an extreme case and suppose the noise so great that the received symbols are entirely independent of
the transmitted symbols. The probability of receiving 1 is 1 whatever was transmitted and similarly for 0.
2
Then about half of the received symbols are correct due to chance alone, and we would be giving the system
credit for transmitting 500 bits per second while actually no information is being transmitted at all. Equally
“good” transmission would be obtained by dispensing with the channel entirely and flipping a coin at the
receiving point.
Evidently the proper correction to apply to the amount of information transmitted is the amount of this
information which is missing in the received signal, or alternatively the uncertainty when we have received
a signal of what was actually sent. From our previous discussion of entropy as a measure of uncertainty it
seems reasonable to use the conditional entropy of the message, knowing the received signal, as a measure
of this missing information. This is indeed the proper definition, as we shall see later. Following this idea
the rate of actual transmission, R, would be obtained by subtracting from the rate of production (i.e., the
entropy of the source) the average rate of conditional entropy.
R = H x , Hy x
The conditional entropy Hy x will, for convenience, be called the equivocation. It measures the average
ambiguity of the received signal.
In the example considered above, if a 0 is received the a posteriori probability that a 0 was transmitted
is .99, and that a 1 was transmitted is .01. These figures are reversed if a 1 is received. Hence
: : :
Hy x = , 99 log 99 + 0 01 log0 01 :
:
= 081 bits/symbol
or 81 bits per second. We may say that the system is transmitting at a rate 1000 , 81 = 919 bits per second.
In the extreme case where a 0 is equally likely to be received as a 0 or 1 and similarly for 1, the a posteriori
probabilities are 1 , 1 and
2 2
Hy x = , 1 log 1 + 1 log 1
2 2 2 2
= 1 bit per symbol
or 1000 bits per second. The rate of transmission is then 0 as it should be.
The following theorem gives a direct intuitive interpretation of the equivocation and also serves to justify
it as the unique appropriate measure. We consider a communication system and an observer (or auxiliary
device) who can see both what is sent and what is recovered (with errors due to noise). This observer notes
the errors in the recovered message and transmits data to the receiving point over a “correction channel” to
enable the receiver to correct the errors. The situation is indicated schematically in Fig. 8.
Theorem 10: If the correction channel has a capacity equal to Hy x it is possible to so encode the
correction data as to send it over this channel and correct all but an arbitrarily small fraction of the errors.
This is not possible if the channel capacity is less than Hy x.
20
25. CORRECTION DATA
OBSERVER
M M0 M
SOURCE TRANSMITTER RECEIVER CORRECTING
DEVICE
Fig. 8 — Schematic diagram of a correction system.
Roughly then, Hy x is the amount of additional information that must be supplied per second at the
receiving point to correct the received message.
To prove the first part, consider long sequences of received message M 0 and corresponding original
message M. There will be logarithmically T Hy x of the M’s which could reasonably have produced each
M 0 . Thus we have T Hy x binary digits to send each T seconds. This can be done with frequency of errors
on a channel of capacity Hy x.
The second part can be proved by noting, first, that for any discrete chance variables x, y, z
;
Hy x z Hy x :
The left-hand side can be expanded to give
Hy z + Hyz x Hy x
Hyz x Hy x , Hy z Hy x , H z :
If we identify x as the output of the source, y as the received signal and z as the signal sent over the correction
channel, then the right-hand side is the equivocation less the rate of transmission over the correction channel.
If the capacity of this channel is less than the equivocation the right-hand side will be greater than zero and
Hyz x 0. But this is the uncertainty of what was sent, knowing both the received signal and the correction
signal. If this is greater than zero the frequency of errors cannot be arbitrarily small.
Example:
Suppose the errors occur at random in a sequence of binary digits: probability p that a digit is wrong
and q = 1 , p that it is right. These errors can be corrected if their position is known. Thus the
correction channel need only send information as to these positions. This amounts to transmitting
from a source which produces binary digits with probability p for 1 (incorrect) and q for 0 (correct).
This requires a channel of capacity
, p log p + q logq
which is the equivocation of the original system.
The rate of transmission R can be written in two other forms due to the identities noted above. We have
R = H x , Hy x
= H y , Hx y
= H x + H y , H x y; :
21
26. The first defining expression has already been interpreted as the amount of information sent less the uncer-
tainty of what was sent. The second measures the amount received less the part of this which is due to noise.
The third is the sum of the two amounts less the joint entropy and therefore in a sense is the number of bits
per second common to the two. Thus all three expressions have a certain intuitive significance.
The capacity C of a noisy channel should be the maximum possible rate of transmission, i.e., the rate
when the source is properly matched to the channel. We therefore define the channel capacity by
,
C = Max H x , Hy x
where the maximum is with respect to all possible information sources used as input to the channel. If the
channel is noiseless, Hy x = 0. The definition is then equivalent to that already given for a noiseless channel
since the maximum entropy for the channel is its capacity.
13. T HE F UNDAMENTAL T HEOREM FOR A D ISCRETE C HANNEL WITH N OISE
It may seem surprising that we should define a definite capacity C for a noisy channel since we can never
send certain information in such a case. It is clear, however, that by sending the information in a redundant
form the probability of errors can be reduced. For example, by repeating the message many times and by a
statistical study of the different received versions of the message the probability of errors could be made very
small. One would expect, however, that to make this probability of errors approach zero, the redundancy
of the encoding must increase indefinitely, and the rate of transmission therefore approach zero. This is by
no means true. If it were, there would not be a very well defined capacity, but only a capacity for a given
frequency of errors, or a given equivocation; the capacity going down as the error requirements are made
more stringent. Actually the capacity C defined above has a very definite significance. It is possible to send
information at the rate C through the channel with as small a frequency of errors or equivocation as desired
by proper encoding. This statement is not true for any rate greater than C. If an attempt is made to transmit
at a higher rate than C, say C + R1 , then there will necessarily be an equivocation equal to or greater than the
excess R1 . Nature takes payment by requiring just that much uncertainty, so that we are not actually getting
any more than C through correctly.
The situation is indicated in Fig. 9. The rate of information into the channel is plotted horizontally and
the equivocation vertically. Any point above the heavy line in the shaded region can be attained and those
below cannot. The points on the line cannot in general be attained, but there will usually be two points on
the line that can.
These results are the main justification for the definition of C and will now be proved.
Theorem 11: Let a discrete channel have the capacity C and a discrete source the entropy per second H .
If H C there exists a coding system such that the output of the source can be transmitted over the channel
with an arbitrarily small frequency of errors (or an arbitrarily small equivocation). If H C it is possible
to encode the source so that the equivocation is less than H , C + where is arbitrarily small. There is no
method of encoding which gives an equivocation less than H , C.
The method of proving the first part of this theorem is not by exhibiting a coding method having the
desired properties, but by showing that such a code must exist in a certain group of codes. In fact we will
ATTAINABLE
Hy x REGION
0
1.
=
PE
O
SL
C H x
Fig. 9 — The equivocation possible for a given input entropy to a channel.
22