This document provides conversion factors between British gravitational (BG) units and International System of Units (SI) units for various quantities in fluid mechanics and heat transfer. It lists units for length, area, mass, density, force, pressure, temperature, velocity, power, viscosity, volume, and flow rate. For each quantity, it specifies the conversion factor to multiply the BG unit by to obtain the equivalent SI unit. The list of conversion factors is extensive and covers many common units needed for engineering calculations involving fluid properties, forces, heat transfer, and fluid flow behaviors.


![EQUATION SHEET
Ideal-gas law: p RT, Rair 287 J/kg-K
Hydrostatics, constant density:
p2 p1 (z2 z1), g
Buoyant force:
(displaced volume)
CV momentum:
Steady flow energy:
(p/V2
/2gz)out hfriction hpump hturbine
Incompressible continuity:
Incompressible stream function
Bernoulli unsteady irrotational flow:
Pipe head loss:
where f Moody chart friction factor
Laminar flat plate flow: ,
,
Isentropic flow: ,
,
Prandtl-Meyer expansion: K (k1)/(k1),
K1/2
tan1
[(Ma2
1)/K]1/2
tan1
(Ma2
1)1/2
Gradually varied channel flow:
, Fr V/Vcrit
dy/dx (S0 S)/(1 Fr2
)
p0/p (T0/T)k(k1)
0/ (T0/T)1/(k1)
T0 /T15(k1)/26Ma2
CD Drag/11
2V2
A2; CL Lift/11
2V2
A2
CD 1.328/ReL
1/2
cf 0.664/Rex
1/2
/x 5.0/Rex
1/2
hf f(L/d)V2
/(2g)
/t dp/ V2
/2 gz Const
u /y; v /x
(x,y):
V 0
(p/V2
/2gz)in
g 3(AV)V4out g 3(AV )V4in gF
d/dt1 CV
Vd 2
FB fluid
Surface tension:
Hydrostatic panel force: ,
yCPIxxsin
/(hCGA), xCPIxysin
/(hCGA)
CV mass:
CV angular momentum:
Acceleration:
Navier-Stokes:
Velocity potential :
Turbulent friction factor:
Orifice, nozzle, venturi flow:
,
Turbulent flat plate flow: ,
2-D potential flow:
One-dimensional isentropic area change:
A/A*(1/Ma)[1{(k1)/2}Ma2
](1/2)(k1)/(k1)
Uniform flow, Manning’s n, SI units:
Euler turbine formula:
Power Q(u2Vt2 u1Vt1), u r
V0(m/s) (1.0/n)3Rh(m)42/3
S0
1/2
2
2
0
cf 0.027/Rex
1/7
, CD 0.031/ReL
1/7
/x 0.16/Rex
1/7
d/D
QCdAthroat 32 p/5(14
)641/2
2.0 log10 3](https://image.slidesharecdn.com/white09-220921151844-e1802c93/75/Seven-edition-in-fluid-mechanics-White-4-2048.jpg)


![3
Fluid mechanics is the study of fluids either in motion (fluid dynamics) or at rest (fluid
statics). Both gases and liquids are classified as fluids, and the number of fluid engi-
neering applications is enormous: breathing, blood flow, swimming, pumps, fans, tur-
bines, airplanes, ships, rivers, windmills, pipes, missiles, icebergs, engines, filters, jets,
and sprinklers, to name a few. When you think about it, almost everything on this
planet either is a fluid or moves within or near a fluid.
The essence of the subject of fluid flow is a judicious compromise between theory
and experiment. Since fluid flow is a branch of mechanics, it satisfies a set of well-
documented basic laws, and thus a great deal of theoretical treatment is available. How-
ever, the theory is often frustrating because it applies mainly to idealized situations,
which may be invalid in practical problems. The two chief obstacles to a workable the-
ory are geometry and viscosity. The basic equations of fluid motion (Chap. 4) are too
difficult to enable the analyst to attack arbitrary geometric configurations. Thus most
textbooks concentrate on flat plates, circular pipes, and other easy geometries. It is pos-
sible to apply numerical computer techniques to complex geometries, and specialized
textbooks are now available to explain the new computational fluid dynamics (CFD)
approximations and methods [1–4].1
This book will present many theoretical results
while keeping their limitations in mind.
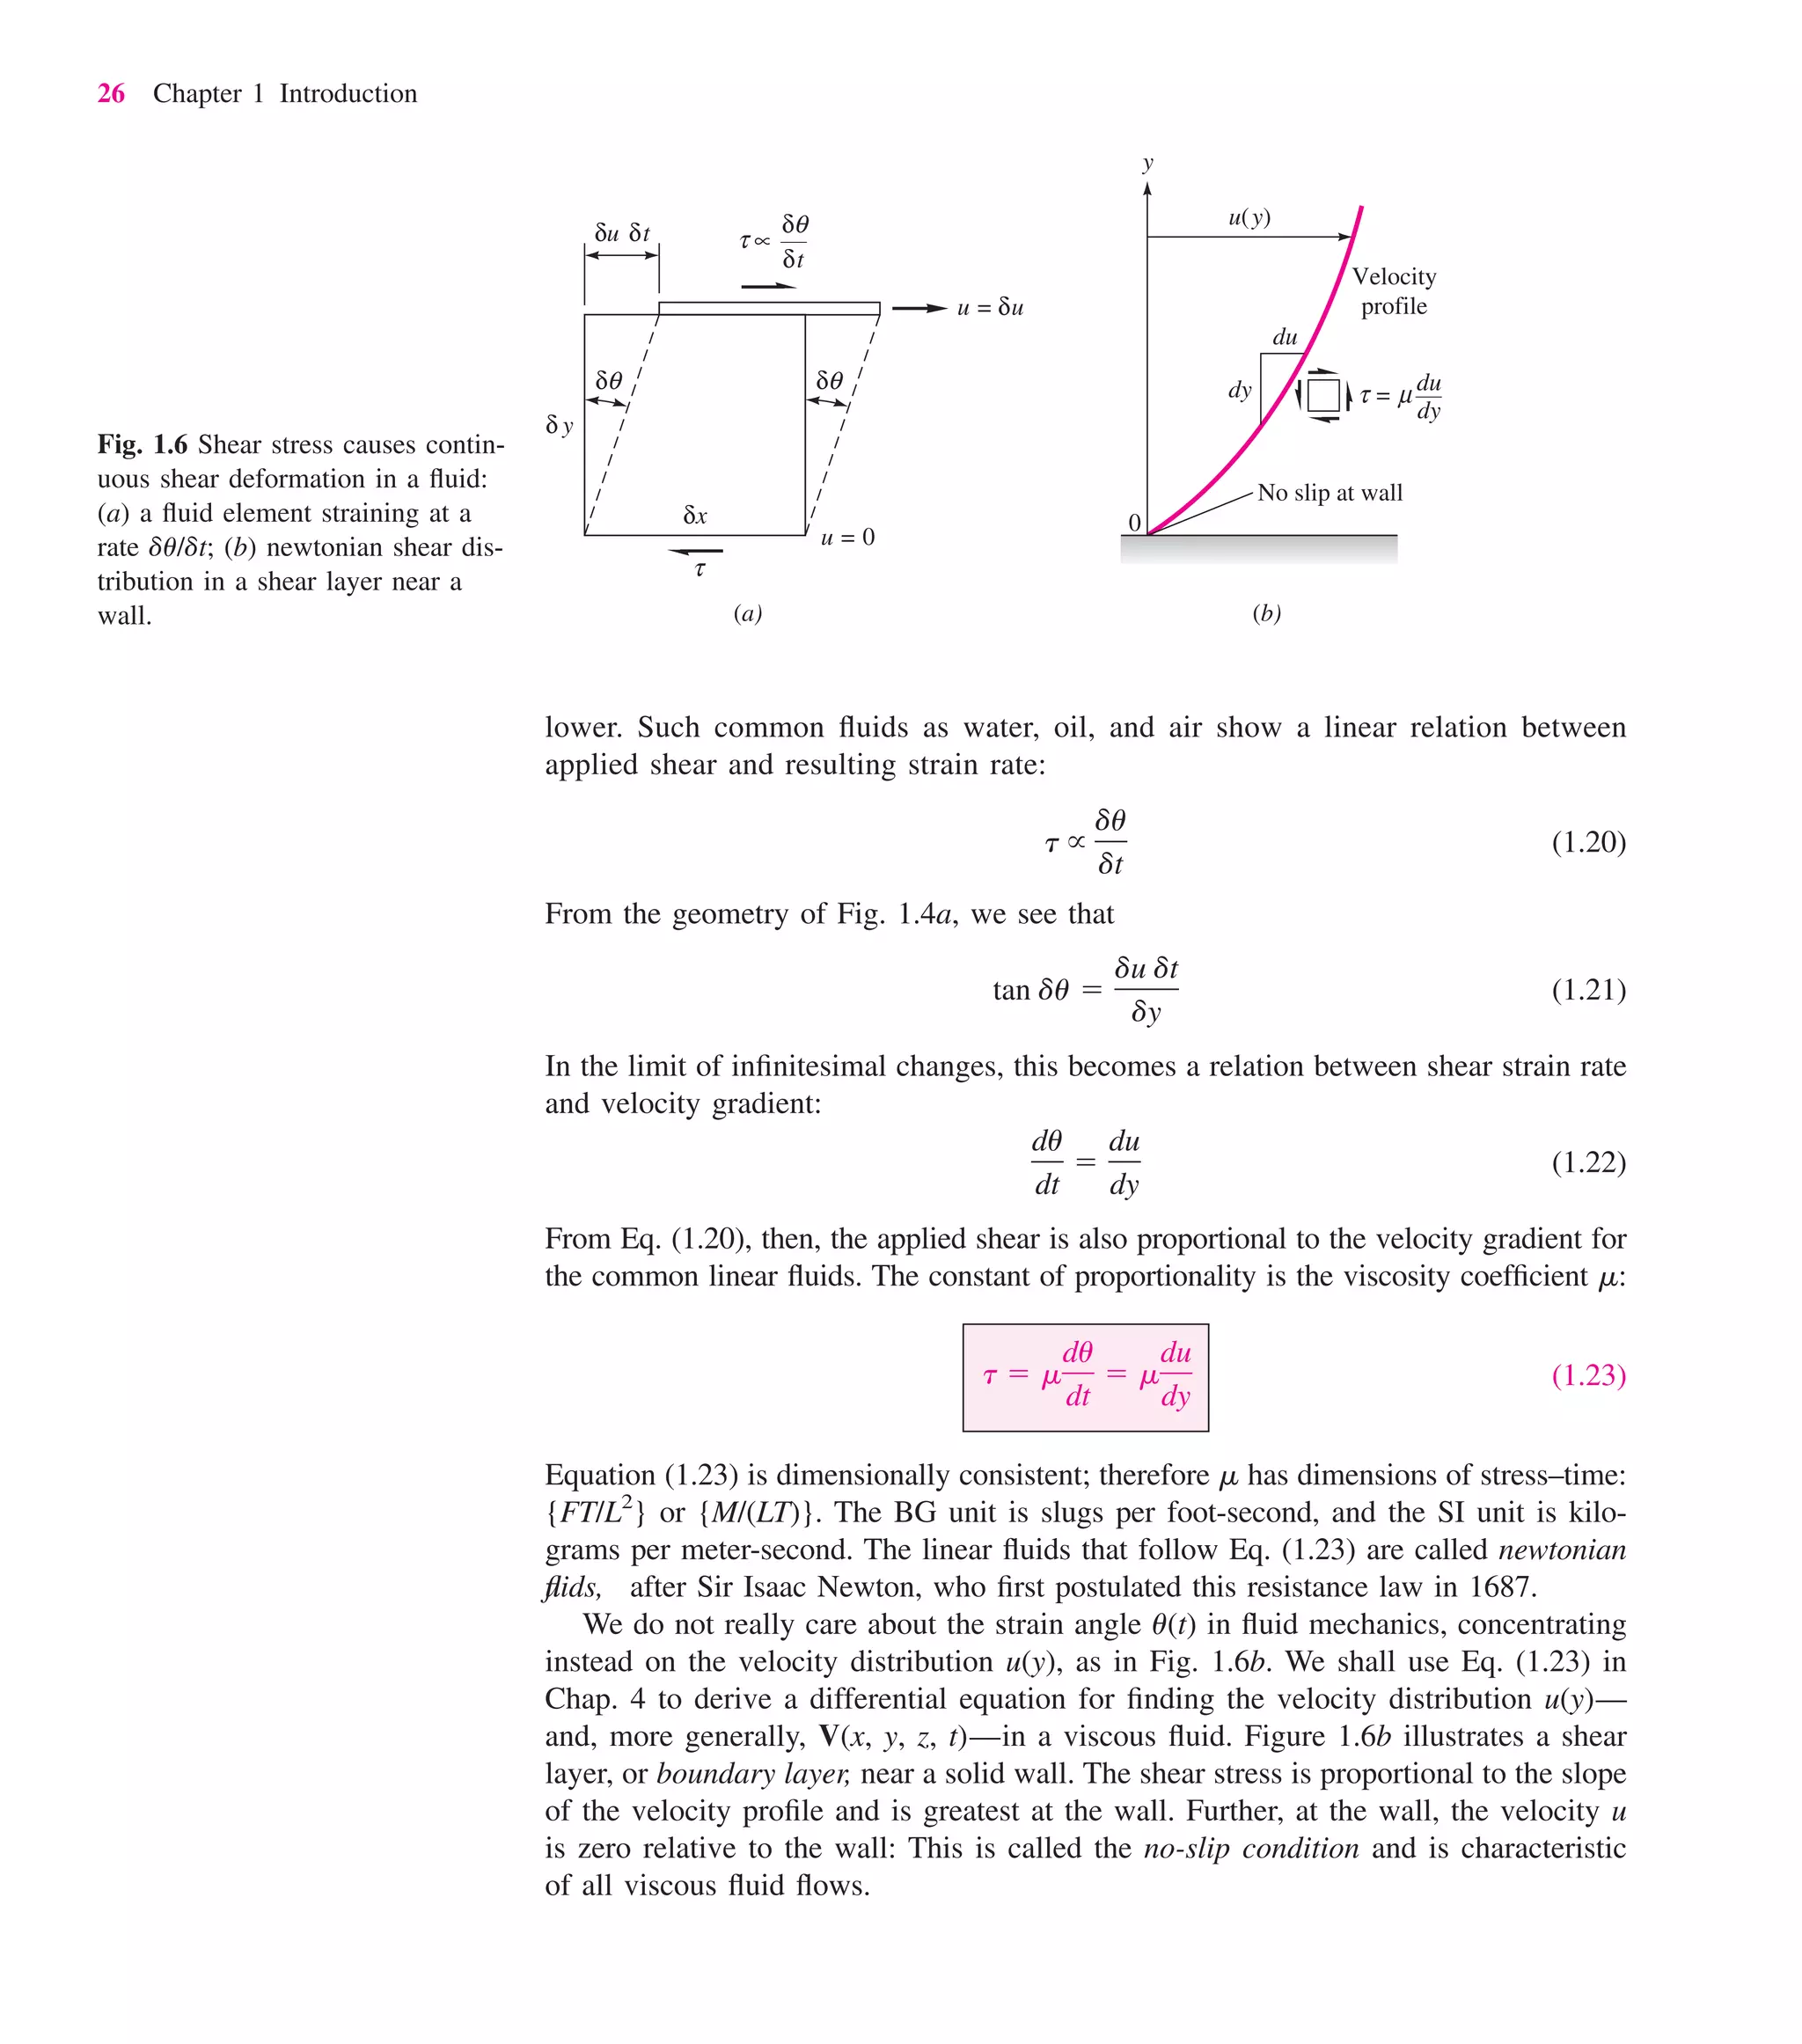
The second obstacle to a workable theory is the action of viscosity, which can be
neglected only in certain idealized flows (Chap. 8). First, viscosity increases the diffi-
culty of the basic equations, although the boundary-layer approximation found by
Ludwig Prandtl in 1904 (Chap. 7) has greatly simplified viscous-flow analyses. Sec-
ond, viscosity has a destabilizing effect on all fluids, giving rise, at frustratingly small
velocities, to a disorderly, random phenomenon called turbulence. The theory of tur-
bulent flow is crude and heavily backed up by experiment (Chap. 6), yet it can be quite
serviceable as an engineering estimate. This textbook only introduces the standard
experimental correlations for turbulent time-mean flow. Meanwhile, there are advanced
texts on both time-mean turbulence and turbulence modeling [5, 6] and on the newer,
computer-intensive direct numerical simulation (DNS) of fluctuating turbulence [7, 8].
1.1 Preliminary Remarks
Chapter 1
Introduction
1
Numbered references appear at the end of each chapter.
whi29346_ch01_002-063.qxd 10/14/09 19:57 Page 3 Debd 208:MHDQ176:whi29346:0073529346:whi29346_pagefiles:](https://image.slidesharecdn.com/white09-220921151844-e1802c93/75/Seven-edition-in-fluid-mechanics-White-25-2048.jpg)
![Thus there is theory available for fluid flow problems, but in all cases it should
be backed up by experiment. Often the experimental data provide the main source
of information about specific flows, such as the drag and lift of immersed bodies
(Chap. 7). Fortunately, fluid mechanics is a highly visual subject, with good instru-
mentation [9–11], and the use of dimensional analysis and modeling concepts
(Chap. 5) is widespread. Thus experimentation provides a natural and easy comple-
ment to the theory. You should keep in mind that theory and experiment should go
hand in hand in all studies of fluid mechanics.
Like most scientific disciplines, fluid mechanics has a history of erratically occurring
early achievements, then an intermediate era of steady fundamental discoveries in the
eighteenth and nineteenth centuries, leading to the twenty-first-century era of “modern
practice,” as we self-centeredly term our limited but up-to-date knowledge. Ancient
civilizations had enough knowledge to solve certain flow problems. Sailing ships with
oars and irrigation systems were both known in prehistoric times. The Greeks pro-
duced quantitative information. Archimedes and Hero of Alexandria both postulated
the parallelogram law for addition of vectors in the third century B.C. Archimedes
(285–212 B.C.) formulated the laws of buoyancy and applied them to floating and sub-
merged bodies, actually deriving a form of the differential calculus as part of the
analysis. The Romans built extensive aqueduct systems in the fourth century B.C. but
left no records showing any quantitative knowledge of design principles.
From the birth of Christ to the Renaissance there was a steady improvement in the
design of such flow systems as ships and canals and water conduits but no recorded
evidence of fundamental improvements in flow analysis. Then Leonardo da Vinci
(1452–1519) stated the equation of conservation of mass in one-dimensional steady
flow. Leonardo was an excellent experimentalist, and his notes contain accurate
descriptions of waves, jets, hydraulic jumps, eddy formation, and both low-drag
(streamlined) and high-drag (parachute) designs. A Frenchman, Edme Mariotte
(1620–1684), built the first wind tunnel and tested models in it.
Problems involving the momentum of fluids could finally be analyzed after Isaac
Newton (1642–1727) postulated his laws of motion and the law of viscosity of the lin-
ear fluids now called newtonian. The theory first yielded to the assumption of a “per-
fect” or frictionless fluid, and eighteenth-century mathematicians (Daniel Bernoulli,
Leonhard Euler, Jean d’Alembert, Joseph-Louis Lagrange, and Pierre-Simon Laplace)
produced many beautiful solutions of frictionless-flow problems. Euler, Fig. 1.1, devel-
oped both the differential equations of motion and their integrated form, now called
the Bernoulli equation. D’Alembert used them to show his famous paradox: that a body
immersed in a frictionless fluid has zero drag. These beautiful results amounted to
overkill, since perfect-fluid assumptions have very limited application in practice and
most engineering flows are dominated by the effects of viscosity. Engineers began to
reject what they regarded as a totally unrealistic theory and developed the science of
hydraulics, relying almost entirely on experiment. Such experimentalists as Chézy,
Pitot, Borda, Weber, Francis, Hagen, Poiseuille, Darcy, Manning, Bazin, and Weisbach
produced data on a variety of flows such as open channels, ship resistance, pipe flows,
waves, and turbines. All too often the data were used in raw form without regard to
the fundamental physics of flow.
1.2 History and Scope of
Fluid Mechanics
4 Chapter 1 Introduction
Fig. 1.1 Leonhard Euler (1707–
1783) was the greatest mathemati-
cian of the eighteenth century and
used Newton’s calculus to develop
and solve the equations of motion
of inviscid flow. He published over
800 books and papers. [Courtesy
of the School of Mathematics and
Statistics, University of St Andrew,
Scotland.]
whi29346_ch01_002-063.qxd 10/14/09 19:57 Page 4 Debd 208:MHDQ176:whi29346:0073529346:whi29346_pagefiles:](https://image.slidesharecdn.com/white09-220921151844-e1802c93/75/Seven-edition-in-fluid-mechanics-White-26-2048.jpg)
![At the end of the nineteenth century, unification between experimental hydraulics
and theoretical hydrodynamics finally began. William Froude (1810–1879) and his son
Robert (1846–1924) developed laws of model testing; Lord Rayleigh (1842–1919)
proposed the technique of dimensional analysis; and Osborne Reynolds (1842–1912)
published the classic pipe experiment in 1883, which showed the importance of the
dimensionless Reynolds number named after him. Meanwhile, viscous-flow theory
was available but unexploited, since Navier (1785–1836) and Stokes (1819–1903) had
successfully added newtonian viscous terms to the equations of motion. The result-
ing Navier-Stokes equations were too difficult to analyze for arbitrary flows. Then, in
1904, a German engineer, Ludwig Prandtl (1875–1953), Fig. 1.2, published perhaps the
most important paper ever written on fluid mechanics. Prandtl pointed out that fluid flows
with small viscosity, such as water flows and airflows, can be divided into a thin vis-
cous layer, or boundary layer, near solid surfaces and interfaces, patched onto a nearly
inviscid outer layer, where the Euler and Bernoulli equations apply. Boundary-layer
theory has proved to be a very important tool in modern flow analysis. The twentieth-
century foundations for the present state of the art in fluid mechanics were laid in a series
of broad-based experiments and theories by Prandtl and his two chief friendly competi-
tors, Theodore von Kármán (1881–1963) and Sir Geoffrey I. Taylor (1886–1975). Many
of the results sketched here from a historical point of view will, of course, be discussed
in this textbook. More historical details can be found in Refs. 12 to 14.
The second half of the twentieth century introduced a new tool: Computational
Fluid Dynamics (CFD). The earliest paper on the subject known to this writer was
by A. Thom in 1933 [47], a laborious, but accurate, hand calculation of flow past a
cylinder at low Reynolds numbers. Commercial digital computers became available
in the 1950s, and personal computers in the 1970s, bringing CFD into adulthood. A
legendary first textbook was by Patankar [3]. Presently, with increases in computer
speed and memory, almost any laminar flow can be modeled accurately. Turbulent
flow is still calculated with empirical models, but Direct Numerical Simulation [7, 8]
is possible for low Reynolds numbers. Another five orders of magnitude in computer
speed are needed before general turbulent flows can be calculated. That may not be
possible, due to size limits of nano- and pico-elements. But, if general DNS devel-
ops, Gad-el-Hak [14] raises the prospect of a shocking future: all of fluid mechanics
reduced to a black box, with no real need for teachers, researchers, writers, or fluids
engineers.
Since the earth is 75 percent covered with water and 100 percent covered with air,
the scope of fluid mechanics is vast and touches nearly every human endeavor. The
sciences of meteorology, physical oceanography, and hydrology are concerned with
naturally occurring fluid flows, as are medical studies of breathing and blood circu-
lation. All transportation problems involve fluid motion, with well-developed spe-
cialties in aerodynamics of aircraft and rockets and in naval hydrodynamics of ships
and submarines. Almost all our electric energy is developed either from water flow
or from steam flow through turbine generators. All combustion problems involve fluid
motion as do the more classic problems of irrigation, flood control, water supply,
sewage disposal, projectile motion, and oil and gas pipelines. The aim of this book
is to present enough fundamental concepts and practical applications in fluid mechan-
ics to prepare you to move smoothly into any of these specialized fields of the sci-
ence of flow—and then be prepared to move out again as new technologies develop.
1.2 History and Scope of Fluid Mechanics 5
Fig. 1.2 Ludwig Prandtl (1875–
1953), often called the “father of
modern fluid mechanics” [15],
developed boundary layer theory
and many other innovative analy-
ses. He and his students were
pioneers in flow visualization
techniques. [Aufnahme von Fr.
Struckmeyer, Gottingen, courtesy
AIP Emilio Segre Visual Archives,
Lande Collection.]
whi29346_ch01_002-063.qxd 10/14/09 19:57 Page 5 Debd 208:MHDQ176:whi29346:0073529346:whi29346_pagefiles:](https://image.slidesharecdn.com/white09-220921151844-e1802c93/75/Seven-edition-in-fluid-mechanics-White-27-2048.jpg)


![In the previous discussion, clear decisions could be made about solids, liquids, and
gases. Most engineering fluid mechanics problems deal with these clear cases—that is,
the common liquids, such as water, oil, mercury, gasoline, and alcohol, and the com-
mon gases, such as air, helium, hydrogen, and steam, in their common temperature and
pressure ranges. There are many borderline cases, however, of which you should be
aware. Some apparently “solid” substances such as asphalt and lead resist shear stress
for short periods but actually deform slowly and exhibit definite fluid behavior over
long periods. Other substances, notably colloid and slurry mixtures, resist small shear
stresses but “yield” at large stress and begin to flow as fluids do. Specialized textbooks
are devoted to this study of more general deformation and flow, a field called
rheology [16]. Also, liquids and gases can coexist in two-phase mixtures, such as
steam–water mixtures or water with entrapped air bubbles. Specialized textbooks pres-
ent the analysis of such multiphase flows [17]. Finally, in some situations the distinc-
tion between a liquid and a gas blurs. This is the case at temperatures and pressures
above the so-called critical point of a substance, where only a single phase exists, pri-
marily resembling a gas. As pressure increases far above the critical point, the gaslike
substance becomes so dense that there is some resemblance to a liquid and the usual
thermodynamic approximations like the perfect-gas law become inaccurate. The criti-
cal temperature and pressure of water are Tc 647 K and pc 219 atm (atmosphere2
)
so that typical problems involving water and steam are below the critical point. Air,
being a mixture of gases, has no distinct critical point, but its principal component,
nitrogen, has Tc 126 K and pc 34 atm. Thus typical problems involving air are
in the range of high temperature and low pressure where air is distinctly and definitely
a gas. This text will be concerned solely with clearly identifiable liquids and gases,
and the borderline cases just discussed will be beyond our scope.
We have already used technical terms such as fluid pressure and density without a rig-
orous discussion of their definition. As far as we know, fluids are aggregations of mol-
ecules, widely spaced for a gas, closely spaced for a liquid. The distance between mol-
ecules is very large compared with the molecular diameter. The molecules are not fixed
in a lattice but move about freely relative to each other. Thus fluid density, or mass per
unit volume, has no precise meaning because the number of molecules occupying a given
volume continually changes. This effect becomes unimportant if the unit volume is large
compared with, say, the cube of the molecular spacing, when the number of molecules
within the volume will remain nearly constant in spite of the enormous interchange of
particles across the boundaries. If, however, the chosen unit volume is too large, there
could be a noticeable variation in the bulk aggregation of the particles. This situation is
illustrated in Fig. 1.4, where the “density” as calculated from molecular mass m within
a given volume is plotted versus the size of the unit volume. There is a limiting vol-
ume * below which molecular variations may be important and above which aggre-
gate variations may be important. The density of a fluid is best defined as
(1.1)
lim
S*
m
1.5 The Fluid as a Continuum
8 Chapter 1 Introduction
2
One atmosphere equals 2116 lbf/ft2
101,300 Pa.
whi29346_ch01_002-063.qxd 10/14/09 19:57 Page 8 Debd 208:MHDQ176:whi29346:0073529346:whi29346_pagefiles:](https://image.slidesharecdn.com/white09-220921151844-e1802c93/75/Seven-edition-in-fluid-mechanics-White-30-2048.jpg)
![The limiting volume * is about 109
mm3
for all liquids and for gases at atmo-
spheric pressure. For example, 109
mm3
of air at standard conditions contains approx-
imately 3 107
molecules, which is sufficient to define a nearly constant density
according to Eq. (1.1). Most engineering problems are concerned with physical dimen-
sions much larger than this limiting volume, so that density is essentially a point func-
tion and fluid properties can be thought of as varying continually in space, as sketched
in Fig. 1.4a. Such a fluid is called a continuum, which simply means that its varia-
tion in properties is so smooth that differential calculus can be used to analyze the
substance. We shall assume that continuum calculus is valid for all the analyses in
this book. Again there are borderline cases for gases at such low pressures that molec-
ular spacing and mean free path3
are comparable to, or larger than, the physical size
of the system. This requires that the continuum approximation be dropped in favor of
a molecular theory of rarefied gas flow [18]. In principle, all fluid mechanics problems
can be attacked from the molecular viewpoint, but no such attempt will be made here.
Note that the use of continuum calculus does not preclude the possibility of discon-
tinuous jumps in fluid properties across a free surface or fluid interface or across a
shock wave in a compressible fluid (Chap. 9). Our calculus in analyzing fluid flow
must be flexible enough to handle discontinuous boundary conditions.
A dimension is the measure by which a physical variable is expressed quantitatively.
A unit is a particular way of attaching a number to the quantitative dimension. Thus
length is a dimension associated with such variables as distance, displacement, width,
deflection, and height, while centimeters and inches are both numerical units for
expressing length. Dimension is a powerful concept about which a splendid tool called
dimensional analysis has been developed (Chap. 5), while units are the numerical
quantity that the customer wants as the final answer.
In 1872 an international meeting in France proposed a treaty called the Metric Con-
vention, which was signed in 1875 by 17 countries including the United States. It was
an improvement over British systems because its use of base 10 is the foundation of
our number system, learned from childhood by all. Problems still remained because
1.6 Dimensions and Units
1.6 Dimensions and Units 9
Microscopic
uncertainty
Macroscopic
uncertainty
0
1200
δ
δ * ≈ 10-9
mm3
Elemental
volume
Region containing fluid
= 1000 kg/m3
= 1100
= 1200
= 1300
(a) (b)
ρ
ρ
ρ
ρ
ρ
δ
Fig. 1.4 The limit definition of
continuum fluid density: (a) an
elemental volume in a fluid region
of variable continuum density;
(b) calculated density versus size
of the elemental volume.
3
The mean distance traveled by molecules between collisions (see Prob. P1.5).
whi29346_ch01_002-063.qxd 10/14/09 19:57 Page 9 Debd 208:MHDQ176:whi29346:0073529346:whi29346_pagefiles:](https://image.slidesharecdn.com/white09-220921151844-e1802c93/75/Seven-edition-in-fluid-mechanics-White-31-2048.jpg)
![even the metric countries differed in their use of kiloponds instead of dynes or
newtons, kilograms instead of grams, or calories instead of joules. To standardize the
metric system, a General Conference of Weights and Measures, attended in 1960 by
40 countries, proposed the International System of Units (SI). We are now undergo-
ing a painful period of transition to SI, an adjustment that may take many more years
to complete. The professional societies have led the way. Since July 1, 1974, SI units
have been required by all papers published by the American Society of Mechanical
Engineers, and there is a textbook explaining the SI [19]. The present text will use SI
units together with British gravitational (BG) units.
In fluid mechanics there are only four primary dimensions from which all other dimen-
sions can be derived: mass, length, time, and temperature.4
These dimensions and their
units in both systems are given in Table 1.1. Note that the kelvin unit uses no degree
symbol. The braces around a symbol like {M} mean “the dimension” of mass. All other
variables in fluid mechanics can be expressed in terms of {M}, {L}, {T}, and {}. For
example, acceleration has the dimensions {LT2
}. The most crucial of these secondary
dimensions is force, which is directly related to mass, length, and time by Newton’s
second law. Force equals the time rate of change of momentum or, for constant mass,
F ma (1.2)
From this we see that, dimensionally, {F} {MLT 2
}.
The use of a constant of proportionality in Newton’s law, Eq. (1.2), is avoided by
defining the force unit exactly in terms of the other basic units. In the SI system, the
basic units are newtons {F}, kilograms {M}, meters {L}, and seconds {T}. We define
1 newton of force 1 N 1 kg 1 m/s2
The newton is a relatively small force, about the weight of an apple (0.225 lbf). In addi-
tion, the basic unit of temperature { } in the SI system is the degree Kelvin, K. Use of
these SI units (N, kg, m, s, K) will require no conversion factors in our equations.
In the BG system also, a constant of proportionality in Eq. (1.2) is avoided by defin-
ing the force unit exactly in terms of the other basic units. In the BG system, the basic
units are pound-force {F}, slugs {M}, feet {L}, and seconds {T}. We define
1 pound of force 1 lbf 1 slug 1 ft/s2
#
The British Gravitational (BG)
System
#
The International System (SI)
Primary Dimensions
10 Chapter 1 Introduction
Table 1.1 Primary Dimensions in
SI and BG Systems
Primary dimension SI unit BG unit Conversion factor
Mass {M} Kilogram (kg) Slug 1 slug 14.5939 kg
Length {L} Meter (m) Foot (ft) 1 ft 0.3048 m
Time {T} Second (s) Second (s) 1 s 1 s
Temperature {} Kelvin (K) Rankine (R) 1 K 1.8R
4
If electromagnetic effects are important, a fifth primary dimension must be included, electric current
{I}, whose SI unit is the ampere (A).
whi29346_ch01_002-063.qxd 10/14/09 19:57 Page 10 Debd 208:MHDQ176:whi29346:0073529346:whi29346_pagefiles:](https://image.slidesharecdn.com/white09-220921151844-e1802c93/75/Seven-edition-in-fluid-mechanics-White-32-2048.jpg)

![EXAMPLE 1.1
A body weighs 1000 lbf when exposed to a standard earth gravity g 32.174 ft/s2
. (a) What
is its mass in kg? (b) What will the weight of this body be in N if it is exposed to the
moon’s standard acceleration gmoon 1.62 m/s2
? (c) How fast will the body accelerate if
a net force of 400 lbf is applied to it on the moon or on the earth?
Solution
We need to find the (a) mass; (b) weight on the moon; and (c) acceleration of this body.
This is a fairly simple example of conversion factors for differing unit systems. No prop-
erty data is needed. The example is too low-level for a sketch.
Newton’s law (1.2) holds with known weight and gravitational acceleration. Solve for m:
Convert this to kilograms:
m 31.08 slugs (31.08 slugs)(14.5939 kg/slug) 454 kg Ans. (a)
The mass of the body remains 454 kg regardless of its location. Equation (1.2) applies with
a new gravitational acceleration and hence a new weight:
F Wmoon mgmoon (454 kg)(1.62 m/s2
) 735 N Ans. (b)
This part does not involve weight or gravity or location. It is simply an application of
Newton’s law with a known mass and known force:
F 400 lbf ma (31.08 slugs) a
Solve for
Ans. (c)
Comment (c): This acceleration would be the same on the earth or moon or anywhere.
Many data in the literature are reported in inconvenient or arcane units suitable
only to some industry or specialty or country. The engineer should convert these data
to the SI or BG system before using them. This requires the systematic application
of conversion factors, as in the following example.
EXAMPLE 1.2
Industries involved in viscosity measurement [27, 36] continue to use the CGS system of
units, since centimeters and grams yield convenient numbers for many fluids. The absolute
viscosity () unit is the poise, named after J. L. M. Poiseuille, a French physician who in
1840 performed pioneering experiments on water flow in pipes; 1 poise 1 g/(cm-s). The
kinematic viscosity () unit is the stokes, named after G. G. Stokes, a British physicist who
a
400 lbf
31.08 slugs
12.87
ft
s2 a0.3048
m
ft
b 3.92
m
s2
Part (c)
Part (b)
F W 1000 lbf mg (m)(32.174 ft/s2
), or m
1000 lbf
32.174 ft/s2 31.08 slugs
Part (a)
12 Chapter 1 Introduction
whi29346_ch01_002-063.qxd 10/14/09 19:57 Page 12 Debd 208:MHDQ176:whi29346:0073529346:whi29346_pagefiles:](https://image.slidesharecdn.com/white09-220921151844-e1802c93/75/Seven-edition-in-fluid-mechanics-White-34-2048.jpg)


![In a given flow situation, the determination, by experiment or theory, of the proper-
ties of the fluid as a function of position and time is considered to be the solution to
the problem. In almost all cases, the emphasis is on the space–time distribution of the
fluid properties. One rarely keeps track of the actual fate of the specific fluid parti-
cles.6
This treatment of properties as continuum-field functions distinguishes fluid
mechanics from solid mechanics, where we are more likely to be interested in the tra-
jectories of individual particles or systems.
There are two different points of view in analyzing problems in mechanics. The first
view, appropriate to fluid mechanics, is concerned with the field of flow and is called
the eulerian method of description. In the eulerian method we compute the pressure
field p(x, y, z, t) of the flow pattern, not the pressure changes p(t) that a particle expe-
riences as it moves through the field.
The second method, which follows an individual particle moving through the flow,
is called the lagrangian description. The lagrangian approach, which is more appro-
priate to solid mechanics, will not be treated in this book. However, certain numeri-
cal analyses of sharply bounded fluid flows, such as the motion of isolated fluid
droplets, are very conveniently computed in lagrangian coordinates [1].
Fluid dynamic measurements are also suited to the eulerian system. For example,
when a pressure probe is introduced into a laboratory flow, it is fixed at a specific
position (x, y, z). Its output thus contributes to the description of the eulerian pres-
sure field p(x, y, z, t). To simulate a lagrangian measurement, the probe would have
to move downstream at the fluid particle speeds; this is sometimes done in oceano-
graphic measurements, where flowmeters drift along with the prevailing currents.
The two different descriptions can be contrasted in the analysis of traffic flow along
a freeway. A certain length of freeway may be selected for study and called the field of
flow. Obviously, as time passes, various cars will enter and leave the field, and the iden-
tity of the specific cars within the field will constantly be changing. The traffic engi-
neer ignores specific cars and concentrates on their average velocity as a function of
time and position within the field, plus the flow rate or number of cars per hour pass-
ing a given section of the freeway. This engineer is using an eulerian description of the
traffic flow. Other investigators, such as the police or social scientists, may be interested
in the path or speed or destination of specific cars in the field. By following a specific
car as a function of time, they are using a lagrangian description of the flow.
Foremost among the properties of a flow is the velocity field V(x, y, z, t). In fact,
determining the velocity is often tantamount to solving a flow problem, since other
properties follow directly from the velocity field. Chapter 2 is devoted to the calcu-
lation of the pressure field once the velocity field is known. Books on heat transfer
(for example, Ref. 20) are largely devoted to finding the temperature field from known
velocity fields.
The Velocity Field
Eulerian and Lagrangian
Descriptions
1.7 Properties of the
Velocity Field
1.7 Properties of the Velocity Field 17
6
One example where fluid particle paths are important is in water quality analysis of the fate of con-
taminant discharges.
whi29346_ch01_002-063.qxd 10/14/09 19:58 Page 17 Debd 208:MHDQ176:whi29346:0073529346:whi29346_pagefiles:](https://image.slidesharecdn.com/white09-220921151844-e1802c93/75/Seven-edition-in-fluid-mechanics-White-39-2048.jpg)

![substance such as water or oxygen, two basic properties such as pressure and
temperature are sufficient to fix the value of all the others:
(p, T) h h(p, T) (p, T)
and so on for every quantity in the list. Note that the specific volume, so important
in thermodynamic analyses, is omitted here in favor of its inverse, the density .
Recall that thermodynamic properties describe the state of a system—that is, a
collection of matter of fixed identity that interacts with its surroundings. In most cases
here the system will be a small fluid element, and all properties will be assumed to
be continuum properties of the flow field: (x, y, z, t), and so on.
Recall also that thermodynamics is normally concerned with static systems,
whereas fluids are usually in variable motion with constantly changing properties.
Do the properties retain their meaning in a fluid flow that is technically not in
equilibrium? The answer is yes, from a statistical argument. In gases at normal pres-
sure (and even more so for liquids), an enormous number of molecular collisions
occur over a very short distance of the order of 1 m, so that a fluid subjected to
sudden changes rapidly adjusts itself toward equilibrium. We therefore assume that
all the thermodynamic properties just listed exist as point functions in a flowing fluid
and follow all the laws and state relations of ordinary equilibrium thermodynamics.
There are, of course, important nonequilibrium effects such as chemical and nuclear
reactions in flowing fluids, which are not treated in this text.
Pressure is the (compression) stress at a point in a static fluid (Fig. 1.3). Next to
velocity, the pressure p is the most dynamic variable in fluid mechanics. Differences
or gradients in pressure often drive a fluid flow, especially in ducts. In low-speed
flows, the actual magnitude of the pressure is often not important, unless it drops so
low as to cause vapor bubbles to form in a liquid. For convenience, we set many such
problem assignments at the level of 1 atm 2116 lbf/ft2
101,300 Pa. High-speed
(compressible) gas flows (Chap. 9), however, are indeed sensitive to the magnitude
of pressure.
Temperature T is related to the internal energy level of a fluid. It may vary consider-
ably during high-speed flow of a gas (Chap. 9). Although engineers often use Celsius
or Fahrenheit scales for convenience, many applications in this text require absolute
(Kelvin or Rankine) temperature scales:
If temperature differences are strong, heat transfer may be important [20], but our
concern here is mainly with dynamic effects.
The density of a fluid, denoted by (lowercase Greek rho), is its mass per unit volume.
Density is highly variable in gases and increases nearly proportionally to the pressure
level. Density in liquids is nearly constant; the density of water (about 1000 kg/m3
)
Density
K C 273.16
R F 459.69
Temperature
Pressure
1.8 Thermodynamic Properties of a Fluid 19
whi29346_ch01_002-063.qxd 10/14/09 19:58 Page 19 Debd 208:MHDQ176:whi29346:0073529346:whi29346_pagefiles:](https://image.slidesharecdn.com/white09-220921151844-e1802c93/75/Seven-edition-in-fluid-mechanics-White-41-2048.jpg)


![One proves in thermodynamics that Eq. (1.10) requires that the internal molecular
energy û of a perfect gas vary only with temperature: û û(T). Therefore the spe-
cific heat cv also varies only with temperature:
or (1.14)
In like manner h and cp of a perfect gas also vary only with temperature:
(1.15)
The ratio of specific heats of a perfect gas is an important dimensionless parameter
in compressible flow analysis (Chap. 9)
(1.16)
As a first approximation in airflow analysis we commonly take cp, cv, and k to be
constant:
(1.17)
Actually, for all gases, cp and cv increase gradually with temperature, and k decreases
gradually. Experimental values of the specific-heat ratio for eight common gases are
shown in Fig. 1.5.
Many flow problems involve steam. Typical steam operating conditions are relatively
close to the critical point, so that the perfect-gas approximation is inaccurate. Since no
simple formulas apply accurately, steam properties are available both in EES (see
Sec. 1.12) and on a CD-ROM [23] and even on the Internet, as a MathPad Corp.
applet [24]. Meanwhile, the error of using the perfect-gas law can be moderate, as the
following example shows.
EXAMPLE 1.5
Estimate and cp of steam at 100 lbf/in2
and 400F, in English units, (a) by the perfect-gas
approximation and (b) by the ASME Steam Tables [23] or by EES.
Solution
• Approach (a)—the perfect-gas law: Although steam is not an ideal gas, we can estimate
these properties with moderate accuracy from Eqs. (1.10) and (1.17). First convert pressure
cp
kR
k 1
6010 ft2
/(s2 # R) 1005 m2
/(s2 # K)
cv
R
k 1
4293 ft2
/(s2 # R) 718 m2
/(s2 # K)
kair 1.4
k
cp
cv
k(T)](https://image.slidesharecdn.com/white09-220921151844-e1802c93/75/Seven-edition-in-fluid-mechanics-White-44-2048.jpg)


![30 Chapter 1 Introduction
• Approach: The analysis of Fig. 1.8 leads to Eq. (1.26) for laminar flow.
• Property values: From Table 1.4 for SAE 30 oil, the oil viscosity 0.29 kg/(m-s).
• Solution steps: In Eq. (1.26), the only unknown is the fluid shear stress:
Ans.
• Comments: Note the unit identities, 1 kg-m/s2
1 N and 1 N/m2
1 Pa. Although oil
is very viscous, this shear stress is modest, about 2400 times less than atmospheric pres-
sure. Viscous stresses in gases and thin (watery) liquids are even smaller.
Temperature has a strong effect and pressure a moderate effect on viscosity. The vis-
cosity of gases and most liquids increases slowly with pressure. Water is anomalous
in showing a very slight decrease below 30C. Since the change in viscosity is only
a few percent up to 100 atm, we shall neglect pressure effects in this book.
Gas viscosity increases with temperature. Two common approximations are the
power law and the Sutherland law:
(1.27)
where 0 is a known viscosity at a known absolute temperature T0 (usually 273 K).
The constants n and S are fit to the data, and both formulas are adequate over a wide
range of temperatures. For air, n 0.7 and S 110 K 199R. Other values are
given in Ref. 26.
Liquid viscosity decreases with temperature and is roughly exponential, aebT
;
but a better fit is the empirical result that ln is quadratic in 1/T, where T is absolute
temperature:
(1.28)
For water, with T0 273.16 K, 0 0.001792 kg/(m s), suggested values are
a 1.94, b 4.80, and c 6.74, with accuracy about
1 percent. The viscosity
of water is tabulated in Table A.1. Curve-fit viscosity formulas for 355 organic liquids
are given by Yaws et al. [27]. For further viscosity data, see Refs. 21, 28 and 29.
Fluids that do not follow the linear law of Eq. (1.23) are called nonnewtonian and are
treated in books on rheology [16]. Figure 1.9a compares some examples to a newtonian
fluid. For the nonlinear curves, the slope at any point is called the apparent viscosity.
Dilatant. This fluid is shear-thickening, increasing its resistance with increasing strain
rate. Examples are suspensions of corn starch or sand in water. The classic case is
quicksand, which stiffens up if one thrashes about.
Nonnewtonian Fluids
ln
0
a ba
T0
T
b ca
T0
T
b
2
0
μ
a
T
T0
b
n
power law
(T/T0)3/2
(T0 S)
T S
Sutherland law
Variation of Viscosity
with Temperature
V
h
a0.29
kg
m # s
b
(3 m/s)
(0.02 m)
43.5
kg # m/s2
m2 43.5
N
m2 44 Pa
whi29346_ch01_002-063.qxd 10/14/09 20:01 Page 30 Debd 208:MHDQ176:whi29346:0073529346:whi29346_pagefiles:](https://image.slidesharecdn.com/white09-220921151844-e1802c93/75/Seven-edition-in-fluid-mechanics-White-53-2048.jpg)
![Pseudoplastic. A shear-thinning fluid is less resistant at higher strain rates. A very
strong thinning is called plastic. Some of the many examples are polymer solutions,
colloidal suspensions, paper pulp in water, latex paint, blood plasma, syrup, and
molasses. The classic case is paint, which is thick when poured but thin when brushed
at a high strain rate.
Bingham plastic. The limiting case of a plastic substance is one that requires a finite
yield stress before it begins to flow. Figure 1.9a shows yielding followed by linear
behavior, but nonlinear flow can also occur. Some examples are clay suspensions,
drilling mud, toothpaste, mayonnaise, chocolate, and mustard. The classic case is cat-
sup, which will not come out of the bottle until you stress it by shaking.
A further complication of nonnewtonian behavior is the transient effect shown in
Fig. 1.9b. Some fluids require a gradually increasing shear stress to maintain a
constant strain rate and are called rheopectic. The opposite case of a fluid that thins
out with time and requires decreasing stress is termed thixotropic. We neglect non-
newtonian effects in this book; see Ref. 16 for further study.
A liquid, being unable to expand freely, will form an interface with a second liquid
or gas. The physical chemistry of such interfacial surfaces is quite complex, and whole
textbooks are devoted to this specialty [30]. Molecules deep within the liquid repel
each other because of their close packing. Molecules at the surface are less dense and
attract each other. Since half of their neighbors are missing, the mechanical effect is
that the surface is in tension. We can account adequately for surface effects in fluid
mechanics with the concept of surface tension.
If a cut of length dL is made in an interfacial surface, equal and opposite forces
of magnitude dL are exposed normal to the cut and parallel to the surface, where
is called the coefficient of surface tension . The dimensions of are {F/L}, with SI
Surface Tension
1.9 Viscosity and Other Secondary Properties 31
Shear
stress
Shear
stress
Yield
stress
Plastic
Ideal Bingham
plastic
Dilatant
Newtonian
Pseudoplastic
Shear strain rate d
dt
θ
0 0 Time
(a) (b)
Constant
strain rate
Rheopectic
Common
fluids
Thixotropic
τ
τ
Fig. 1.9 Rheological behavior
of various viscous materials:
(a) stress versus strain rate;
(b) effect of time on applied
stress.
whi29346_ch01_002-063.qxd 10/14/09 20:01 Page 31 Debd 208:MHDQ176:whi29346:0073529346:whi29346_pagefiles:](https://image.slidesharecdn.com/white09-220921151844-e1802c93/75/Seven-edition-in-fluid-mechanics-White-54-2048.jpg)


![Example 1.8 illustrates how surface tension causes a fluid interface to rise or fall
in a capillary tube.
EXAMPLE 1.8
Derive an expression for the change in height h in a circular tube of a liquid with surface
tension and contact angle , as in Fig. E1.8.
Solution
The vertical component of the ring surface-tension force at the interface in the tube must
balance the weight of the column of fluid of height h:
2
R cos
R2
h
Solving for h, we have the desired result:
Ans.
Thus the capillary height increases inversely with tube radius R and is positive if 90
(wetting liquid) and negative (capillary depression) if 90.
Suppose that R 1 mm. Then the capillary rise for a water–air–glass interface, 0,
0.073 N/m, and 1000 kg/m3
is
For a mercury–air–glass interface, with 130, 0.48 N/m, and 13,600 kg/m3
,
the capillary rise is
When a small-diameter tube is used to make pressure measurements (Chap. 2), these cap-
illary effects must be corrected for.
Vapor pressure is the pressure at which a liquid boils and is in equilibrium with its
own vapor. For example, the vapor pressure of water at 68F is 49 lbf/ft2
, while that
of mercury is only 0.0035 lbf/ft2
. If the liquid pressure is greater than the vapor pres-
sure, the only exchange between liquid and vapor is evaporation at the interface. If,
however, the liquid pressure falls below the vapor pressure, vapor bubbles begin to
appear in the liquid. If water is heated to 212F, its vapor pressure rises to 2116 lbf/ft2
,
and thus water at normal atmospheric pressure will boil. When the liquid pressure is
dropped below the vapor pressure due to a flow phenomenon, we call the process
cavitation. If water is accelerated from rest to about 50 ft/s, its pressure drops by
about 15 lbf/in2
, or 1 atm. This can cause cavitation [31].
The dimensionless parameter describing flow-induced boiling is the cavitation number
(1.34)
Ca
pa pv
1
2V2
Vapor Pressure
h
2(0.48)(cos 130)
13,600(9.81)(0.001)
0.0046 m 0.46 cm
h
2(0.073 N/m)(cos 0)
(1000 kg/m3
)(9.81 m/s2
)(0.001 m)
0.015 (N # s2
)/kg 0.015 m 1.5 cm
h
2 cos
R
34 Chapter 1 Introduction
θ
2R
h
E1.8
whi29346_ch01_002-063.qxd 10/14/09 20:01 Page 34 Debd 208:MHDQ176:whi29346:0073529346:whi29346_pagefiles:](https://image.slidesharecdn.com/white09-220921151844-e1802c93/75/Seven-edition-in-fluid-mechanics-White-57-2048.jpg)


![• Solution steps: Insert the known data into Eq. (1) and solve for the velocity, using SI units:
, with V in m/s
or Ans.
• Comments: Note that the use of SI units requires no conversion factors, as discussed in
Example 1.3b. Pressures must be entered in pascals, not kilopascals.
When a fluid flow is bounded by a solid surface, molecular interactions cause the fluid
in contact with the surface to seek momentum and energy equilibrium with that surface.
All liquids essentially are in equilibrium with the surfaces they contact. All gases are,
too, except under the most rarefied conditions [18]. Excluding rarefied gases, then, all flu-
ids at a point of contact with a solid take on the velocity and temperature of that surface:
(1.35)
These are called the no-slip and no-temperature-jump conditions, respectively. They
serve as boundary conditions for analysis of fluid flow past a solid surface. Figure
1.15 illustrates the no-slip condition for water flow past the top and bottom surfaces
of a fixed thin plate. The flow past the upper surface is disorderly, or turbulent, while
Vfluid Vwall Tfluid Twall
No-Slip and No-Temperature-
Jump Conditions
V 1325 18.0 m/s
Solve V2
(115,000 1227)
0.35(1000)
325
m2
s2
pmin pv 1227 Pa 115,000 Pa 0.35a
1000
kg
m3bV2
1.9 Viscosity and Other Secondary Properties 37
Fig. 1.15 The no-slip condition in
water flow past a thin fixed plate.
The upper flow is turbulent; the
lower flow is laminar. The velocity
profile is made visible by a line of
hydrogen bubbles discharged from
the wire across the flow. (National
Committee for Fluid Mechanics
Films, Education Development
Center, Inc, © 1972)
whi29346_ch01_002-063.qxd 10/14/09 20:02 Page 37 Debd 208:MHDQ176:whi29346:0073529346:whi29346_pagefiles:](https://image.slidesharecdn.com/white09-220921151844-e1802c93/75/Seven-edition-in-fluid-mechanics-White-60-2048.jpg)


}1/2
343 m/s (1126 ft/s 768
mi/h). If, in this case, the air velocity reaches a significant fraction of a, say, 100 m/s,
then we must account for compressibility effects (Chap. 9). Another way to state this
is to account for compressibility when the Mach number Ma V/a of the flow reaches
about 0.3.
The speed of sound of water is tabulated in Table A.5. For near perfect gases, like
air, the speed of sound is simply calculated by Eq. (1.38). Many liquids have their
bulk modulus listed in Table A.3. Note, however, as discussed in Ref. 51, even a very
small amount of dissolved gas in a liquid can reduce the mixture speed of sound by
up to 80 percent.
EXAMPLE 1.11
A commercial airplane flies at 540 mi/h at a standard altitude of 30,000 ft. What is its Mach
number?
Solution
• Approach: Find the “standard” speed of sound; divide it into the velocity, using proper
units.
• Property values: From Table A.6, at 30,000 ft (9144 m), a 303 m/s. Check this
against the standard temperature, estimated from the table to be 229 K. From Eq. (1.38)
for air,
a [kRairT]1/2
[1.4(287)(229)]1/2
303 m/s.
• Solution steps: Convert the airplane velocity to m/s:
V (540 mi/h)[0.44704 m/s/(mi/h)] 241 m/s.
Then the Mach number is given by
Ma V/a (241 m/s)/(303 m/s) 0.80 Ans.
• Comments: This value, Ma 0.80, is typical of present-day commercial airliners.
There are three basic ways to attack a fluid flow problem. They are equally impor-
tant for a student learning the subject, and this book tries to give adequate coverage
to each method:
1. Control-volume, or integral analysis (Chap. 3).
2. Infinitesimal system, or differential analysis (Chap. 4).
3. Experimental study, or dimensional analysis (Chap. 5).
1.10 Basic Flow Analysis
Techniques
40 Chapter 1 Introduction
whi29346_ch01_002-063.qxd 10/14/09 20:02 Page 40 Debd 208:MHDQ176:whi29346:0073529346:whi29346_pagefiles:](https://image.slidesharecdn.com/white09-220921151844-e1802c93/75/Seven-edition-in-fluid-mechanics-White-63-2048.jpg)
![In all cases, the flow must satisfy the three basic laws of mechanics plus a thermo-
dynamic state relation and associated boundary conditions:
1. Conservation of mass (continuity).
2. Linear momentum (Newton’s second law).
3. First law of thermodynamics (conservation of energy).
4. A state relation like (p, T).
5. Appropriate boundary conditions at solid surfaces, interfaces, inlets, and exits.
In integral and differential analyses, these five relations are modeled mathematically
and solved by computational methods. In an experimental study, the fluid itself per-
forms this task without the use of any mathematics. In other words, these laws are
believed to be fundamental to physics, and no fluid flow is known to violate them.
Fluid mechanics is a highly visual subject. The patterns of flow can be visualized in
a dozen different ways, and you can view these sketches or photographs and learn a
great deal qualitatively and often quantitatively about the flow.
Four basic types of line patterns are used to visualize flows:
1. A streamline is a line everywhere tangent to the velocity vector at a given instant.
2. A pathline is the actual path traversed by a given fluid particle.
3. A streakline is the locus of particles that have earlier passed through a
prescribed point.
4. A timeline is a set of fluid particles that form a line at a given instant.
The streamline is convenient to calculate mathematically, while the other three are
easier to generate experimentally. Note that a streamline and a timeline are instan-
taneous lines, while the pathline and the streakline are generated by the passage
of time. The velocity profile shown in Fig. 1.15 is really a timeline generated ear-
lier by a single discharge of bubbles from the wire. A pathline can be found by
a time exposure of a single marked particle moving through the flow. Streamlines
are difficult to generate experimentally in unsteady flow unless one marks a great
many particles and notes their direction of motion during a very short time inter-
val [32]. In steady flow, where velocity varies only with position, the situation
simplifies greatly:
Streamlines, pathlines, and streaklines are identical in steady flow.
In fluid mechanics the most common mathematical result for visualization purposes
is the streamline pattern. Figure 1.16a shows a typical set of streamlines, and
Fig. 1.16b shows a closed pattern called a streamtube. By definition the fluid within
a streamtube is confined there because it cannot cross the streamlines; thus the stream-
tube walls need not be solid but may be fluid surfaces.
Figure 1.17 shows an arbitrary velocity vector. If the elemental arc length dr of a
streamline is to be parallel to V, their respective components must be in proportion:
Streamline: (1.39)
dx
u
dy
v
dz
w
dr
V
1.11 Flow Patterns: Streamlines,
Streaklines, and Pathlines
1.11 Flow Patterns: Streamlines, Streaklines, and Pathlines 41
whi29346_ch01_002-063.qxd 10/14/09 20:02 Page 41 Debd 208:MHDQ176:whi29346:0073529346:whi29346_pagefiles:](https://image.slidesharecdn.com/white09-220921151844-e1802c93/75/Seven-edition-in-fluid-mechanics-White-64-2048.jpg)


![single downward stream against a flat wall. Taken in isolation, the upper right quadrant is
similar to the flow in a 90 corner. This is definitely a realistic flow pattern and is discussed
again in Chap. 8.
Finally note the peculiarity that the two streamlines (C 0) have opposite directions
and intersect. This is possible only at a point where u v w 0, which occurs at the
origin in this case. Such a point of zero velocity is called a stagnation point.
Clever experimentation can produce revealing images of a fluid flow pattern, as shown
earlier in Figs. 1.14a and 1.15. For example, streaklines are produced by the contin-
uous release of marked particles (dye, smoke, or bubbles) from a given point. If the
flow is steady, the streaklines will be identical to the streamlines and pathlines of the
flow.
Some methods of flow visualization include the following [34–36]:
1. Dye, smoke, or bubble discharges.
2. Surface powder or flakes on liquid flows.
3. Floating or neutral-density particles.
4. Optical techniques that detect density changes in gas flows: shadowgraph,
schlieren, and interferometer.
5. Tufts of yarn attached to boundary surfaces.
6. Evaporative coatings on boundary surfaces.
7. Luminescent fluids, additives, or bioluminescence.
8. Particle image velocimetry (PIV).
Figures 1.14a and 1.15 were both visualized by bubble releases. Another example is
the use of particles in Fig. 1.18 to visualize a flow negotiating a 180 turn in a ser-
pentine channel [42].
Figure 1.18a is at a low, laminar Reynolds number of 1000. The flow is steady,
and the particles form streaklines showing that the flow cannot make the sharp turn
without separating away from the bottom wall.
Figure 1.18b is at a higher, turbulent Reynolds number of 30,000. The flow is
unsteady, and the streaklines would be chaotic and smeared, unsuitable for visualiza-
tion. The image is thus produced by the new technique of particle image velocime-
try [37]. In PIV, hundreds of particles are tagged and photographed at two closely
spaced times. Particle movements thus indicate local velocity vectors. These hundreds
of vectors are then smoothed by repeated computer operations until the time-mean
flow pattern in Fig. 1.18b is achieved. Modern flow experiments and numerical mod-
els use computers extensively to create their visualizations, as described in the text
by Yang [38].
Mathematical details of streamline/streakline/pathline analysis are given in Ref. 33.
References 39–41 are beautiful albums of flow photographs. References 34–36 are
monographs on flow visualization techniques.
Fluid mechanics is a marvelous subject for visualization, not just for still (steady)
patterns, but also for moving (unsteady) motion studies. An outstanding list of avail-
able flow movies and videotapes is given by Carr and Young [43].
Flow Visualization
44 Chapter 1 Introduction
whi29346_ch01_002-063.qxd 10/14/09 20:03 Page 44 Debd 208:MHDQ176:whi29346:0073529346:whi29346_pagefiles:](https://image.slidesharecdn.com/white09-220921151844-e1802c93/75/Seven-edition-in-fluid-mechanics-White-67-2048.jpg)

![Most of the examples and exercises in this text are amenable to direct calculation with-
out guessing or iteration or looping. Until recently, only such direct problem assignments,
whether “plug-and-chug” or more subtle, were appropriate for undergraduate engineer-
ing courses. However, the introduction of computer software solvers makes almost any
set of algebraic relations viable for analysis and solution. The solver recommended here
is the Engineering Equation Solver (EES) developed by Klein and Beckman [44].
Any software solver should handle a purely mathematical set of relations, such as
the one posed in Ref. 44: X ln (X) Y3
, X1/2
1/Y. Submit that pair to any commer-
cial solver and you will no doubt receive the answer: X 1.467, Y 0.826. However,
for engineers, in the author’s opinion, EES is superior to most solvers because (1) equa-
tions can be entered in any order; (2) scores of mathematical formulas are built-in, such
as the Bessel functions; and (3) thermophysical properties of many fluids are built-in,
such as the steam tables [23]. Both metric and English units are allowed. Equations
need not be written in the traditional BASIC or FORTRAN style. For example,
X Y 1 0 is perfectly satisfactory; there is no need to retype this as X Y 1.
For example, reconsider Example 1.7 as an EES exercise. One would first enter
the reference properties p0 and 0 plus the curve-fit constants B and n:
Pz 1.0
Rhoz 2.0
B 3000
n 7
Then specify the given pressure ratio and the curve-fit relation, Eq. (1.19), for the
equation of state of water:
P 1100∗Pz
P/Pz (B 1)∗(Rho/Rhoz)^n B
If you request an initial opinion from the CHECK/FORMAT menu, EES states that there
are six equations in six unknowns and there are no obvious difficulties. Then request
SOLVE from the menu and EES quickly prints out Rho 2.091, the correct answer
as seen already in Example 1.6. It also prints out values of the other five variables.
Occasionally EES reports “unable to converge” and states what went wrong (division
by zero, square root of a negative number, etc.). One needs only to improve the guesses
and ranges of the unknowns in Variable Information to assist EES to the solution.
In subsequent chapters we will illustrate some implicit (iterative) examples by
using EES and will also assign some advanced problem exercises for which EES is
an ideal approach. The use of an engineering solver, notably EES, is recommended
to all engineers in this era of the personal computer. If EES is not available, the writer
recommends using an Excel spreadsheet.
Uncertainty is a fact of life in engineering. We rarely know any engineering proper-
ties or variables to an extreme degree of accuracy. The uncertainty of data is normally
defined as the band within which one is 95 percent confident that the true value lies.
Recall from Fig. 1.7 that the uncertainty of the ratio /c was estimated as
20 percent.
1.13 Uncertainty in
Experimental Data
1.12 The Engineering
Equation Solver
46 Chapter 1 Introduction
EES
whi29346_ch01_002-063.qxd 10/14/09 20:03 Page 46 Debd 208:MHDQ176:whi29346:0073529346:whi29346_pagefiles:](https://image.slidesharecdn.com/white09-220921151844-e1802c93/75/Seven-edition-in-fluid-mechanics-White-69-2048.jpg)
![There are whole monographs devoted to the subject of experimental uncertainty
[45–46], so we give only a brief summary here.
All experimental data have uncertainty, separated into two causes: (1) a systematic error
due to the instrument or its environment and (2) a random error due to scatter in repeated
readings. We minimize the systematic error by careful calibration and then estimate the
random error statistically. The judgment of the experimenter is of crucial importance.
Here is the accepted mathematical estimate. Suppose a desired result P depends
upon a single experimental variable x. If x has an uncertainty x, then the uncertainty
P is estimated from the calculus:
If there are multiple variables, P P(x1, x2, x3, xN), the overall uncertainty P is
calculated as a root-mean-square estimate [48]:
(1.41)
This calculation is statistically much more probable than simply adding linearly
the various uncertainties xi, thereby making the unlikely assumption that all
variables simultaneously attain maximum error. Note that it is the responsibility of
the experimenter to establish and report accurate estimates of all the relevant
uncertainties xi.
If the quantity P is a simple power-law expression of the other variables, for exam-
ple, P Const then each derivative in Eq. (1.41) is proportional to P
and the relevant power-law exponent and is inversely proportional to that variable.
If P Const then
Thus, from Eq. (1.41),
(1.42)
Evaluation of P is then a straightforward procedure, as in the following example.
EXAMPLE 1.13
The so-called dimensionless Moody pipe friction factor f, plotted in Fig. 6.13, is calculated
in experiments from the following formula involving pipe diameter D, pressure drop p,
density , volume flow rate Q, and pipe length L:
Measurement uncertainties are given for a certain experiment: D 0.5 percent, p 2.0
percent, 1.0 percent, Q 3.5 percent, and L 0.4 percent. Estimate the overall uncer-
tainty of the friction factor f.
f
2
8
D5
p
Q2
L
P
P
can1
x1
x1
b
2
an2
x2
x2
b
2
an3
x3
x3
b
2
p d
1/2
P
x1
n1P
x1
,
P
x2
n2P
x2
,
P
x3
n3P
x3
,p
x1
n1
x2
n2
x3
n3
. . .,
x1
n1
x2
n2
x3
n3
. . .,
P ca
P
x1
x1b
2
a
P
x2
x2b
2
p a
P
xN
xNb
2
d
1/2
p
P
P
x
x
1.13 Uncertainty in Experimental Data 47
whi29346_ch01_002-063.qxd 10/14/09 20:03 Page 47 Debd 208:MHDQ176:whi29346:0073529346:whi29346_pagefiles:](https://image.slidesharecdn.com/white09-220921151844-e1802c93/75/Seven-edition-in-fluid-mechanics-White-70-2048.jpg)
![48 Chapter 1 Introduction
Solution
The coefficient
2
/8 is assumed to be a pure theoretical number, with no uncertainty. The
other variables may be collected using Eqs. (1.41) and (1.42):
[{5(0.5%)}2
(2.0%)2
(1.0%)2
{2(3.5%)}2
(0.4%)2
]1/2
7.8% Ans.
By far the dominant effect in this particular calculation is the 3.5 percent error in Q, which
is amplified by doubling, due to the power of 2 on flow rate. The diameter uncertainty,
which is quintupled, would have contributed more had D been larger than 0.5 percent.
The road toward a professional engineer’s license has a first stop, the Fundamentals
of Engineering Examination, known as the FE exam. It was formerly known as the
Engineer-in-Training (E-I-T) Examination. This eight-hour national test will probably
soon be required of all engineering graduates, not just for licensure, but as a student assess-
ment tool. The 120-problem four-hour morning session covers many general studies:
Mathematics—15% Ethics and business Material properties—7%
practices—7%
Engineering probability Engineering Fluid mechanics—7%
and statistics—7% economics—8%
Chemistry—9% Engineering Electricity and
mechanics—10% magnetism—9%
Computers—7% Strength of Thermodynamics—7%
materials—7%
For the 60-problem, four-hour afternoon session you may choose one of seven mod-
ules: chemical, civil, electrical, environmental, industrial, mechanical, and other/
general engineering. Note that fluid mechanics is an integral topic of the examination.
Therefore, for practice, this text includes a number of end-of-chapter FE problems
where appropriate.
The format for the FE exam questions is multiple-choice, usually with five selec-
tions, chosen carefully to tempt you with plausible answers if you used incorrect units,
forgot to double or halve something, are missing a factor of
, or the like. In some
cases, the selections are unintentionally ambiguous, such as the following example
from a previous exam:
Transition from laminar to turbulent flow occurs at a Reynolds number of
(A) 900 (B) 1200 (C) 1500 (D) 2100 (E) 3000
The “correct” answer was graded as (D), Re 2100. Clearly the examiner was think-
ing, but forgot to specify, Red for flow in a smooth circular pipe, since (see Chaps. 6
and 7) transition is highly dependent on geometry, surface roughness, and the length
scale used in the definition of Re. The moral is not to get peevish about the exam but
simply to go with the flow (pun intended) and decide which answer best fits an under-
graduate training situation. Every effort has been made to keep the FE exam ques-
tions in this text unambiguous.
1.14 The Fundamentals of
Engineering (FE) Examination
U
f
f
ca5
D
D
b
2
a1
p
p
b
2
a1
b
2
a2
Q
Q
b
2
a1
L
L
b
2
d
1/2
whi29346_ch01_002-063.qxd 10/14/09 20:03 Page 48 Debd 208:MHDQ176:whi29346:0073529346:whi29346_pagefiles:](https://image.slidesharecdn.com/white09-220921151844-e1802c93/75/Seven-edition-in-fluid-mechanics-White-71-2048.jpg)
![Problems 49
Problems
Most of the problems herein are fairly straightforward. More
difficult or open-ended assignments are labeled with an aster-
isk as in Prob. 1.18. Problems labeled with an EES icon
(for example, Prob. 1.61) will benefit from the use of the Engi-
neering Equation Solver (EES), while problems labeled with a
computer icon may require the use of a computer. The stan-
dard end-of-chapter problems 1.1 to 1.90 (categorized in the
problem list below) are followed by fundamentals of engineer-
ing (FE) exam problems FE1.1 to FE1.10 and comprehensive
problems C1.1 to C1.12.
Problem Distribution
Section Topic Problems
1.1, 1.4, 1.5 Fluid continuum concept 1.1–1.4
1.6 Dimensions and units 1.5–1.23
1.8 Thermodynamic properties 1.24–1.37
1.9 Viscosity, no-slip condition 1.38–1.61
1.9 Surface tension 1.62–1.71
1.9 Vapor pressure; cavitation 1.72–1.74
1.9 Speed of sound, Mach number 1.75–1.80
1.11 Streamlines 1.81–1.83
1.2 History of fluid mechanics 1.84–1.85a–n
1.13 Experimental uncertainty 1.86–1.90
The concept of a fluid
P1.1 A gas at 20C may be considered rarefied, deviating from
the continuum concept, when it contains less than 1012
molecules per cubic millimeter. If Avogadro’s number is
6.023 E23 molecules per mole, what absolute pressure (in
Pa) for air does this represent?
P1.2 Table A.6 lists the density of the standard atmosphere as
a function of altitude. Use these values to estimate,
crudely—say, within a factor of 2—the number of mole-
cules of air in the entire atmosphere of the earth.
P1.3 For the triangular element in Fig. P1.3, show that a tilted
free liquid surface, in contact with an atmosphere at pres-
sure pa, must undergo shear stress and hence begin to
flow. Hint: Account for the weight of the fluid and show
that a no-shear condition will cause horizontal forces to
be out of balance.
P1.3
pa
Fluid density
EES
P1.4 Sand, and other granular materials, appear to flow; that is,
you can pour them from a container or a hopper. There are
whole textbooks on the “transport” of granular materials
[54]. Therefore, is sand a fluid ? Explain.
Dimensions and units
P1.5 The mean free path of a gas, l, is defined as the aver-
age distance traveled by molecules between collisions.
A proposed formula for estimating l of an ideal gas is
What are the dimensions of the constant 1.26? Use the
formula to estimate the mean free path of air at 20C
and 7 kPa. Would you consider air rarefied at this
condition?
P1.6 The Saybolt Universal Viscometer, now outdated but
still sold in scientific catalogs, measures the kinematic
viscosity of lubricants [Ref. 49, p. 40]. A specialized
container, held at constant temperature, is filled with
the test fluid. Measure the time t for 60 ml of the fluid
to drain from a small hole or short tube in the bottom.
This time unit, called Saybolt universal seconds, or
SUS, is correlated with kinematic viscosity , in cen-
tistokes (1 stoke 1 cm2
/s), by the following curve-fit
formula:
(a) Comment on the dimensionality of this equation.
(b) Is the formula physically correct? (c) Since varies
strongly with temperature, how does temperature enter
into the formula? (d) Can we easily convert from cen-
tistokes to mm2
/s?
P1.7 Convert the following inappropriate quantities into SI
units: (a) a velocity of 5937 yards per hour; (b) a volume
flow rate of 4903 acre-feet of water per week; and (c) the
mass flow rate of 25,616 gallons per day of SAE 30W oil
at 20ºC.
P1.8 Suppose we know little about the strength of materials
but are told that the bending stress in a beam is pro-
portional to the beam half-thickness y and also depends
on the bending moment M and the beam area moment
of inertia I. We also learn that, for the particular case
M 2900 in lbf, y 1.5 in, and I 0.4 in4
, the pre-
dicted stress is 75 MPa. Using this information and
dimensional reasoning only, find, to three significant
figures, the only possible dimensionally homogeneous
formula y f (M, I).
0.215t
145
t
for 40 t 100 SUS
l 1.26
1RT
whi29346_ch01_002-063.qxd 10/14/09 20:03 Page 49 Debd 208:MHDQ176:whi29346:0073529346:whi29346_pagefiles:](https://image.slidesharecdn.com/white09-220921151844-e1802c93/75/Seven-edition-in-fluid-mechanics-White-72-2048.jpg)
![P1.9 An inverted conical container, 26 in in diameter and 44
in high, is filled with a liquid at 20C and weighed. The
liquid weight is found to be 5030 ounces. (a) What is
the density of the fluid, in kg/m3
? (b) What fluid might
this be? Assume standard gravity, g 9.807 m/s2
.
P1.10 The Stokes-Oseen formula [33] for drag force F on a
sphere of diameter D in a fluid stream of low velocity V,
density , and viscosity is
Is this formula dimensionally homogeneous?
P1.11 In English Engineering units, the specific heat cp of air
at room temperature is approximately 0.24 Btu/(lbm-F).
When working with kinetic energy relations, it is more
appropriate to express cp as a velocity-squared per
absolute degree. Give the numerical value, in this form,
of cp for air in (a) SI units, and (b) BG units.
P1.12 For low-speed (laminar) steady flow through a circular
pipe, as shown in Fig. P1.12, the velocity u varies with
radius and takes the form
where is the fluid viscosity and p is the pressure drop
from entrance to exit. What are the dimensions of the con-
stant B?
P1.12
P1.13 The efficiency](https://image.slidesharecdn.com/white09-220921151844-e1802c93/75/Seven-edition-in-fluid-mechanics-White-73-2048.jpg)

![Q p
input power
u B
p
(r0
2
r2
)
F 3
DV
9
16
V2
D2
where Q is the volume rate of flow and p is the pres-
sure rise produced by the pump. Suppose that a certain
pump develops a pressure rise of 35 lbf/in2
when its flow
rate is 40 L/s. If the input power is 16 hp, what is the effi-
ciency?
*P1.14 Figure P1.14 shows the flow of water over a dam. The
volume flow Q is known to depend only on crest
width B, acceleration of gravity g, and upstream water
height H above the dam crest. It is further known that
Q is proportional to B. What is the form of the only
possible dimensionally homogeneous relation for this
flow rate?
P1.14
P1.15 Mott [49] recommends the following formula for the fric-
tion head loss hf, in ft, for flow through a pipe of length
L and diameter D (both must be in ft):
where Q is the volume flow rate in ft3
/s, A is the pipe
cross-section area in ft2
, and Ch is a dimensionless coef-
ficient whose value is approximately 100. Determine the
dimensions of the constant 0.551.
P1.16 Algebraic equations such as Bernoulli’s relation, Eq. (1)
of Example 1.3, are dimensionally consistent, but what
about differential equations? Consider, for example, the
boundary-layer x-momentum equation, first derived by
Ludwig Prandtl in 1904:
where is the boundary-layer shear stress and gx is the
component of gravity in the x direction. Is this equation
dimensionally consistent? Can you draw a general
conclusion?
u
u
x
u
y
p
x
gx
y
hf La
Q
0.551AChD0.63b
1.852
H
B
Q
Water level
Dam
50 Chapter 1 Introduction
r = 0
r
u (r)
Pipe wall
r = r0
whi29346_ch01_002-063.qxd 10/14/09 20:04 Page 50 Debd 208:MHDQ176:whi29346:0073529346:whi29346_pagefiles:](https://image.slidesharecdn.com/white09-220921151844-e1802c93/75/Seven-edition-in-fluid-mechanics-White-75-2048.jpg)
![P1.17 The Hazen-Williams hydraulics formula for volume rate
of flow Q through a pipe of diameter D and length L is
given by
where p is the pressure drop required to drive the flow.
What are the dimensions of the constant 61.9? Can this
formula be used with confidence for various liquids and
gases?
*P1.18 For small particles at low velocities, the first term in the
Stokes-Oseen drag law, Prob. 1.10, is dominant; hence,
F KV, where K is a constant. Suppose a particle of
mass m is constrained to move horizontally from the
initial position x 0 with initial velocity V0. Show
(a) that its velocity will decrease exponentially with
time and (b) that it will stop after traveling a distance
x mV0 /K.
P1.19 In his study of the circular hydraulic jump formed by a
faucet flowing into a sink, Watson [53] proposed a param-
eter combining volume flow rate Q, density , and vis-
cosity of the fluid, and depth h of the water in the sink.
He claims that his grouping is dimensionless, with Q in
the numerator. Can you verify this?
P1.20 Books on porous media and atomization claim that the
viscosity and surface tension of a fluid can be com-
bined with a characteristic velocity U to form an impor-
tant dimensionless parameter. (a) Verify that this is so.
(b) Evaluate this parameter for water at 20C and a
velocity of 3.5 cm/s. Note: You get extra credit if you
know the name of this parameter.
P1.21 In 1908, Prandtl’s student, Heinrich Blasius, proposed the
following formula for the wall shear stress at a position
x in viscous flow at velocity V past a flat surface:
Determine the dimensions of the constant 0.332.
P1.22 The Ekman number, Ek, arises in geophysical fluid dynam-
ics. It is a dimensionless parameter combining seawater
density , a characteristic length L, seawater viscosity ,
and the Coriolis frequency
sin, where
is the rotation
rate of the earth and is the latitude angle. Determine the
correct form of Ek if the viscosity is in the numerator.
P1.23 During World War II, Sir Geoffrey Taylor, a British fluid
dynamicist, used dimensional analysis to estimate the
energy released by an atomic bomb explosion. He
assumed that the energy released E, was a function of
blast wave radius R, air density , and time t. Arrange
these variables into a single dimensionless group, which
we may term the blast wave number.
w 0.332 1/2
1/2
V3/2
x1/2
w
Q 61.9D2.63
a
p
L
b
0.54
Thermodynamic properties
P1.24 Air, assumed to be an ideal gas with k 1.40, flows isen-
tropically through a nozzle. At section 1, conditions are
sea level standard (see Table A.6). At section 2, the tem-
perature is 50C. Estimate (a) the pressure, and (b) the
density of the air at section 2.
P1.25 A tank contains 0.9 m3
of helium at 200 kPa and 20C.
Estimate the total mass of this gas, in kg, (a) on earth and
(b) on the moon. Also, (c) how much heat transfer, in MJ,
is required to expand this gas at constant temperature to
a new volume of 1.5 m3
?
P1.26 When we in the United States say a car’s tire is filled “to
32 lb,” we mean that its internal pressure is 32 lbf/in2
above the ambient atmosphere. If the tire is at sea level,
has a volume of 3.0 ft3
, and is at 75F, estimate the total
weight of air, in lbf, inside the tire.
P1.27 For steam at 40 lbf/in2
, some values of temperature and
specific volume are as follows, from Ref. 23:
T, F 400 500 600 700 800
v, ft3
/lbm 12.624 14.165 15.685 17.195 18.699
Is steam, for these conditions, nearly a perfect gas, or is it
wildly nonideal? If reasonably perfect, find a least-squares†
value for the gas constant R, in m2
/(s2
K); estimate the
percentage error in this approximation; and compare with
Table A.4.
P1.28 Wet atmospheric air at 100 percent relative humidity con-
tains saturated water vapor and, by Dalton’s law of par-
tial pressures,
patm pdry air pwater vapor
Suppose this wet atmosphere is at 40C and 1 atm.
Calculate the density of this 100 percent humid air, and
compare it with the density of dry air at the same
conditions.
P1.29 A compressed-air tank holds 5 ft3
of air at 120 lbf/in2
“gage,” that is, above atmospheric pressure. Estimate the
energy, in ft-lbf, required to compress this air from the
atmosphere, assuming an ideal isothermal process.
P1.30 Repeat Prob. 1.29 if the tank is filled with compressed
water instead of air. Why is the result thousands of times
less than the result of 215,000 ft lbf in Prob. 1.29?
P1.31 One cubic foot of argon gas at 10C and 1 atm is com-
pressed isentropically to a pressure of 600 kPa. (a) What
will be its new pressure and temperature? (b) If it is
allowed to cool at this new volume back to 10C, what
will be the final pressure?
Problems 51
†
The concept of “least-squares” error is very important and should
be learned by everyone.
whi29346_ch01_002-063.qxd 10/14/09 20:04 Page 51 Debd 208:MHDQ176:whi29346:0073529346:whi29346_pagefiles:](https://image.slidesharecdn.com/white09-220921151844-e1802c93/75/Seven-edition-in-fluid-mechanics-White-76-2048.jpg)
![P1.32 A blimp is approximated by a prolate spheroid 90 m long
and 30 m in diameter. Estimate the weight of 20C gas
within the blimp for (a) helium at 1.1 atm and (b) air at
1.0 atm. What might the difference between these two
values represent (see Chap. 2)?
P1.33 Experimental data [55] for the density of n-pentane liquid
for high pressures, at 50C, are listed as follows:
Pressure, MPa 0.01 10.23 20.70 34.31
Density, kg/m3
586.3 604.1 617.8 632.8
Interestingly, this data does not fit the author’s suggested
liquid state relation, Eq. (1.19), very well. Therefore
(a) fit the data, as best you can, to a second-order
polynomial. Use your curve-fit to estimate (b) the bulk
modulus of n-pentane at 1 atm, and (c) the speed of sound
of n-pentane at a pressure of 25 MPa.
P1.34 Consider steam at the following state near the saturation
line: (p1, T1) (1.31 MPa, 290C). Calculate and com-
pare, for an ideal gas (Table A.4) and the steam tables (or
the EES software), (a) the density 1 and (b) the density
2 if the steam expands isentropically to a new pressure
of 414 kPa. Discuss your results.
P1.35 In Table A.4, most common gases (air, nitrogen, oxygen,
hydrogen) have a specific heat ratio k 1.40. Why do
argon and helium have such high values? Why does NH3
have such a low value? What is the lowest k for any gas
that you know of?
P1.36 The isentropic bulk modulus B of a fluid is defined in Eq.
(1.38). (a) What are its dimensions? Using theoretical p-
relations for a gas or liquid, estimate the bulk modulus,
in Pa, of (b) chlorine at 100C and 10 atm; and (c) water,
at 20C and 1000 atm.
P1.37 A near-ideal gas has a molecular weight of 44 and a spe-
cific heat cv 610 J/(kg K). What are (a) its specific
heat ratio, k, and (b) its speed of sound at 100C?
Viscosity, no-slip condition
P1.38 In Fig. 1.8, if the fluid is glycerin at 20C and the width
between plates is 6 mm, what shear stress (in Pa) is
required to move the upper plate at 5.5 m/s? What is the
Reynolds number if L is taken to be the distance between
plates?
P1.39 Knowing for air at 20C from Table 1.4, estimate its
viscosity at 500C by (a) the power law and (b) the Suther-
land law. Also make an estimate from (c) Fig. 1.7. Compare
with the accepted value of 3.58 E-5 kg/m s.
*P1.40 For liquid viscosity as a function of temperature, a sim-
plification of the log-quadratic law of Eq. (1.30) is
Andrade’s equation [21], A exp (B/T), where (A, B)
are curve-fit constants and T is absolute temperature. Fit
this relation to the data for water in Table A.1 and esti-
mate the percentage error of the approximation.
P1.41 An aluminum cylinder weighing 30 N, 6 cm in diameter
and 40 cm long, is falling concentrically through a long
vertical sleeve of diameter 6.04 cm. The clearance is filled
with SAE 50 oil at 20C. Estimate the terminal (zero
acceleration) fall velocity. Neglect air drag and assume a
linear velocity distribution in the oil. Hint: You are given
diameters, not radii.
P1.42 Experimental values for the viscosity of helium at 1 atm
are as follows:
T, K 200 400 600 800 1000 1200
, kg/(ms) 1.50 E-5 2.43 E-5 3.20 E-5 3.88 E-5 4.50 E-5 5.08 E-5
Fit these values to either (a) a power law or (b) the
Sutherland law, Eq. (1.29).
P1.43 For the flow of gas between two parallel plates of Fig.
1.8, reanalyze for the case of slip flow at both walls. Use
the simple slip condition, uwall (du/dy)wall, where
is the mean free path of the fluid. Sketch the expected
velocity profile and find an expression for the shear stress
at each wall.
P1.44 SAE 50 oil at 20C fills the concentric annular space
between an inner cylinder, ri 5 cm, and an outer
cylinder, ro 6 cm. The length of the cylinders is 120 cm.
If the outer cylinder is fixed and the inner cylinder
rotates at 900 rev/min, use the linear profile approxi-
mation to estimate the power, in watts, required to
maintain the rotation. Neglect any temperature change
of the oil.
P1.45 A block of weight W slides down an inclined plane
while lubricated by a thin film of oil, as in Fig. P1.45.
The film contact area is A and its thickness is h. Assum-
ing a linear velocity distribution in the film, derive an
expression for the “terminal” (zero-acceleration) veloc-
ity V of the block. Find the terminal velocity of the
block if the block mass is 6 kg, A 35 cm2
, 15,
and the film is 1-mm-thick SAE 30 oil at 20C.
P1.45
Liquid film of
thickness h
W
V Block contact
area A
52 Chapter 1 Introduction
whi29346_ch01_002-063.qxd 10/14/09 20:04 Page 52 Debd 208:MHDQ176:whi29346:0073529346:whi29346_pagefiles:](https://image.slidesharecdn.com/white09-220921151844-e1802c93/75/Seven-edition-in-fluid-mechanics-White-77-2048.jpg)
![P1.46 A simple and popular model for two nonnewtonian fluids
in Fig. 1.9a is the power-law:
where C and n are constants fit to the fluid [16]. From Fig.
1.9a, deduce the values of the exponent n for which the fluid
is (a) newtonian, (b) dilatant, and (c) pseudoplastic. Con-
sider the specific model constant C 0.4 N sn
/m2
, with
the fluid being sheared between two parallel plates as in
Fig. 1.8. If the shear stress in the fluid is 1200 Pa, find
the velocity V of the upper plate for the cases (d) n 1.0,
(e) n 1.2, and (f ) n 0.8.
P1.47 Data for the apparent viscosity of average human blood,
at normal body temperature of 37C, varies with shear
strain rate, as shown in the following table.
Strain rate, s1
1 10 100 1000
Apparent viscosity, 0.011 0.009 0.006 0.004
kg/(m s)
(a) Is blood a nonnewtonian fluid? (b) If so, what type of
fluid is it? (c) How do these viscosities compare with
plain water at 37C?
P1.48 A thin plate is separated from two fixed plates by very
viscous liquids 1 and 2, respectively, as in Fig. P1.48.
The plate spacings h1 and h2 are unequal, as shown. The
contact area is A between the center plate and each fluid.
(a) Assuming a linear velocity distribution in each fluid,
derive the force F required to pull the plate at velocity V.
(b) Is there a necessary relation between the two viscosi-
ties, 1 and 2?
P1.48
P1.49 An amazing number of commercial and laboratory
devices have been developed to measure fluid viscosity,
as described in Refs. 29 and 49. Consider a concentric
shaft, fixed axially and rotated inside the sleeve. Let the
inner and outer cylinders have radii ri and ro, respec-
tively, with total sleeve length L. Let the rotational rate
h1
h2
1
2
F, V
C a
du
dy
b
n
be (rad/s) and the applied torque be M. Using these
parameters, derive a theoretical relation for the viscosity
of the fluid between the cylinders.
P1.50 A simple viscometer measures the time t for a solid sphere
to fall a distance L through a test fluid of density . The
fluid viscosity is then given by
where D is the sphere diameter and Wnet is the sphere net
weight in the fluid. (a) Prove that both of these formulas
are dimensionally homogeneous. (b) Suppose that a 2.5 mm
diameter aluminum sphere (density 2700 kg/m3
) falls in an
oil of density 875 kg/m3
. If the time to fall 50 cm is 32 s,
estimate the oil viscosity and verify that the inequality is
valid.
P1.51 An approximation for the boundary-layer shape in Figs.
1.6b and P1.51 is the formula
where U is the stream velocity far from the wall and is
the boundary layer thickness, as in Fig. P.151. If the fluid
is helium at 20C and 1 atm, and if U 10.8 m/s and
3 cm, use the formula to (a) estimate the wall shear
stress w in Pa, and (b) find the position in the boundary
layer where is one-half of w.
P1.51
P1.52 The belt in Fig. P1.52 moves at a steady velocity V and
skims the top of a tank of oil of viscosity , as shown.
U
y
0
u(y)
y ␦
u(y) U sina
y
2
b, 0 y
Wnett
3
DL
if t](https://image.slidesharecdn.com/white09-220921151844-e1802c93/75/Seven-edition-in-fluid-mechanics-White-78-2048.jpg)

![Assuming a linear velocity profile in the oil, develop a
simple formula for the required belt-drive power P as
a function of (h, L, V, b, ). What belt-drive power P,
in watts, is required if the belt moves at 2.5 m/s over
SAE 30W oil at 20C, with L 2 m, b 60 cm, and
h 3 cm?
*P1.53 A solid cone of angle 2, base r0, and density c is rotat-
ing with initial angular velocity 0 inside a conical seat,
as shown in Fig. P1.53. The clearance h is filled with oil
of viscosity . Neglecting air drag, derive an analytical
expression for the cone’s angular velocity (t) if there is
no applied torque.
P1.53
*P1.54 A disk of radius R rotates at an angular velocity inside
a disk-shaped container filled with oil of viscosity , as
shown in Fig. P1.54. Assuming a linear velocity profile
and neglecting shear stress on the outer disk edges, derive
a formula for the viscous torque on the disk.
P1.54
P1.55 A block of weight W is being pulled over a table by another
weight Wo, as shown in Fig. P1.55. Find an algebraic
R R
Clearance
h
Oil
Ω
Oil
h
Base
radius r0
ω(t)
2θ
formula for the steady velocity U of the block if it slides
on an oil film of thickness h and viscosity . The block
bottom area A is in contact with the oil. Neglect the cord
weight and the pulley friction. Assume a linear velocity
profile in the oil film.
P1.55
*P1.56 The device in Fig. P1.56 is called a cone-plate viscome-
ter [29]. The angle of the cone is very small, so that sin
, and the gap is filled with the test liquid. The
torque M to rotate the cone at a rate is measured.
Assuming a linear velocity profile in the fluid film, derive
an expression for fluid viscosity as a function of (M,
R, , ).
P1.56
P1.57 Extend the steady flow between a fixed lower plate
and a moving upper plate, from Fig. 1.8, to the case
of two immiscible liquids between the plates, as in
Fig. P1.57.
P1.57
h2
y
x h1 1
2
V
Fixed
Ω
Fluid
R
U
W
Wo
h
54 Chapter 1 Introduction
whi29346_ch01_002-063.qxd 10/14/09 20:04 Page 54 Debd 208:MHDQ176:whi29346:0073529346:whi29346_pagefiles:](https://image.slidesharecdn.com/white09-220921151844-e1802c93/75/Seven-edition-in-fluid-mechanics-White-80-2048.jpg)
![(a) Sketch the expected no-slip velocity distribution u(y)
between the plates. (b) Find an analytic expression for the
velocity U at the interface between the two liquid layers.
(c) What is the result of (b) if the viscosities and layer
thicknesses are equal?
*P1.58 The laminar pipe flow example of Prob. 1.12 can be used
to design a capillary viscometer [29]. If Q is the volume
flow rate, L is the pipe length, and p is the pressure drop
from entrance to exit, the theory of Chap. 6 yields a for-
mula for viscosity:
Pipe end effects are neglected [29]. Suppose our capil-
lary has r0 2 mm and L 25 cm. The following flow
rate and pressure drop data are obtained for a certain
fluid:
Q, m3
/h 0.36 0.72 1.08 1.44 1.80
p, kPa 159 318 477 1274 1851
What is the viscosity of the fluid? Note: Only the first
three points give the proper viscosity. What is peculiar
about the last two points, which were measured
accurately?
P1.59 A solid cylinder of diameter D, length L, and density s
falls due to gravity inside a tube of diameter D0. The
clearance, D0 D D, is filled with fluid of density
and viscosity . Neglect the air above and below the
cylinder. Derive a formula for the terminal fall velocity of
the cylinder. Apply your formula to the case of a steel
cylinder, D 2 cm, D0 2.04 cm, L 15 cm, with a
film of SAE 30 oil at 20C.
P1.60 Pipelines are cleaned by pushing through them a close-
fitting cylinder called a pig. The name comes from the
squealing noise it makes sliding along. Reference 50
describes a new nontoxic pig, driven by compressed air,
for cleaning cosmetic and beverage pipes. Suppose the
pig diameter is 5-15/16 in and its length 26 in. It cleans
a 6-in-diameter pipe at a speed of 1.2 m/s. If the
clearance is filled with glycerin at 20C, what pressure
difference, in pascals, is needed to drive the pig?
Assume a linear velocity profile in the oil and neglect
air drag.
*P1.61 An air-hockey puck has a mass of 50 g and is 9 cm in
diameter. When placed on the air table, a 20C air film,
of 0.12-mm thickness, forms under the puck. The puck
is struck with an initial velocity of 10 m/s. Assuming a
linear velocity distribution in the air film, how long will
it take the puck to (a) slow down to 1 m/s and (b) stop
r4
0 p
8LQ
completely? Also, (c) how far along this extremely long
table will the puck have traveled for condition (a)?
Surface tension
P1.62 The hydrogen bubbles that produced the velocity profiles
in Fig. 1.15 are quite small, D 0.01 mm. If the
hydrogen–water interface is comparable to air–water and
the water temperature is 30C, estimate the excess
pressure within the bubble.
P1.63 Derive Eq. (1.33) by making a force balance on the fluid
interface in Fig. 1.11c.
P1.64 Determine the maximum diameter, in milliliters, of a solid
aluminum ball, density o 2700 kg/m3
, which will float
on a clean water-air surface at 20C.
P1.65 The system in Fig. P1.65 is used to calculate the
pressure p1 in the tank by measuring the 15-cm height
of liquid in the 1-mm-diameter tube. The fluid is at
60C. Calculate the true fluid height in the tube and the
percentage error due to capillarity if the fluid is
(a) water or (b) mercury.
P1.65
P1.66 A thin wire ring, 3 cm in diameter, is lifted from a water
surface at 20C. Neglecting the wire weight, what is the
force required to lift the ring? Is this a good way to meas-
ure surface tension? Should the wire be made of any par-
ticular material?
P1.67 A vertical concentric annulus, with outer radius ro and inner
radius ri, is lowered into a fluid of surface tension and
contact angle 90. Derive an expression for the capil-
lary rise h in the annular gap if the gap is very narrow.
*P1.68 Make an analysis of the shape (x) of the water–air inter-
face near a plane wall, as in Fig. P1.68, assuming that the
slope is small, R1
d2](https://image.slidesharecdn.com/white09-220921151844-e1802c93/75/Seven-edition-in-fluid-mechanics-White-81-2048.jpg)


![Problems 57
P1.82 A velocity field is given by u V cos, v V sin, and
w 0, where V and are constants. Derive a formula for
the streamlines of this flow.
*P1.83 A two-dimensional unsteady velocity field is given by u
x(1 2t), v y. Find the equation of the time-varying
streamlines that all pass through the point (x0, y0) at some
time t. Sketch a few of these.
History of fluid mechanics
P1.84 In the early 1900s, the British chemist Sir Cyril Hinshel-
wood quipped that fluid dynamics study was divided into
“workers who observed things they could not explain and
workers who explained things they could not observe.” To
what historic situation was he referring?
P1.85 Do some reading and report to the class on the life and
achievements, especially vis-à-vis fluid mechanics, of
(a) Evangelista Torricelli (1608–1647)
(b) Henri de Pitot (1695–1771)
(c) Antoine Chézy (1718–1798)
(d) Gotthilf Heinrich Ludwig Hagen (1797–1884)
(e) Julius Weisbach (1806–1871)
(f) George Gabriel Stokes (1819–1903)
(g) Moritz Weber (1871–1951)
(h) Theodor von Kármán (1881–1963)
(i) Paul Richard Heinrich Blasius (1883–1970)
(j) Ludwig Prandtl (1875–1953)
(k) Osborne Reynolds (1842–1912)
(l) John William Strutt, Lord Rayleigh (1842–1919)
(m) Daniel Bernoulli (1700–1782)
(n) Leonhard Euler (1707–1783)
Experimental uncertainty
P1.86 A right circular cylinder volume is to be calculated from
the measured base radius R and height H. If the uncer-
tainty in R is 2 percent and the uncertainty in H is
3 percent, estimate the overall uncertainty in the calcu-
lated volume.
P1.87 A dimensionless parameter, important in natural convec-
tion heat transfer of fluids, is the Grashof number:
where g is the acceleration of gravity, is the thermal
expansion coefficient, the density, L a characteristic
length, T a temperature difference, and the viscos-
ity. If the uncertainty of each of these variables is
2
percent, determine the overall uncertainty of the
Grashof number.
P1.88 The device in Fig. P1.54 is called a rotating disk
viscometer [29]. Suppose that R 5 cm and h 1 mm.
(a) If the torque required to rotate the disk at 900 r/min
is 0.537 N m, what is the viscosity of the fluid? (b) If
the uncertainty in each parameter (M, R, h, ) is
1 per-
cent, what is the overall uncertainty in the viscosity?
P1.89 For the cone-plate viscometer of Fig. P1.56, suppose R
6 cm and 3. (a) If the torque required to rotate the
cone is 0.157 N m, what is the viscosity of the fluid?
(b) If the uncertainty in each parameter (M, R, , )
is
2 percent, what is the overall uncertainty in the
viscosity?
P1.90 The dimensionless drag coefficient C D of a sphere, to be
studied in Chaps. 5 and 7, is
where F is the drag force, the fluid density, V the fluid
velocity, and D the sphere diameter. If the uncertainties
of these variables are F (
3 percent), (
1.5 percent),
V (
2 percent), and D (
1 percent), what is the overall
uncertainty in the measured drag coefficient?
CD
F
(1/2)V2
(
/4)D2
Gr
g 2
L3
T
2
Fundamentals of Engineering Exam Problems
FE1.1 The absolute viscosity of a fluid is primarily a
function of
(a) Density, (b) Temperature, (c) Pressure, (d) Velocity,
(e) Surface tension
FE1.2 Carbon dioxide, at 20C and 1 atm, is compressed
isentropically to 4 atm. Assume CO2 is an ideal gas.
The final temperature would be
(a) 130C, (b) 162C, (c) 171C, (d) 237C, (e) 313C
FE1.3 Helium has a molecular weight of 4.003. What is the
weight of 2 m3
of helium at 1 atm and 20C?
(a) 3.3 N, (b) 6.5 N, (c) 11.8 N, (d) 23.5 N, (e) 94.2 N
FE1.4 An oil has a kinematic viscosity of 1.25 E-4 m2
/s and
a specific gravity of 0.80. What is its dynamic (absolute)
viscosity in kg/(m s)?
(a) 0.08, (b) 0.10, (c) 0.125, (d) 1.0, (e) 1.25
FE1.5 Consider a soap bubble of diameter 3 mm. If the sur-
face tension coefficient is 0.072 N/m and external
pressure is 0 Pa gage, what is the bubble’s internal
gage pressure?
(a) 24 Pa, (b) 48 Pa, (c) 96 Pa, (d) 192 Pa,
(e) 192 Pa
whi29346_ch01_002-063.qxd 10/14/09 20:05 Page 57 Debd 208:MHDQ176:whi29346:0073529346:whi29346_pagefiles:](https://image.slidesharecdn.com/white09-220921151844-e1802c93/75/Seven-edition-in-fluid-mechanics-White-85-2048.jpg)


![Using your best interpolating skills, estimate the shear
stress in the oil (a) at the wall and (b) at y 15 mm.
C1.8 A mechanical device that uses the rotating cylinder of
Fig. C1.6 is the Stormer viscometer [29]. Instead of being
driven at constant
, a cord is wrapped around the shaft
and attached to a falling weight W. The time t to turn the
shaft a given number of revolutions (usually five) is
measured and correlated with viscosity. The formula is
where A and B are constants that are determined by cali-
brating the device with a known fluid. Here are calibra-
tion data for a Stormer viscometer tested in glycerol,
using a weight of 50 N:
, kg/m-s 0.23 0.34 0.57 0.84 1.15
t, sec 15 23 38 56 77
(a) Find reasonable values of A and B to fit this calibra-
tion data. Hint: The data are not very sensitive to the
value of B.
(b) A more viscous fluid is tested with a 100 N weight and
the measured time is 44 s. Estimate the viscosity of this
fluid.
C1.9 The lever in Fig. C1.9 has a weight W at one end and is
tied to a cylinder at the left end. The cylinder has negli-
gible weight and buoyancy and slides upward through a
film of heavy oil of viscosity . (a) If there is no acceler-
ation (uniform lever rotation), derive a formula for the rate
of fall V2 of the weight. Neglect the lever weight. Assume
a linear velocity profile in the oil film. (b) Estimate the fall
velocity of the weight if W 20 N, L1 75 cm, L2
50 cm, D 10 cm, L 22 cm, R 1 mm, and the oil
is glycerin at 20C.
C1.9
C1.10 A popular gravity-driven instrument is the Cannon-
Ubbelohde viscometer, shown in Fig. C1.10. The test
L1 L2
V1
V2?
Cylinder, diameter D, length L,
in an oil film of thickness ⌬R.
pivot
W
t
A
W B
liquid is drawn up above the bulb on the right side and
allowed to drain by gravity through the capillary tube
below the bulb. The time t for the meniscus to pass
from upper to lower timing marks is recorded. The
kinematic viscosity is computed by the simple formula:
Ct
where C is a calibration constant. For in the range of
100–500 mm2
/s, the recommended constant is C
0.50 mm2
/s2
, with an accuracy less than 0.5 percent.
(a) What liquids from Table A.3 are in this viscosity
range? (b) Is the calibration formula dimensionally con-
sistent? (c) What system properties might the constant C
depend upon? (d) What problem in this chapter hints at a
formula for estimating the viscosity?
C1.11 Mott [Ref. 49, p. 38] discusses a simple falling-ball vis-
cometer, which we can analyze later in Chapter 7. A small
ball of diameter D and density b falls though a tube of
test liquid (, ). The fall velocity V is calculated by the
time to fall a measured distance. The formula for calcu-
lating the viscosity of the fluid is
This result is limited by the requirement that the
Reynolds number (VD/) be less than 1.0. Suppose a steel
ball (SG 7.87) of diameter 2.2 mm falls in SAE 25W oil
(SG 0.88) at 20C. The measured fall velocity is 8.4 cm/s.
(a) What is the viscosity of the oil, in kg/m-s? (b) Is the
Reynolds number small enough for a valid estimate?
C1.12 A solid aluminum disk (SG 2.7) is 2 in in diameter and
3/16 in thick. It slides steadily down a 14 incline that is
coated with a castor oil (SG 0.96) film one hundredth
of an inch thick. The steady slide velocity is 2 cm/s. Using
Figure A.1 and a linear oil velocity profile assumption,
estimate the temperature of the castor oil.
(b )gD2
18 V
Upper timing mark
Lower timing mark
Capillary tube
60 Chapter 1 Introduction
C1.10 The Cannon-Ubbe-
lohde viscometer. [Cour-
tesy of Cannon Instrument
Company.]
whi29346_ch01_002-063.qxd 10/14/09 20:05 Page 60 Debd 208:MHDQ176:whi29346:0073529346:whi29346_pagefiles:](https://image.slidesharecdn.com/white09-220921151844-e1802c93/75/Seven-edition-in-fluid-mechanics-White-88-2048.jpg)


![2.3 Hydrostatic Pressure Distributions 73
Separate the variables and integrate between points 1 and 2:
(2.17)
The integral over z requires an assumption about the temperature variation T(z). One
common approximation is the isothermal atmosphere, where T T0:
(2.18)
The quantity in brackets is dimensionless. (Think that over; it must be dimensionless,
right?) Equation (2.18) is a fair approximation for earth, but actually the earth’s mean
atmospheric temperature drops off nearly linearly with z up to an altitude of about
36,000 ft (11,000 m):
(2.19)
Here T0 is sea-level temperature (absolute) and B is the lapse rate, both of which vary
somewhat from day to day.
By international agreement [1] the following standard values are assumed to apply
from 0 to 36,000 ft:
This lower portion of the atmosphere is called the troposphere. Introducing Eq. (2.19)
into (2.17) and integrating, we obtain the more accurate relation
(2.20)
in the troposphere, with z 0 at sea level. The exponent g/(RB) is dimensionless
(again it must be) and has the standard value of 5.26 for air, with R 287 m2
/(s2
K).
The U.S. standard atmosphere [1] is sketched in Fig. 2.7. The pressure is seen to
be nearly zero at z 30 km. For tabulated properties see Table A.6.
EXAMPLE 2.2
If sea-level pressure is 101,350 Pa, compute the standard pressure at an altitude of 5000 m,
using (a) the exact formula and (b) an isothermal assumption at a standard sea-level tem-
perature of 15
C. Is the isothermal approximation adequate?
o a1
Bz
To
b
g
RB
1
where o 1.2255
kg
m3 , po 101,350 Pa
p pa a1
Bz
T0
b
g/(RB)
where
g
RB
5.26 (air)
B 0.003566
R/ft 0.00650 K/m
T0 518.69
R 288.16 K 15
C
The Standard Atmosphere
T T0 Bz
p2 p1 exp c
g(z2 z1)
RT0
d
2
1
dp
p
ln
p2
p1
g
R
2
1
dz
T
whi29346_ch02_064-137.qxd 10/14/09 22:08 Page 73 Debd 208:MHDQ176:whi29346:0073529346:whi29346_pagefiles:](https://image.slidesharecdn.com/white09-220921151844-e1802c93/75/Seven-edition-in-fluid-mechanics-White-101-2048.jpg)


![Solution
A free-body diagram of the submerged block (see Fig. E2.11) shows a balance between the
apparent weight, the buoyant force, and the actual weight:
or
Solving gives the volume of the block as 40/62.4 0.641 ft3
. Therefore the specific weight
of the block is
Ans.
Occasionally, a body will have exactly the right weight and volume for its ratio to
equal the specific weight of the fluid. If so, the body will be neutrally buoyant and will
remain at rest at any point where it is immersed in the fluid. Small neutrally buoyant
particles are sometimes used in flow visualization, and a neutrally buoyant body called
a Swallow float [2] is used to track oceanographic currents. A submarine can achieve
positive, neutral, or negative buoyancy by pumping water in or out of its ballast tanks.
A floating body as in Fig. 2.17 may not approve of the position in which it is floating.
If so, it will overturn at the first opportunity and is said to be statically unstable, like a
pencil balanced on its point. The least disturbance will cause it to seek another equilib-
rium position that is stable. Engineers must design to avoid floating instability. The only
way to tell for sure whether a floating position is stable is to “disturb” the body a slight
amount mathematically and see whether it develops a restoring moment that will return
it to its original position. If so, it is stable; if not, unstable. Such calculations for arbitrary
floating bodies have been honed to a fine art by naval architects [3], but we can at least
outline the basic principle of the static stability calculation. Figure 2.18 illustrates the
computation for the usual case of a symmetric floating body. The steps are as follows:
1. The basic floating position is calculated from Eq. (2.36). The body’s center of
mass G and center of buoyancy B are computed.
2. The body is tilted a small angle , and a new waterline is established for the
body to float at this angle. The new position B of the center of buoyancy is cal-
culated. A vertical line drawn upward from B intersects the line of symmetry at
a point M, called the metacenter, which is independent of for small angles.
3. If point M is above G (that is, if the metacentric height is positive), a
restoring moment is present and the original position is stable. If M is below
G (negative ), the body is unstable and will overturn if disturbed. Stability
increases with increasing .
Thus the metacentric height is a property of the cross section for the given weight, and
its value gives an indication of the stability of the body. For a body of varying cross sec-
tion and draft, such as a ship, the computation of the metacenter can be very involved.
MG
MG
MG
Stability
block
100 lbf
0.641 ft3 156 lbf/ft3
FB 40 lbf (62.4 lbf/ft3
)(block volume, ft3
)
g Fz 0 60 FB 100
94 Chapter 2 Pressure Distribution in a Fluid
FB
W = 100 lbf
60 lbf
E2.11
whi29346_ch02_064-137.qxd 10/14/09 22:12 Page 94 Debd 208:MHDQ176:whi29346:0073529346:whi29346_pagefiles:](https://image.slidesharecdn.com/white09-220921151844-e1802c93/75/Seven-edition-in-fluid-mechanics-White-123-2048.jpg)
![Naval architects [3] have developed the general stability concepts from Fig. 2.18 into
a simple computation involving the area moment of inertia of the waterline area about
the axis of tilt. The derivation assumes that the body has a smooth shape variation
(no discontinuities) near the waterline and is derived from Fig. 2.19.
The y axis of the body is assumed to be a line of symmetry. Tilting the body a
small angle then submerges the small wedge Obd and uncovers an equal wedge
cOa, as shown. The new position B of the center of buoyancy is calculated as the
centroid of the submerged portion aObde of the body:
0
Obd
x L (x tan dx)
cOa
xL (x tan dx) tan
waterline
x2
dAwaterline IO tan
x aObde
cOdea
x d
Obd
x d
cOa
x d 0
Obd
x (L dA)
cOa
x (L dA)
Stability Related to Waterline
Area
2.8 Buoyancy and Stability 95
Line of
symmetry
G
W
FB
B
M
G
W
B'
FB
Δ
G
W M
FB
B'
Small
disturbance
angle
Small
disturbance
angle
(b)
Either Restoring moment or Overturning moment
(a) (c)
θ
Δθ
Fig. 2.18 Calculation of the meta-
center M of the floating body
shown in (a). Tilt the body a small
angle . Either (b) B moves far
out (point M above G denotes
stability); or (c) B moves slightly
(point M below G denotes
instability).
y
c
a
e
d x
x
b
M
O
B
●
●
●
dA = x tan dx
Tilted floating body
Variable-width
L(x) into paper
Original
waterline
area
␦
B
Fig. 2.19 A floating body tilted
through a small angle . The
movement of the center of buoy-
ancy B is related to the waterline
area moment of inertia.
x
whi29346_ch02_064-137.qxd 10/14/09 22:13 Page 95 Debd 208:MHDQ176:whi29346:0073529346:whi29346_pagefiles:](https://image.slidesharecdn.com/white09-220921151844-e1802c93/75/Seven-edition-in-fluid-mechanics-White-124-2048.jpg)


![Solution
The cup contains 7 cm of coffee. The remaining distance of 3 cm up to the lip must equal
the distance h/2 in Fig. 2.23. Thus
Solving, we obtain
Ans. (a)
To compute the pressure, it is convenient to put the origin of coordinates r and z at the bot-
tom of the free-surface depression, as shown in Fig. E2.14. The gage pressure here is p0 0,
and point A is at (r, z) (3 cm, 4 cm). Equation (2.46) can then be evaluated:
Ans. (b)
This is about 43 percent greater than the still-water pressure pA 694 Pa.
Here, as in the linear acceleration case, it should be emphasized that the parab-
oloid pressure distribution (2.46) sets up in any fluid under rigid-body rotation,
regardless of the shape or size of the container. The container may even be closed
and filled with fluid. It is only necessary that the fluid be continuously intercon-
nected throughout the container. The following example will illustrate a peculiar
case in which one can visualize an imaginary free surface extending outside the
walls of the container.
EXAMPLE 2.15
A U-tube with a radius of 10 in and containing mercury to a height of 30 in is rotated about
its center at 180 r/min until a rigid-body mode is achieved. The diameter of the tubing is
negligible. Atmospheric pressure is 2116 lbf/ft2
. Find the pressure at point A in the rotating
condition. See Fig. E2.15.
Solution
Convert the angular velocity to radians per second:
From Table 2.1 we find for mercury that 846 lbf/ft3
and hence 846/32.2 26.3
slugs/ft3
. At this high rotation rate, the free surface will slant upward at a fierce angle [about
84
; check this from Eq. (2.47)], but the tubing is so thin that the free surface will remain
at approximately the same 30-in height, point B. Placing our origin of coordinates at this
(180 r/min)
2 rad/r
60 s/min
18.85 rad/s
396 N/m2
594 N/m2
990 Pa
1
2(1010 kg/m3
)(0.03 m)2
(1308 rad2
/s2
)
pA 0 (1010 kg/m3
)(9.81 m/s2
)(0.04 m)
Part (b)
2
1308 or 36.2 rad/s 345 r/min
h
2
0.03 m
2
R2
4g
2
(0.03 m)2
4(9.81 m/s2
)
Part (a)
102 Chapter 2 Pressure Distribution in a Fluid
3 cm
A
3 cm
7 cm
3 cm
Ω
z
r
0
E2.14
z
Ω
r
Imaginary
free surface
10 in
30 in
0
A
B
E2.15
whi29346_ch02_064-137.qxd 10/14/09 22:14 Page 102 Debd 208:MHDQ176:whi29346:0073529346:whi29346_pagefiles:](https://image.slidesharecdn.com/white09-220921151844-e1802c93/75/Seven-edition-in-fluid-mechanics-White-131-2048.jpg)


![the apparent net gravitational field would act on a particle. Depending on its density,
a small particle or bubble would tend to rise or fall in the fluid along these expo-
nential lines, as demonstrated experimentally in Ref. 5. Also, buoyant streamers
would align themselves with these exponential lines, thus avoiding any stress other
than pure tension. Figure 2.24 shows the configuration of such streamers before and
during rotation.
Pressure is a derived property. It is the force per unit area as related to fluid
molecular bombardment of a surface. Thus most pressure instruments only infer
the pressure by calibration with a primary device such as a deadweight piston
tester. There are many such instruments, for both a static fluid and a moving stream.
The instrumentation texts in Refs. 7 to 10, 12, 13, and 16–17 list over 20 designs
for pressure measurement instruments. These instruments may be grouped into four
categories:
1. Gravity-based: barometer, manometer, deadweight piston.
2. Elastic deformation: bourdon tube (metal and quartz), diaphragm, bellows,
strain-gage, optical beam displacement.
3. Gas behavior: gas compression (McLeod gage), thermal conductance (Pirani
gage), molecular impact (Knudsen gage), ionization, thermal conductivity, air
piston.
4. Electric output: resistance (Bridgman wire gage), diffused strain gage,
capacitative, piezoelectric, potentiometric, magnetic inductance, magnetic
reluctance, linear variable differential transformer (LVDT), resonant
frequency.
5. Luminescent coatings for surface pressures [15].
The gas-behavior gages are mostly special-purpose instruments used for certain sci-
entific experiments. The deadweight tester is the instrument used most often for
calibrations; for example, it is used by the U.S. National Institute for Standards and
Technology (NIST). The barometer is described in Fig. 2.6.
The manometer, analyzed in Sec. 2.4, is a simple and inexpensive hydrostatic-
principle device with no moving parts except the liquid column itself. Manometer
measurements must not disturb the flow. The best way to do this is to take the meas-
urement through a static hole in the wall of the flow, as illustrated in Fig. 2.25a. The
hole should be normal to the wall, and burrs should be avoided. If the hole is small
enough (typically 1-mm diameter), there will be no flow into the measuring tube
once the pressure has adjusted to a steady value. Thus the flow is almost undisturbed.
An oscillating flow pressure, however, can cause a large error due to possible
dynamic response of the tubing. Other devices of smaller dimensions are used for
dynamic-pressure measurements. The manometer in Fig. 2.25a measures the gage
pressure p1. The instrument in Fig. 2.25b is a digital differential manometer, which
can measure the difference between two different points in the flow, with stated accu-
racy of 0.1 percent of full scale. The world of instrumentation is moving quickly
toward digital readings.
2.10 Pressure Measurement
2.10 Pressure Measurement 105
whi29346_ch02_064-137.qxd 10/14/09 22:15 Page 105 Debd 208:MHDQ176:whi29346:0073529346:whi29346_pagefiles:](https://image.slidesharecdn.com/white09-220921151844-e1802c93/75/Seven-edition-in-fluid-mechanics-White-134-2048.jpg)

![Fig. 2.27 The fused-quartz, force-
balanced bourdon tube is the most
accurate pressure sensor used in
commercial applications today.
(Courtesy of Ruska Instrument
Corporation, Houston, TX.)
fluid pressure. The fused-quartz, force-balanced bourdon tube is reported to be one of
the most accurate pressure sensors ever devised, with uncertainty on the order of
0.003 percent.
The quartz gages, both the bourdon type and the resonant type, are expensive but
extremely accurate, stable, and reliable [14]. They are often used for deep-ocean
pressure measurements, which detect long waves and tsunami activity over extensive
time periods.
The last category, electric-output sensors, is extremely important in engineering
because the data can be stored on computers and freely manipulated, plotted, and ana-
lyzed. Three examples are shown in Fig. 2.28, the first being the capacitive sensor in
Fig. 2.28a. The differential pressure deflects the silicon diaphragm and changes the
capacitance of the liquid in the cavity. Note that the cavity has spherical end caps to
prevent overpressure damage. In the second type, Fig. 2.28b, strain gages and other
sensors are chemically diffused or etched onto a chip, which is stressed by the applied
pressure. Finally, in Fig. 2.28c, a micromachined silicon sensor is arranged to deform
under pressure such that its natural vibration frequency is proportional to the pressure.
An oscillator excites the element’s resonant frequency and converts it into appropri-
ate pressure units.
Another kind of dynamic electric-output sensor is the piezoelectric transducer,
shown in Fig. 2.29. The sensing elements are thin layers of quartz, which generate
an electric charge when subjected to stress. The design in Fig. 2.29 is flush-mounted
on a solid surface and can sense rapidly varying pressures, such as blast waves. Other
designs are of the cavity type. This type of sensor primarily detects transient pres-
sures, not steady stress, but if highly insulated can also be used for short-term static
events. Note also that it measures gage pressure—that is, it detects only a change
from ambient conditions.
2.10 Pressure Measurement 107
whi29346_ch02_064-137.qxd 10/14/09 22:15 Page 107 Debd 208:MHDQ176:whi29346:0073529346:whi29346_pagefiles:](https://image.slidesharecdn.com/white09-220921151844-e1802c93/75/Seven-edition-in-fluid-mechanics-White-136-2048.jpg)
![108
Seal diaphragm
Filling liquid
Sensing diaphragm
Cover flange
Low-pressure side
High-pressure side
(a)
(b)
Strain gages
Diffused into integrated
silicon chip
Wire bonding
Stitch bonded
connections from
chip to body plug
Etched cavity
Micromachined
silicon sensor
Temperature sensor
On-chip diode for
optimum temperature
performance (c)
Fig. 2.28 Pressure sensors with
electric output: (a) a silicon
diaphragm whose deflection
changes the cavity capacitance
(Courtesy of Johnson-Yokogawa
Inc.); (b) a silicon strain gage that
is stressed by applied pressure;
(c) a micromachined silicon
element that resonates at a
frequency proportional to applied
pressure. [(b) and (c) are courtesy
of Druck, Inc., Fairfield, CT.]
whi29346_ch02_064-137.qxd 10/14/09 22:15 Page 108 Debd 208:MHDQ176:whi29346:0073529346:whi29346_pagefiles:](https://image.slidesharecdn.com/white09-220921151844-e1802c93/75/Seven-edition-in-fluid-mechanics-White-137-2048.jpg)


![The three approaches are roughly equal in importance. Control volume analysis, the
present topic, is accurate for any flow distribution but is often based on average or “one-
dimensional” property values at the boundaries. It always gives useful “engineering”
estimates. In principle, the differential equation approach of Chap. 4 can be applied to
any problem. Only a few problems, such as straight pipe flow, yield to exact analytical
solutions. But the differential equations can be modeled numerically, and the flourish-
ing field of computational fluid dynamics (CFD)[8] can now be used to give good esti-
mates for almost any geometry. Finally, the dimensional analysis of Chap. 5 applies to
any problem, whether analytical, numerical, or experimental. It is particularly useful to
reduce the cost of experimentation. Differential analysis of hydrodynamics began with
Euler and d’Alembert in the late eighteenth century. Lord Rayleigh and E. Buckingham
pioneered dimensional analysis at the end of the nineteenth century. The control vol-
ume was described in words, on an ad hoc one-case basis, by Daniel Bernoulli in 1753.
Ludwig Prandtl, the celebrated founder of modern fluid mechanics (Fig. 1.2), developed
the control volume as a systematic tool in the early 1900s. The writer’s teachers at M.I.T.
introduced control volume analysis into American textbooks, for thermodynamics by
Keenan in 1941 [10], and for fluids by Hunsaker and Rightmire in 1947 [11]. For a
complete history of the control volume, see Vincenti [9].
All the laws of mechanics are written for a system, which is defined as an arbitrary
quantity of mass of fixed identity. Everything external to this system is denoted by
the term surroundings, and the system is separated from its surroundings by its bound-
aries. The laws of mechanics then state what happens when there is an interaction
between the system and its surroundings.
First, the system is a fixed quantity of mass, denoted by m. Thus the mass of the
system is conserved and does not change.1
This is a law of mechanics and has a very
simple mathematical form, called conservation of mass:
or (3.1)
This is so obvious in solid mechanics problems that we often forget about it. In fluid
mechanics, we must pay a lot of attention to mass conservation, and it takes a little
analysis to make it hold.
Second, if the surroundings exert a net force F on the system, Newton’s second
law states that the mass in the system will begin to accelerate:2
(3.2)
In Eq. (2.8) we saw this relation applied to a differential element of viscous incom-
pressible fluid. In fluid mechanics Newton’s second law is called the linear momentum
relation. Note that it is a vector law that implies the three scalar equations Fx max,
Fy may, and Fz maz.
F ma m
dV
dt
d
dt
(mV)
dm
dt
0
msyst const
Systems versus Control Volumes
140 Chapter 3 Integral Relations for a Control Volume
1
We are neglecting nuclear reactions, where mass can be changed to energy.
2
We are neglecting relativistic effects, where Newton’s law must be modified.
whi29346_ch03_138-227.qxd 10/28/09 16:46 Page 140 Debd 208:MHDQ176:whi29346:0073529346:whi29346_pagefiles:](https://image.slidesharecdn.com/white09-220921151844-e1802c93/75/Seven-edition-in-fluid-mechanics-White-171-2048.jpg)


![which contribute to applied forces in the momentum analysis. In this sense the con-
trol volume resembles the free-body concept, which is applied to systems in solid
mechanics analyses.
Figure 3.2b illustrates a moving control volume. Here the ship is of interest, not
the ocean, so that the control surface chases the ship at ship speed V. The control
volume is of fixed volume, but the relative motion between water and ship must be
considered. If V is constant, this relative motion is a steady flow pattern, which sim-
plifies the analysis.3
If V is variable, the relative motion is unsteady, so that the com-
puted results are time-variable and certain terms enter the momentum analysis to
reflect the noninertial (accelerating) frame of reference.
Figure 3.2c shows a deforming control volume. Varying relative motion at the
boundaries becomes a factor, and the rate of change of shape of the control volume
enters the analysis. We begin by deriving the fixed control volume case, and we con-
sider the other cases as advanced topics. An interesting history of control volume
analysis is given by Vincenti [9].
Figure 3.3 shows a fixed control volume with an arbitrary flow pattern passing through.
There are variable slivers of inflow and outflow of fluid all about the control surface.
In general, each differential area dA of surface will have a different velocity V mak-
ing a different angle with the local normal to dA. Some elemental areas will have
inflow volume (VA cos )in dt, and others will have outflow volume (VA cos )out dt,
Arbitrary Fixed Control Volume
144 Chapter 3 Integral Relations for a Control Volume
3
A wind tunnel uses a fixed model to simulate flow over a body moving through a fluid. A tow tank
uses a moving model to simulate the same situation.
System at
time t + dt
System at
time t
d A
θ
n, Unit outward
normal to dA
Arbitrary
fixed
control
surface
CS
Vin
dA
Vout
n, Unit outward
normal to dA
Fixed
control
volume
CV
θ
d
in = Vin dAin cos in dt
= –V• n dA dt
θ d
out = V dAout cos out dt
= V • n dA dt
out θ
Fig. 3.3 An arbitrary control vol-
ume with an arbitrary flow pattern.
whi29346_ch03_138-227.qxd 10/28/09 16:46 Page 144 Debd 208:MHDQ176:whi29346:0073529346:whi29346_pagefiles:](https://image.slidesharecdn.com/white09-220921151844-e1802c93/75/Seven-edition-in-fluid-mechanics-White-175-2048.jpg)


![EXAMPLE 3.2
The balloon in Fig. E3.2 is being filled through section 1, where the area is A1, velocity is
V1, and fluid density is 1. The average density within the balloon is b(t). Find an expres-
sion for the rate of change of system mass within the balloon at this instant.
Solution
• System sketch: Figure E3.2 shows one inlet, no exits. The control volume and system
expand together, hence the relative velocity Vr 0 on the balloon surface.
• Assumptions: Unsteady flow (the control volume mass increases), deformable control
surface, one-dimensional inlet conditions.
• Approach: Apply Eq. (3.16) with Vr 0 on the balloon surface and Vr V1 at the inlet.
• Solution steps: The property being studied is mass, B m and dm/dm unity.
Apply Eq. (3.16). The volume integral is evaluated based on average density b, and the
surface integral term is negative (for an inlet):
Ans.
• Comments: The relation given is the answer to the question that was asked. Actually,
by the conservation law for mass, Eq. (3.1), (dm/dt)syst 0, and the answer could be
rewritten as
This is a first-order ordinary differential equation relating gas density and balloon radius.
It could form part of an engineering analysis of balloon inflation. It cannot be solved with-
out further use of mechanics and thermodynamics to relate the four unknowns b, 1, V1,
and R. The pressure and temperature and the elastic properties of the balloon would also
have to be brought into the analysis.
For advanced study, many more details of the analysis of deformable control vol-
umes can be found in Hansen [4] and Potter et al. [5].
The Reynolds transport theorem, Eq. (3.16) or (3.17), establishes a relation between
system rates of change and control volume surface and volume integrals. But system
derivatives are related to the basic laws of mechanics, Eqs. (3.1) to (3.5). Eliminat-
ing system derivatives between the two gives the control volume, or integral, forms
of the laws of mechanics of fluids. The dummy variable B becomes, respectively,
mass, linear momentum, angular momentum, and energy.
For conservation of mass, as discussed in Examples 3.1 and 3.2, B m and
dm/dm 1. Equation (3.1) becomes
(3.20)
a
dm
dt
b
syst
0
d
dt
a CV
db CS
(Vr n) dA
3.3 Conservation of Mass
d
dt
(b R3
)
3
4
1A1V1
a
dm
dt
b
syst
d
dt
a
CV
db
CS
(Vr
n)dA
d
dt
ab
4
3
R
3
b 1A1
V1
150 Chapter 3 Integral Relations for a Control Volume
1
R(t)
Pipe
Average
density: b(t)
CS expands outward
with balloon radius R(t)
ρ
E3.2
whi29346_ch03_138-227.qxd 10/28/09 16:49 Page 150 Debd 208:MHDQ176:whi29346:0073529346:whi29346_pagefiles:](https://image.slidesharecdn.com/white09-220921151844-e1802c93/75/Seven-edition-in-fluid-mechanics-White-181-2048.jpg)


![1
5
u U0a1
r2
R2b
4
3
1
A a
u
Vav
b
2
dA
u2
dA ṁ Vav AV2
av
u(V n) dA ṁV AV2
Momentum Flux Correction
Factor
D b
0
u(U0 u) dy ƒxL
3.4 The Linear Momentum Equation 165
11
The autobiography of this great twentieth-century engineer and teacher [2] is recommended for its
historical and scientific insight.
whi29346_ch03_138-227.qxd 10/28/09 16:55 Page 165 Debd 208:MHDQ176:whi29346:0073529346:whi29346_pagefiles:](https://image.slidesharecdn.com/white09-220921151844-e1802c93/75/Seven-edition-in-fluid-mechanics-White-198-2048.jpg)


![very restrictive assumption. Note that the limit of a vanishingly small area means
that the streamtube is equivalent to a streamline of the flow. Bernoulli’s equation is
valid for both and is usually stated as holding “along a streamline” in frictionless flow.
Conservation of mass [Eq. (3.20)] for this elemental control volume yields
where AV and d A ds. Then our desired form of mass conservation is
(3.51)
This relation does not require an assumption of frictionless flow.
Now write the linear momentum relation [Eq. (3.37)] in the streamwise direction:
where Vs V itself because s is the streamline direction. If we neglect the shear force on
the walls (frictionless flow), the forces are due to pressure and gravity. The streamwise
gravity force is due to the weight component of the fluid within the control volume:
The pressure force is more easily visualized, in Fig. 3.12b, by first subtracting a
uniform value p from all surfaces, remembering from Fig. 3.6 that the net force is
not changed. The pressure along the slanted side of the streamtube has a streamwise
component that acts not on A itself but on the outer ring of area increase dA. The net
pressure force is thus
to first order. Substitute these two force terms into the linear momentum relation:
The first and last terms on the right cancel by virtue of the continuity relation
[Eq. (3.51)]. Divide what remains by A and rearrange into the final desired relation:
(3.52)
This is Bernoulli’s equation for unsteady frictionless flow along a streamline . It is in dif-
ferential form and can be integrated between any two points 1 and 2 on the streamline:
(3.53)
2
1
V
t
ds
2
1
dp
1
2
(V2
2 V2
1) g(z2 z1) 0
V
t
ds
dp
V dV g dz 0
t
VA ds
V
t
A ds ṁ dV V dṁ
a dFs A dz A dp
t
(V) A ds d(ṁV)
dFs,press 1
2 dp dA dp(A dA) A dp
dFs, grav dW sin A ds sin A dz
adFs
d
dt
a CV
V db (ṁV)out (ṁV)in
t
(V) A ds d(ṁV)
dṁ d(AV)
t
A ds
ṁ
d
dt
a CV
db ṁout ṁin 0
t
d dṁ
170 Chapter 3 Integral Relations for a Control Volume
whi29346_ch03_138-227.qxd 10/28/09 16:57 Page 170 Debd 208:MHDQ176:whi29346:0073529346:whi29346_pagefiles:](https://image.slidesharecdn.com/white09-220921151844-e1802c93/75/Seven-edition-in-fluid-mechanics-White-203-2048.jpg)


![3.5 Frictionless Flow: The Bernoulli Equation 173
Fig. 3.14 Hydraulic and energy
grade lines for frictionless flow in
a duct.
Flow
1
2
Energy grade line
Hydraulic grade line
Arbitrary datum (z = 0)
z1
2g
V2
2
V1
2
2g
p1
g
z2
p2
g
Constant
Bernoulli
head
ρ
ρ
A useful visual interpretation of Bernoulli’s equation is to sketch two grade lines of
a flow. The energy grade line (EGL) shows the height of the total Bernoulli constant
h0 z p/ V2
/(2g). In frictionless flow with no work or heat transfer [Eq. (3.54)]
the EGL has constant height. The hydraulic grade line (HGL) shows the height
corresponding to elevation and pressure head z p/—that is, the EGL minus the
velocity head V2
/(2g). The HGL is the height to which liquid would rise in a piezome-
ter tube (see Prob. 2.11) attached to the flow. In an open-channel flow the HGL is
identical to the free surface of the water.
Figure 3.14 illustrates the EGL and HGL for frictionless flow at sections 1 and 2
of a duct. The piezometer tubes measure the static pressure head z p/ and thus
outline the HGL. The pitot stagnation-velocity tubes measure the total head z p/
V2
/(2g), which corresponds to the EGL. In this particular case the EGL is constant,
and the HGL rises due to a drop in velocity.
In more general flow conditions, the EGL will drop slowly due to friction losses
and will drop sharply due to a substantial loss (a valve or obstruction) or due to
work extraction (to a turbine). The EGL can rise only if there is work addition (as
from a pump or propeller). The HGL generally follows the behavior of the EGL
with respect to losses or work transfer, and it rises and/or falls if the velocity
decreases and/or increases.
As mentioned before, no conversion factors are needed in computations with the
Bernoulli equation if consistent SI or BG units are used, as the following examples
will show.
In all Bernoulli-type problems in this text, we consistently take point 1 upstream
and point 2 downstream.
Hydraulic and Energy Grade
Lines
whi29346_ch03_138-227.qxd 10/28/09 16:58 Page 173 Debd 208:MHDQ176:whi29346:0073529346:whi29346_pagefiles:](https://image.slidesharecdn.com/white09-220921151844-e1802c93/75/Seven-edition-in-fluid-mechanics-White-206-2048.jpg)


![The friction head is larger than the elevation change z, and the pump must drive the flow
against both changes, hence the high inlet pressure. The ratio of friction to velocity head is
Ans.
• Comments: This high ratio is typical of long pipelines. (Note that we did not make direct
use of the 10,000-m pipe length, whose effect is hidden within hf.) In Chap. 6 we can state
this problem in a more direct fashion: Given the flow rate, fluid, and pipe size, what inlet pres-
sure is needed? Our correlations for hf will lead to the estimate pinlet 24 atm, as stated here.
EXAMPLE 3.22
Air [R 1716, cp 6003 ft lbf/(slug °R)] flows steadily, as shown in Fig. E3.22, through
a turbine that produces 700 hp. For the inlet and exit conditions shown, estimate (a) the
exit velocity V2 and (b) the heat transferred Q in Btu/h.
E3.22
Solution
The inlet and exit densities can be computed from the perfect-gas law:
The mass flow is determined by the inlet conditions
Knowing mass flow, we compute the exit velocity
or Ans. (a)
V2 244 ft/s
ṁ 0.325 2A2V2 (0.00679)
4
a
6
12
b
2
V2
ṁ 1A1V1 (0.0166)
4
a
6
12
b
2
(100) 0.325 slug/s
2
p2
RT2
40(144)
1716(460 35)
0.00679 slug/ft3
1
p1
RT1
150(144)
1716(460 300)
0.0166 slug/ft3
Part (a)
1 2
Turbomachine
Ws = 700 hp
⋅
D1 = 6 in
p1 = 150 lb/in2
T1 = 300° F
V1 = 100 ft/s
D2 = 6 in
p2 = 40 lb/in2
T2 = 35° F
Q ?
⋅
hf
V2
/(2g)
199 m
0.173 m
1150
190 Chapter 3 Integral Relations for a Control Volume
whi29346_ch03_138-227.qxd 10/28/09 17:07 Page 190 Debd 208:MHDQ176:whi29346:0073529346:whi29346_pagefiles:](https://image.slidesharecdn.com/white09-220921151844-e1802c93/75/Seven-edition-in-fluid-mechanics-White-228-2048.jpg)


![“jump” to a low-speed, low-energy condition (V2, h2) as
in Fig. P3.102. The pressure at sections 1 and 2 is
approximately hydrostatic, and wall friction is negligible.
Use the continuity and momentum relations to find h2
and V2 in terms of (h1, V1).
P3.102
*P3.103 Suppose that the solid-propellant rocket of Prob. P3.35
is mounted on a 1000-kg car to propel it up a long slope
of 15°. The rocket motor weighs 900 N, which includes
500 N of propellant. If the car starts from rest when
the rocket is fired, and if air drag and wheel friction are
neglected, estimate the maximum distance that the car
will travel up the hill.
P3.104 A rocket is attached to a rigid horizontal rod hinged at the
origin as in Fig. P3.104. Its initial mass is M0, and its exit
properties are and Ve relative to the rocket. Set up the
differential equation for rocket motion, and solve for the
angular velocity (t) of the rod. Neglect gravity, air drag,
and the rod mass.
P3.104
P3.105 Extend Prob. P3.104 to the case where the rocket has a lin-
ear air drag force F cV, where c is a constant. Assuming
no burnout, solve for (t) and find the terminal angular
velocity—that is, the final motion when the angular accel-
eration is zero. Apply to the case M0 6 kg, R 3 m,
0.05 kg/s, Ve 1100 m/s, and c 0.075 N s/m to
find the angular velocity after 12 s of burning.
ṁ
y
x
R
m, Ve, pe = pa
ω, ω
.
.
ṁ
Hydraulic
jump
V1
V2
V1 h2
h1
h1
P3.106 Actual air flow past a parachute creates a variable distri-
bution of velocities and directions. Let us model this as a
circular air jet, of diameter half the parachute diameter,
which is turned completely around by the parachute, as in
Fig. P3.106. (a) Find the force F required to support the
chute. (b) Express this force as a dimensionless drag
coefficient , CD = F/[(1
⁄2)V2
(4)D2
] and compare with
Table 7.3.
P3.106
P3.107 The cart in Fig. P3.107 moves at constant velocity
V0 12 m/s and takes on water with a scoop 80 cm
wide that dips h 2.5 cm into a pond. Neglect air drag
and wheel friction. Estimate the force required to keep
the cart moving.
P3.107
*P3.108 A rocket sled of mass M is to be decelerated by a scoop,
as in Fig. P3.108, which has width b into the paper
and dips into the water a depth h, creating an upward jet
at 60°. The rocket thrust is T to the left. Let the initial
velocity be V0, and neglect air drag and wheel friction.
Find an expression for V(t) of the sled for (a) T 0 and
(b) finite T 0.
P3.109 For the boundary layer flow in Fig. 3.10, let the exit
velocity profile, at x L, simulate turbulent flow,
. (a) Find a relation between h and .
(b) Find an expression for the drag force F on the plate
between 0 and L.
u U0(y/)1/7
Water
V0
h
D
D/2
ρ, V
212 Chapter 3 Integral Relations for a Control Volume
whi29346_ch03_138-227.qxd 10/28/09 17:11 Page 212 Debd 208:MHDQ176:whi29346:0073529346:whi29346_pagefiles:](https://image.slidesharecdn.com/white09-220921151844-e1802c93/75/Seven-edition-in-fluid-mechanics-White-252-2048.jpg)


![flow problems, some of which are discussed in Sec. 4.11 and in Chap. 6 (see also
Refs. 4 and 5). For compressible flow, see Eq. (2.29) of Ref. 5.
Equations (4.38) have four unknowns: p, u, , and w. They should be combined
with the incompressible continuity relation [Eqs. (4.12)] to form four equations in
these four unknowns. We shall discuss this again in Sec. 4.6, which presents the appro-
priate boundary conditions for these equations.
Even though the Navier-Stokes equations have only a limited number of known
analytical solutions, they are amenable to fine-gridded computer modeling [1]. The
field of CFD is maturing fast, with many commercial software tools available. It is
possible now to achieve approximate, but realistic, CFD results for a wide variety of
complex two- and three-dimensional viscous flows.
EXAMPLE 4.5
Take the velocity field of Example 4.3, with b 0 for algebraic convenience
and determine under what conditions it is a solution to the Navier-Stokes momentum equa-
tions (4.38). Assuming that these conditions are met, determine the resulting pressure dis-
tribution when z is “up” (gx 0, gy 0, gz g).
Solution
• Assumptions: Constant density and viscosity, steady flow (u and independent of time).
• Approach: Substitute the known (u, , w) into Eqs. (4.38) and solve for the pressure gra-
dients. If a unique pressure function p(x, y, z) can then be found, the given solution is exact.
• Solution step 1: Substitute (u, , w) into Eqs. (4.38) in sequence:
Rearrange and solve for the three pressure gradients:
(1)
• Comment 1: The vertical pressure gradient is hydrostatic. (Could you have predicted this by
noting in Eqs. (4.38) that w 0?) However, the pressure is velocity-dependent in the xy plane.
• Solution step 2: To determine if the x and y gradients of pressure in Eq. (1) are compati-
ble, evaluate the mixed derivative,(2
p/x y); that is, cross-differentiate these two equations:
x
a
p
y
b
x
32a2
(x2
y y3
)4 4a2
xy
y
a
p
x
b
y
32a2
(x3
xy2
)4 4a2
xy
p
x
2a2
(x3
xy2
)
p
y
2a2
(x2
y y3
)
p
z
g
(g)
p
z
(0 0 0) au
w
x
w
y
b 0
(0)
p
y
(0 0 0) au
x
y
b 2a2
(x2
y y3
)
(0)
p
x
(2a 2a 0) au
u
x
u
y
b 2a2
(x3
xy2
)
u a(x2
y2
) 2axy w 0
4.3 The Differential Equation of Linear Momentum 243
whi29346_ch04_228-291.qxd 10/28/09 17:25 Page 243 Debd 208:MHDQ176:whi29346:0073529346:whi29346_pagefiles:](https://image.slidesharecdn.com/white09-220921151844-e1802c93/75/Seven-edition-in-fluid-mechanics-White-283-2048.jpg)


![is short for the viscous-dissipation function.8
For a newtonian incompress-
ible viscous fluid, this function has the form
(4.50)
Since all terms are quadratic, viscous dissipation is always positive, so that a viscous
flow always tends to lose its available energy due to dissipation, in accordance with
the second law of thermodynamics.
Now substitute Eq. (4.49) into Eq. (4.48), using the linear momentum equation (4.32)
to eliminate ij. This will cause the kinetic and potential energies to cancel, leav-
ing a more customary form of the general differential energy equation:
(4.51)
This equation is valid for a newtonian fluid under very general conditions of unsteady,
compressible, viscous, heat-conducting flow, except that it neglects radiation heat trans-
fer and internal sources of heat that might occur during a chemical or nuclear reaction.
Equation (4.51) is too difficult to analyze except on a digital computer [1]. It is
customary to make the following approximations:
(4.52)
Equation (4.51) then takes the simpler form, for V 0,
(4.53)
which involves temperature T as the sole primary variable plus velocity as a second-
ary variable through the total time-derivative operator:
(4.54)
A great many interesting solutions to Eq. (4.53) are known for various flow condi-
tions, and extended treatments are given in advanced books on viscous flow [4, 5]
and books on heat transfer [7, 8].
One well-known special case of Eq. (4.53) occurs when the fluid is at rest or has
negligible velocity, where the dissipation](https://image.slidesharecdn.com/white09-220921151844-e1802c93/75/Seven-edition-in-fluid-mechanics-White-289-2048.jpg)
![and convective terms become negligible:
(4.55)
The change from c to cp is correct and justified by the fact that, when pressure terms
are neglected from a gas flow energy equation [4, 5], what remains is approximately an
cp
T
t
k2
T
dT
dt
T
t
u
T
x
T
y
w
T
z
c
dT
dt
k2
T](https://image.slidesharecdn.com/white09-220921151844-e1802c93/75/Seven-edition-in-fluid-mechanics-White-290-2048.jpg)


![enthalpy change, not an internal energy change. This is called the heat conduction equa-
tion in applied mathematics and is valid for solids and fluids at rest. The solution to
Eq. (4.55) for various conditions is a large part of courses and books on heat transfer.
This completes the derivation of the basic differential equations of fluid motion.
There are three basic differential equations of fluid motion, just derived. Let us sum-
marize them here:
Continuity: (4.56)
Momentum: (4.57)
Energy: (4.58)
where is given by Eq. (4.50). In general, the density is variable, so that these three
equations contain five unknowns, , V, p, û, and T. Therefore we need two additional
relations to complete the system of equations. These are provided by data or alge-
braic expressions for the state relations of the thermodynamic properties:
(4.59)
For example, for a perfect gas with constant specific heats, we complete the system with
(4.60)
It is shown in advanced books [4, 5] that this system of equations (4.56) to (4.59) is
well posed and can be solved analytically or numerically, subject to the proper bound-
ary conditions.
What are the proper boundary conditions? First, if the flow is unsteady, there must
be an initial condition or initial spatial distribution known for each variable:
At t 0: (4.61)
Thereafter, for all times t to be analyzed, we must know something about the vari-
ables at each boundary enclosing the flow.
Figure 4.7 illustrates the three most common types of boundaries encountered in
fluid flow analysis: a solid wall, an inlet or outlet, and a liquid–gas interface.
First, for a solid, impermeable wall, there is no slip and no temperature jump in a
viscous heat-conducting fluid:
Solid wall: Vfluid Vwall Tfluid Twall (4.62)
The only exception to Eq. (4.62) occurs in an extremely rarefied gas flow, where
slippage can be present [5].
Second, at any inlet or outlet section of the flow, the complete distribution of veloc-
ity, pressure, and temperature must be known for all times:
Inlet or outlet: Known V, p, T (4.63)
These inlet and outlet sections can be and often are at , simulating a body
immersed in an infinite expanse of fluid.
, V, p, û, T known f(x, y, z)
p
RT
û c dT c T const
(p, T) û û(p, T)
dû
dt
p( V) (k T)
dV
dt
g p ij
t
(V) 0
4.6 Boundary Conditions
for the Basic Equations
4.6 Boundary Conditions for the Basic Equations 249
whi29346_ch04_228-291.qxd 10/28/09 21:28 Page 249](https://image.slidesharecdn.com/white09-220921151844-e1802c93/75/Seven-edition-in-fluid-mechanics-White-295-2048.jpg)


![When multiplied by viscosity , this equals the shear stress xy in a newtonian fluid,
as discussed earlier in Eqs. (4.37). Appendix D lists strain rate and vorticity compo-
nents in cylindrical coordinates.
When a flow is both frictionless and irrotational, pleasant things happen. First, the
momentum equation (4.38) reduces to Euler’s equation:
(4.114)
Second, there is a great simplification in the acceleration term. Recall from Sec. 4.1
that acceleration has two terms:
(4.2)
A beautiful vector identity exists for the second term [11]:
(4.115)
where
curl V from Eq. (4.111) is the fluid vorticity.
Now combine (4.114) and (4.115), divide by , and rearrange on the left-hand side.
Dot the entire equation into an arbitrary vector displacement dr:
(4.116)
Nothing works right unless we can get rid of the third term. We want
(4.117)
This will be true under various conditions:
1. V is zero; trivial, no flow (hydrostatics).
2. is zero; irrotational flow.
3. dr is perpendicular to V; this is rather specialized and rare.
4. dr is parallel to V; we integrate along a streamline (see Sec. 3.5).
Condition 4 is the common assumption. If we integrate along a streamline in fric-
tionless compressible flow and take, for convenience, g gk, Eq. (4.116) reduces
to
(4.118)
Except for the first term, these are exact differentials. Integrate between any two points
1 and 2 along the streamline:
(4.119)
2
1
V
t
ds
2
1
dp
1
2
(V2
2
V1
2
) g(z2 z1) 0
V
t
dr da
1
2
V2
b
dp
g dz 0
( V) (dr) 0
c
V
t
a
1
2
V2
b V
1
p gd dr 0
(V )V 11
2V2
2 V
dV
dt
V
t
(V )V
dV
dt
g p
4.9 Frictionless Irrotational
Flows
4.9 Frictionless Irrotational Flows 263
whi29346_ch04_228-291.qxd 10/28/09 17:35 Page 263 Debd 208:MHDQ176:whi29346:0073529346:whi29346_pagefiles:](https://image.slidesharecdn.com/white09-220921151844-e1802c93/75/Seven-edition-in-fluid-mechanics-White-408-2048.jpg)

![. From a theorem in vector analysis [11], a vector with zero curl
must be the gradient of a scalar function
(4.121)
where (x, y, z, t) is called the velocity potential function. Knowledge of thus
immediately gives the velocity components
(4.122)
Lines of constant are called the potential lines of the flow.
Note that , unlike the stream function, is fully three-dimensional and not limited
to two coordinates. It reduces a velocity problem with three unknowns u, , and w to
a single unknown potential ; many examples are given in Chap. 8. The velocity
potential also simplifies the unsteady Bernoulli equation (4.118) because if exists,
we obtain
(4.123)
along any arbitrary direction. Equation (4.118) then becomes a relation between and p:
(4.124)
This is the unsteady irrotational Bernoulli equation. It is very important in the analy-
sis of accelerating flow fields (see Refs. 10 and 15), but the only application in this
text will be in Sec. 9.3 for steady flow.
If a flow is both irrotational and described by only two coordinates,](https://image.slidesharecdn.com/white09-220921151844-e1802c93/75/Seven-edition-in-fluid-mechanics-White-410-2048.jpg)


![This example illustrates a statement made earlier: Knowledge of the velocity vector V
[as in Eq. (4.134)] is essentially the solution to a fluid mechanics problem, since all other
flow properties can then be calculated.
Perhaps the most useful exact solution of the Navier-Stokes equation is for incom-
pressible flow in a straight circular pipe of radius R, first studied experimentally by G.
Hagen in 1839 and J. L. Poiseuille in 1840. By fully developed we mean that the region
studied is far enough from the entrance that the flow is purely axial, z 0, while r
and are zero. We neglect gravity and also assume axial symmetry—that is, / 0.
The equation of continuity in cylindrical coordinates, Eq. (4.12b), reduces to
The flow proceeds straight down the pipe without radial motion. The r-momentum
equation in cylindrical coordinates, Eq. (D.5), simplifies to p/r 0, or p p(z)
only. The z-momentum equation in cylindrical coordinates, Eq. (D.7), reduces to
The convective acceleration term on the left vanishes because of the previously given
continuity equation. Thus the momentum equation may be rearranged as follows:
(4.136)
This is exactly the situation that occurred for flow between flat plates in Eq. (4.132).
Again the “separation” constant is negative, and pipe flow will look much like the
plate flow in Fig. 4.12b.
Equation (4.136) is linear and may be integrated twice, with the result
where C1 and C2 are constants. The boundary conditions are no slip at the wall and
finite velocity at the centerline:
To avoid a logarithmic singularity, the centerline condition requires that C1 0. Then,
from no slip, C2 (dp/dz)(R2
/4 ). The final, and famous, solution for fully devel-
oped Hagen-Poiseuille flow is
(4.137)
z a
dp
dz
b
1
4
(R2
r2
)
Finite velocity at r 0: z finite 0 C1 ln(0) C2
No slip at r R: z 0
dp
dz
R2
4
C1 ln(R) C2
z
dp
dz
r2
4
C1 ln(r) C2
r
d
dr
ar
dz
dr
b
dp
dz
const 0
z
z
z
dp
dz
2
z
dp
dz
r
d
dr
ar
dz
dr
b
z
(z) 0 or z z(r) only
Fully Developed Laminar
Pipe Flow
272 Chapter 4 Differential Relations for Fluid Flow
whi29346_ch04_228-291.qxd 10/28/09 17:38 Page 272 Debd 208:MHDQ176:whi29346:0073529346:whi29346_pagefiles:](https://image.slidesharecdn.com/white09-220921151844-e1802c93/75/Seven-edition-in-fluid-mechanics-White-433-2048.jpg)


![For the conditions of the present problem, all terms are zero except the last. There-
fore the basic differential equation for flow between rotating cylinders is
(4.139)
This is a linear second-order ordinary differential equation with the solution
The constants are found by the no-slip condition at the inner and outer cylinders:
The final solution for the velocity distribution is
(4.140)
The velocity profile closely resembles the sketch in Fig. 4.13. Variations of this case,
such as a rotating outer cylinder, are given in the problem assignments.
The classic Couette flow solution16
of Eq. (4.140) describes a physically satisfying
concave, two-dimensional, laminar flow velocity profile as in Fig. 4.13. The solution
is mathematically exact for an incompressible fluid. However, it becomes unstable at
a relatively low rate of rotation of the inner cylinder, as shown in 1923 in a classic
paper by G. I. Taylor [17]. At a critical value of what is now called the dimension-
less Taylor number, denoted Ta,
(4.141)
the plane flow of Fig. 4.13 vanishes and is replaced by a laminar three-dimensional
flow pattern consisting of rows of nearly square alternating toroidal vortices. An
experimental demonstration of toroidal “Taylor vortices” is shown in Fig. 4.14a,
measured at Ta 1.16 Tacrit by Koschmieder [18]. At higher Taylor numbers, the vor-
tices also develop a circumferential periodicity but are still laminar, as illustrated in
Fig. 4.14b. At still higher Ta, turbulence ensues. This interesting instability reminds
us that the Navier-Stokes equations, being nonlinear, do admit to multiple (nonunique)
laminar solutions in addition to the usual instabilities associated with turbulence and
chaotic dynamic systems.
Tacrit
ri(ro ri)3
i
2
2 1700
Instability of Rotating Inner15
Cylinder Flow
Æi ri
ro /r r/ro
ro /ri ri /ro
Rotating inner cylinder:
iri C1ri
C2
ri
Inner, at r ri :
0 C1ro
C2
ro
Outer, at r ro:
C1r
C2
r
2
1
r
d
dr
ar
d
dr
b
r2
4.10 Some Illustrative Incompressible Viscous Flows 275
15
This section may be omitted without loss of continuity.
16
Named after M. Couette, whose pioneering paper in 1890 established rotating cylinders as a
method, still used today, for measuring the viscosity of fluids.
whi29346_ch04_228-291.qxd 10/28/09 17:40 Page 275 Debd 208:MHDQ176:whi29346:0073529346:whi29346_pagefiles:](https://image.slidesharecdn.com/white09-220921151844-e1802c93/75/Seven-edition-in-fluid-mechanics-White-436-2048.jpg)

![Problems
Most of the problems herein are fairly straightforward. More dif-
ficult or open-ended assignments are labeled with an asterisk.
Problems labeled with an EES icon will benefit from the use
of the Engineering Equation Solver (EES), while problems with a
computer icon may require the use of a computer. The stan-
dard end-of-chapter problems P4.1 to P4.98 (categorized in the
problem list here) are followed by word problems W4.1 to W4.10,
fundamentals of engineering exam problems FE4.1 to FE4.6, and
comprehensive problems C4.1 and C4.2.
Problem Distribution
Section Topic Problems
4.1 The acceleration of a fluid P4.1–P4.8
4.2 The continuity equation P4.9–P4.25
4.3 Linear momentum: Navier-Stokes P4.26–P4.38
4.4 Angular momentum: couple stresses P4.39
4.5 The differential energy equation P4.40–P4.41
4.6 Boundary conditions P4.42–P4.46
4.7 Stream function P4.47–P4.55
4.8 and 4.9 Velocity potential, vorticity P4.56–P4.67
4.7 and 4.9 Stream function and velocity potential P4.68–P4.78
4.10 Incompressible viscous flows P4.79–P4.96
4.10 Slip flows P4.97–P4.98
The acceleration of a fluid
P4.1 An idealized velocity field is given by the formula
Is this flow field steady or unsteady? Is it two- or three-
dimensional? At the point (x, y, z) (1, 1, 0), compute
(a) the acceleration vector and (b) any unit vector normal
to the acceleration.
P4.2 Flow through the converging nozzle in Fig. P4.2 can
be approximated by the one-dimensional velocity distri-
bution
u V0a1
2x
L
b 0 w 0
V 4txi 2t2
yj 4xzk
EES
(a) Find a general expression for the fluid acceleration
in the nozzle. (b) For the specific case V0 10 ft/s and
L 6 in, compute the acceleration, in g’s, at the entrance
and at the exit.
P4.2
P4.3 A two-dimensional velocity field is given by
in arbitrary units. At (x, y) (1, 2), compute (a) the
accelerations ax and ay, (b) the velocity component
in the direction 40°, (c) the direction of maxi-
mum velocity, and (d) the direction of maximum
acceleration.
P4.4 A simple flow model for a two-dimensional converging
nozzle is the distribution
(a) Sketch a few streamlines in the region 0 x/L 1 and
0 y/L 1, using the method of Section 1.11. (b) Find
expressions for the horizontal and vertical accelerations.
(c) Where is the largest resultant acceleration and its
numerical value?
P4.5 The velocity field near a stagnation point (see Example
1.12) may be written in the form
u
U0 x
L
U0 y
L
U0 and L are constants
u U0a1
x
L
b v U0
y
L
w 0
V (x2
y2
x)i (2xy y)j
V0
u = 3V0
x = L
x
x = 0
Problems 277
This chapter ended by discussing a few classical solutions for laminar viscous flows
(Couette flow due to moving walls, Poiseuille duct flow due to pressure gradient, and
flow between rotating cylinders). Whole books [4, 5, 9–11, 15] discuss classical
approaches to fluid mechanics, and other texts [6, 12–14] extend these studies to the
realm of continuum mechanics. This does not mean that all problems can be solved
analytically. The new field of computational fluid dynamics [1] shows great promise
of achieving approximate solutions to a wide variety of flow problems. In addition,
when the geometry and boundary conditions are truly complex, experimentation
(Chap. 5) is a preferred alternative.
whi29346_ch04_228-291.qxd 10/28/09 17:40 Page 277 Debd 208:MHDQ176:whi29346:0073529346:whi29346_pagefiles:](https://image.slidesharecdn.com/white09-220921151844-e1802c93/75/Seven-edition-in-fluid-mechanics-White-438-2048.jpg)
![(a) Show that the acceleration vector is purely radial.
(b) For the particular case L 1.5 m, if the acceleration
at (x, y) (1 m, 1 m) is 25 m/s2
, what is the value of U0?
P4.6 An incompressible plane flow has the velocity compo-
nents u 2y, 8x, w 0. (a) Find the acceleration
components. (b) Determine if the vector acceleration is
radial. (c) Which two streamlines of this flow are
straight lines?
P4.7 Consider a sphere of radius R immersed in a uniform
stream U0, as shown in Fig. P4.7. According to the
theory of Chap. 8, the fluid velocity along streamline AB
is given by
Find (a) the position of maximum fluid acceleration
along AB and (b) the time required for a fluid particle
to travel from A to B.
P4.7
P4.8 When a valve is opened, fluid flows in the expansion
duct of Fig. P4.8 according to the approximation
Find (a) the fluid acceleration at (x, t) (L, L/U) and
(b) the time for which the fluid acceleration at x L is
zero. Why does the fluid acceleration become negative
after condition (b)?
P4.8
The continuity equation
P4.9 An idealized incompressible flow has the proposed
three-dimensional velocity distribution
x = 0 x = L
u(x, t)
V iUa1
x
2L
b tanh
Ut
L
U0
A
x = –4R
B
y
x
Sphere
R
V ui U0 a1
R3
x3 bi
Find the appropriate form of the function f(y) that sat-
isfies the continuity relation.
P4.10 Consider the simple incompressible plane flow pattern u
U, V, and w 0, where U and V are constants.
(a) Convert these velocities into polar coordinate com-
ponents, r and . Hint: Make a sketch of the velocity
components. (b) Determine whether these new compo-
nents satisfy the continuity equation in polar coordinates.
P4.11 Derive Eq. (4.12b) for cylindrical coordinates by con-
sidering the flux of an incompressible fluid in and out
of the elemental control volume in Fig. 4.2.
P4.12 Spherical polar coordinates (r, , ) are defined in
Fig. P4.12. The cartesian transformations are
Do not show that the cartesian incompressible continu-
ity relation [Eq. (4.12a)] can be transformed to the
spherical polar form
What is the most general form of r when the flow is
purely radial—that is, and are zero?
P4.12
P4.13 For an incompressible plane flow in polar coordinates,
we are given
Find the appropriate form of circumferential velocity for
which continuity is satisfied.
r r3
cos r2
sin
y
x
z
P
θ
φ
υθ
r = constant
υφ
r
υr
1
r2
r
(r2
r)
1
r sin
( sin )
1
r sin
() 0
z r cos
y r sin sin
x r sin cos
V 4xy2
i f(y)j zy2
k
278 Chapter 4 Differential Relations for Fluid Flow
whi29346_ch04_228-291.qxd 10/28/09 17:41 Page 278 Debd 208:MHDQ176:whi29346:0073529346:whi29346_pagefiles:](https://image.slidesharecdn.com/white09-220921151844-e1802c93/75/Seven-edition-in-fluid-mechanics-White-439-2048.jpg)


![P4.34 A proposed three-dimensional incompressible flow field
has the following vector form:
(a) Determine if this field is a valid solution to conti-
nuity and Navier-Stokes. (b) If g gk, find the pres-
sure field p(x, y, z). (c) Is the flow irrotational?
P4.35 From the Navier-Stokes equations for incompressible
flow in polar coordinates (App. D for cylindrical coor-
dinates), find the most general case of purely circulat-
ing motion (r), r z 0, for flow with no slip
between two fixed concentric cylinders, as in Fig. P4.35.
P4.35
P4.36 A constant-thickness film of viscous liquid flows in
laminar motion down a plate inclined at angle , as in
Fig. P4.36. The velocity profile is
Find the constant C in terms of the specific weight and
viscosity and the angle . Find the volume flux Q per
unit width in terms of these parameters.
P4.36
*P4.37 A viscous liquid of constant and falls due to grav-
ity between two plates a distance 2h apart, as in
Fig. P4.37. The flow is fully developed, with a single
velocity component w w(x). There are no applied
g
y
u(y)
x
θ
h
u Cy(2h y) w 0
r
r = a
r = b
(r)
No slip
θ
υ
V Kxi Kyj 2Kzk
pressure gradients, only gravity. Solve the Navier-Stokes
equation for the velocity profile between the plates.
P4.37
P4.38 Show that the incompressible flow distribution, in cylin-
drical coordinates,
where C is a constant, (a) satisfies the Navier-Stokes
equation for only two values of n. Neglect gravity. (b)
Knowing that p p(r) only, find the pressure distribu-
tion for each case, assuming that the pressure at r R
is p0. What might these two cases represent?
Angular momentum: couple stresses
P4.39 Reconsider the angular momentum balance of Fig. 4.5 by
adding a concentrated body couple Cz about the z axis [6].
Determine a relation between the body couple and shear
stress for equilibrium. What are the proper dimensions for
Cz? (Body couples are important in continuous media
with microstructure, such as granular materials.)
The differential energy equation
P4.40 For pressure-driven laminar flow between parallel plates
(see Fig. 4.12b), the velocity components are u U(1–
y2
/h2
), 0, and w 0, where U is the centerline
velocity. In the spirit of Ex. 4.6, find the temperature
distribution T(y) for a constant wall temperature Tw.
P4.41 As mentioned in Sec. 4.10, the velocity profile for lam-
inar flow between two plates, as in Fig. P4.41, is
P4.41
y = h
y
y = 0
u(y) T(y)
x
Tw
Tw
vr 0 v Crn
vz 0
h h
x
z, w
Problems 281
whi29346_ch04_228-291.qxd 10/28/09 17:42 Page 281 Debd 208:MHDQ176:whi29346:0073529346:whi29346_pagefiles:](https://image.slidesharecdn.com/white09-220921151844-e1802c93/75/Seven-edition-in-fluid-mechanics-White-442-2048.jpg)


![K(x2
y2
), K
constant. Plot the streamlines in the full xy plane, find
any stagnation points, and interpret what the flow could
represent.
P4.50 In 1851, George Stokes (of Navier-Stokes fame) solved
the problem of steady incompressible low-Reynolds-
number flow past a sphere, using spherical polar coor-
dinates (r, ) [Ref. 5, page 168]. In these coordinates,
the equation of continuity is
u U0 constant, V0 constant
u
4umaxy(h y)
h2 w 0
(a) Does a stream function exist for these coordinates?
(b) If so, find its form.
P4.51 The velocity profile for pressure-driven laminar flow
between parallel plates (see Fig. 4.12b) has the form u
C(h2
– y2
), where C is a constant. (a) Determine if a
stream function exists. (b) If so, find a formula for the
stream function.
P4.52 A two-dimensional, incompressible, frictionless fluid is
guided by wedge-shaped walls into a small slot at the
origin, as in Fig. P4.52. The width into the paper is b,
P4.52
and the volume flow rate is Q. At any given distance r
from the slot, the flow is radial inward, with constant
velocity. Find an expression for the polar coordinate
stream function of this flow.
P4.53 For the fully developed laminar pipe flow solution of
Eq. (4.137), find the axisymmetric stream function](https://image.slidesharecdn.com/white09-220921151844-e1802c93/75/Seven-edition-in-fluid-mechanics-White-446-2048.jpg)


![P4.77 Outside an inner, intense-activity circle of radius R, a
tropical storm can be simulated by a polar-coordinate
velocity potential (r, ) UoR , where Uo is the wind
velocity at radius R. (a) Determine the velocity compo-
nents outside r R. (b) If, at R 25 mi, the velocity
is 100 mi/h and the pressure 99 kPa, calculate the veloc-
ity and pressure at r 100 mi.
P4.78 An incompressible, irrotational, two-dimensional flow
has the following stream function in polar coordinates:
Find an expression for the velocity potential of this flow.
Incompressible viscous flows
*P4.79 Study the combined effect of the two viscous flows in
Fig. 4.12. That is, find u(y) when the upper plate moves
at speed V and there is also a constant pressure gradi-
ent (dp/dx). Is superposition possible? If so, explain
why. Plot representative velocity profiles for (a) zero,
(b) positive, and (c) negative pressure gradients for the
same upper-wall speed V.
*P4.80 Oil, of density and viscosity , drains steadily down
the side of a vertical plate, as in Fig. P4.80. After a
development region near the top of the plate, the oil
film will become independent of z and of constant
thickness . Assume that w w(x) only and that the
atmosphere offers no shear resistance to the surface of
the film. (a) Solve the Navier-Stokes equation for w(x),
and sketch its approximate shape. (b) Suppose that film
thickness and the slope of the velocity profile at the
wall [w/x]wall are measured with a laser-Doppler
anemometer (Chap. 6). Find an expression for oil vis-
cosity as a function of (, , g, [w/x]wall).
P4.80
P4.81 Modify the analysis of Fig. 4.13 to find the velocity u
when the inner cylinder is fixed and the outer cylinder
rotates at angular velocity
0. May this solution be
z
␦
x
g
Oil film
Air
Plate](https://image.slidesharecdn.com/white09-220921151844-e1802c93/75/Seven-edition-in-fluid-mechanics-White-459-2048.jpg)


![Problems 287
*P4.89 Modify Prob. P4.88 so that the outer cylinder also
moves to the left at constant speed V. Find the velocity
distribution z(r). For what ratio V/U will the wall shear
stress be the same at both cylinder surfaces?
P4.90 It is desired to pump ethanol at 20°C through 25 m of
straight smooth tubing under laminar-flow conditions,
Red Vd/ 2300. The available pressure drop is 10
kPa. (a) What is the maximum possible mass flow, in
kg/h? (b) What is the appropriate diameter?
*P4.91 Consider two-dimensional, incompressible, steady
Couette flow (flow between two infinite parallel
plates with the upper plate moving at constant speed
and the lower plate stationary, as in Fig. 4.12a). Let
the fluid be nonnewtonian, with its viscous stresses
given by
where a and c are constants of the fluid. Make all the
same assumptions as in the derivation of Eq. (4.131).
(a) Find the velocity profile u(y). (b) How does the
velocity profile for this case compare to that of a new-
tonian fluid?
P4.92 A tank of area A0 is draining in laminar flow through a
pipe of diameter D and length L, as shown in Fig. P4.92.
Neglecting the exit jet kinetic energy and assuming the
pipe flow is driven by the hydrostatic pressure at its
entrance, derive a formula for the tank level h(t) if its
initial level is h0.
P4.92
Area Ao
h(t)
V(t)
,
D, L
yz zy 1
2aa
z
w
y
b
c
xz zx 1
2aa
u
z
w
x
b
c
xy yx 1
2aa
u
y
x
b
c
xx aa
u
x
b
c
yy aa
y
b
c
zz aa
w
z
b
c
P4.93 A number of straight 25-cm-long microtubes of diam-
eter d are bundled together into a “honeycomb” whose
total cross-sectional area is 0.0006 m2
. The pressure
drop from entrance to exit is 1.5 kPa. It is desired that
the total volume flow rate be 5 m3
/h of water at 20°C.
(a) What is the appropriate microtube diameter?
(b) How many microtubes are in the bundle? (c) What
is the Reynolds number of each microtube?
P4.94 A long solid cylinder rotates steadily in a very viscous
fluid, as in Fig. P4.94. Assuming laminar flow, solve the
Navier-Stokes equation in polar coordinates to deter-
mine the resulting velocity distribution. The fluid is at
rest far from the cylinder. [Hint: the cylinder does not
induce any radial motion.]
P4.94
*P4.95 Two immiscible liquids of equal thickness h are being
sheared between a fixed and a moving plate, as in Fig.
P4.95. Gravity is neglected, and there is no variation
with x. Find an expression for (a) the velocity at the
interface and (b) the shear stress in each fluid. Assume
steady laminar flow.
P4.95
V
x
h
h y
Fixed
ρ μ
2, 2
ρ μ
1, 1
r
R
ρ μ
Ω
,
whi29346_ch04_228-291.qxd 10/28/09 17:43 Page 287 Debd 208:MHDQ176:whi29346:0073529346:whi29346_pagefiles:](https://image.slidesharecdn.com/white09-220921151844-e1802c93/75/Seven-edition-in-fluid-mechanics-White-462-2048.jpg)


![292
Two engineers are dwarfed by a full-scale parachute being tested in 2007 at the NASA Ames
Research Center in Moffett Field, California. The wind tunnel, 80 ft high and 120 ft wide, is
the largest such facility in the world. The parachute, 55 ft in diameter, is intended to help land
an analytical roving laboratory on Mars in 2010. It has 80 suspension lines and is the largest
disk-gap-band type parachute [41] ever built. It was designed by Pioneer Aerospace of South
Windsor, Connecticut and can withstand loads in excess of 80,000 lbf. (Photo courtesy of NASA/
JPL-Caltech.)
whi29346_ch05_292-345.qxd 11/4/09 10:35 Page 292 Debd 208:MHDQ176:whi29346:0073529346:whi29346_pagefiles:](https://image.slidesharecdn.com/white09-220921151844-e1802c93/75/Seven-edition-in-fluid-mechanics-White-471-2048.jpg)
![293
Motivation. In this chapter we discuss the planning, presentation, and interpretation
of experimental data. We shall try to convince you that such data are best presented
in dimensionless form. Experiments that might result in tables of output, or even mul-
tiple volumes of tables, might be reduced to a single set of curves—or even a single
curve—when suitably nondimensionalized. The technique for doing this is dimen-
sional analysis. It is also effective in theoretical studies.
Chapter 3 presented large-scale control volume balances of mass, momentum, and
energy, which led to global results: mass flow, force, torque, total work done, or heat
transfer. Chapter 4 presented infinitesimal balances that led to the basic partial dif-
ferential equations of fluid flow and some particular solutions for both inviscid and
viscous (laminar) flow. These straight analytical techniques are limited to simple
geometries and uniform boundary conditions. Only a fraction of engineering flow
problems can be solved by direct analytical formulas.
Most practical fluid flow problems are too complex, both geometrically and phys-
ically, to be solved analytically. They must be tested by experiment or approximated
by computational fluid dynamics (CFD) [2]. These results are typically reported as
experimental or numerical data points and smoothed curves. Such data have much
more generality if they are expressed in compact, economic form. This is the moti-
vation for dimensional analysis. The technique is a mainstay of fluid mechanics and
is also widely used in all engineering fields plus the physical, biological, medical, and
social sciences. The present chapter shows how dimensional analysis improves the
presentation of both data and theory.
Basically, dimensional analysis is a method for reducing the number and complexity
of experimental variables that affect a given physical phenomenon, by using a sort
of compacting technique. If a phenomenon depends on n dimensional variables,
dimensional analysis will reduce the problem to only k dimensionless variables, where
the reduction n k 1, 2, 3, or 4, depending on the problem complexity. Generally
5.1 Introduction
Chapter 5
Dimensional Analysis
and Similarity
whi29346_ch05_292-345.qxd 11/4/09 10:35 Page 293 Debd 208:MHDQ176:whi29346:0073529346:whi29346_pagefiles:](https://image.slidesharecdn.com/white09-220921151844-e1802c93/75/Seven-edition-in-fluid-mechanics-White-472-2048.jpg)


![• Approach: The length scales are Lm 100 mm and Lp 1 mm. Calculate the Reynolds
number and force coefficient of the model and set them equal to prototype values:
Ans.
In like manner, using the prototype velocity just found, equate the force coefficients:
Ans.
• Comments: Assuming we modeled the Reynolds number correctly, the model test is a very
good idea, as it would obviously be difficult to measure such a tiny copepod drag force.
Historically, the first person to write extensively about units and dimensional
reasoning in physical relations was Euler in 1765. Euler’s ideas were far ahead of his
time, as were those of Joseph Fourier, whose 1822 book Analytical Theory of Heat
outlined what is now called the principle of dimensional homogeneity and even devel-
oped some similarity rules for heat flow. There were no further significant advances
until Lord Rayleigh’s book in 1877, Theory of Sound, which proposed a “method of
dimensions” and gave several examples of dimensional analysis. The final break-
through that established the method as we know it today is generally credited to
E. Buckingham in 1914 [1], whose paper outlined what is now called the Buckingham
Pi Theorem for describing dimensionless parameters (see Sec. 5.3). However, it is
now known that a Frenchman, A. Vaschy, in 1892 and a Russian, D. Riabouchinsky,
in 1911 had independently published papers reporting results equivalent to the pi the-
orem. Following Buckingham’s paper, P. W. Bridgman published a classic book in
1922 [3], outlining the general theory of dimensional analysis.
Dimensional analysis is so valuable and subtle, with both skill and art involved,
that it has spawned a wide variety of textbooks and treatises. The writer is aware of
more than 30 books on the subject, of which his engineering favorites are listed here
[3–10]. Dimensional analysis is not confined to fluid mechanics, or even to engi-
neering. Specialized books have been published on the application of dimensional
analysis to metrology [11], astrophysics [12], economics [13], chemistry [14], hydrol-
ogy [15], medications [16], clinical medicine [17], chemical processing pilot plants
[18], social sciences [19], biomedical sciences [20], pharmacy [21], fractal geometry
[22], and even the growth of plants [23]. Clearly this is a subject well worth learn-
ing for many career paths.
In making the remarkable jump from the five-variable Eq. (5.1) to the two-variable
Eq. (5.2), we were exploiting a rule that is almost a self-evident axiom in physics.
This rule, the principle of dimensional homogeneity (PDH), can be stated as follows:
5.2 The Principle of
Dimensional Homogeneity
Solve for Fp 7.3E-7N
CFp
Fp
(998 kg/m3
)(0.0253 m/s)2
(0.001 m)2
CFm
Fm
mV2
mL2
m
1.3 N
(1263 kg/m3
)(0.3 m/s)2
(0.1 m)2 1.14
Solve for Vp 0.0253 m/s 2.53 cm/s
Rem
mVm Lm
m
(1263 kg/m3
)(0.3 m/s)(0.1 m)
1.5 kg/(m-s)
25.3 Rep
(998 kg/m3
)Vp(0.001 m)
0.001 kg/(m-s)
296 Chapter 5 Dimensional Analysis and Similarity
whi29346_ch05_292-345.qxd 11/4/09 10:35 Page 296 Debd 208:MHDQ176:whi29346:0073529346:whi29346_pagefiles:](https://image.slidesharecdn.com/white09-220921151844-e1802c93/75/Seven-edition-in-fluid-mechanics-White-475-2048.jpg)


![resolve the process. A typical case is Manning’s open-channel formula, discussed
in Example 1.4:
(1)
Since V is velocity, R is a radius, and n and S are dimensionless, the formula is not
dimensionally homogeneous. This should be a warning that (1) the formula changes
if the units of V and R change and (2) if valid, it represents a very special case. Equa-
tion (1) in Example 1.4 predates the dimensional analysis technique and is valid only
for water in rough channels at moderate velocities and large radii in BG units.
Such dimensionally inhomogeneous formulas abound in the hydraulics literature.
Another example is the Hazen-Williams formula [24] for volume flow of water through
a straight smooth pipe:
(5.17)
where D is diameter and dp/dx is the pressure gradient. Some of these formulas arise
because numbers have been inserted for fluid properties and other physical data into
perfectly legitimate homogeneous formulas. We shall not give the units of Eq. (5.17)
to avoid encouraging its use.
On the other hand, some formulas are “constructs” that cannot be made dimen-
sionally homogeneous. The “variables” they relate cannot be analyzed by the dimen-
sional analysis technique. Most of these formulas are raw empiricisms convenient to
a small group of specialists. Here are three examples:
(5.18)
(5.19)
(5.20)
Equation (5.18) relates the Brinell hardness B of a metal to its Rockwell hardness
R. Equation (5.19) relates the specific gravity S of an oil to its density in degrees
API. Equation (5.20) relates the viscosity of a liquid in DE, or degrees Engler, to
its viscosity tR in Saybolt seconds. Such formulas have a certain usefulness when
communicated between fellow specialists, but we cannot handle them here. Vari-
ables like Brinell hardness and Saybolt viscosity are not suited to an MLT dimen-
sional system.
There are several methods of reducing a number of dimensional variables into a smaller
number of dimensionless groups. The first scheme given here was proposed in 1914 by
Buckingham [1] and is now called the Buckingham Pi Theorem. The name pi comes from
the mathematical notation , meaning a product of variables. The dimensionless groups
found from the theorem are power products denoted by 1, 2, 3, etc. The method
allows the pi groups to be found in sequential order without resorting to free exponents.
5.3 The Pi Theorem
0.0147DE
3.74
DE
0.26tR
172
tR
S
140
130 API
B
25,000
100 R
Q 61.9D2.63
a
dp
dx
b
0.54
V
1.49
n
R2/3
S1/2
302 Chapter 5 Dimensional Analysis and Similarity
whi29346_ch05_292-345.qxd 11/4/09 10:35 Page 302 Debd 208:MHDQ176:whi29346:0073529346:whi29346_pagefiles:](https://image.slidesharecdn.com/white09-220921151844-e1802c93/75/Seven-edition-in-fluid-mechanics-White-481-2048.jpg)


![from which a 1, b 0, or 3 /L. The proper dimensionless function is 3
f(2, 1), or
Ans. (1)
This is a complex three-variable function, but dimensional analysis alone can take us no
further.
Comments: We can “improve” Eq. (1) by taking advantage of some physical reasoning,
as Langhaar points out [4, p. 91]. For small elastic deflections, is proportional to load P
and inversely proportional to moment of inertia I. Since P and I occur separately in Eq. (1),
this means that 3 must be proportional to 2 and inversely proportional to 1. Thus, for
these conditions,
or (2)
This could not be predicted by a pure dimensional analysis. Strength-of-materials theory
predicts that the value of the constant is
The pi theorem method, just explained and illustrated, is often called the repeating
variable method of dimensional analysis. Select the repeating variables, add one more,
and you get a pi group. The writer likes it. This method is straightforward and sys-
tematically reveals all the desired pi groups. However, there are drawbacks: (1) All
pi groups contain the same repeating variables and might lack variety or effective-
ness, and (2) one must (sometimes laboriously) check that the selected repeating vari-
ables do not form a pi group among themselves (see Prob. P5.21).
Ipsen [5] suggests an entirely different procedure, a step-by-step method that
obtains all of the pi groups at once, without any counting or checking. One simply
successively eliminates each dimension in the desired function by division or multi-
plication. Let us illustrate with the same classical drag function proposed in Eq. (5.1).
Underneath the variables, write out the dimensions of each quantity.
F fcn(L, V, , ) (5.1)
{MLT2
} {L} {LT1
} {ML3
} {ML1
T1
}
There are three dimensions, {MLT}. Eliminate them successively by division or mul-
tiplication by a variable. Start with mass {M}. Pick a variable that contains mass and
divide it into all the other variables with mass dimensions. We select , divide, and
rewrite the function (5.1):
fcn L, V, , (5.1a)
{L4
T2
} {L} {LT1
} {ML3
} {L2
T1
}
b
a
F
An Alternate Step-by-Step Method
by Ipsen (1960)5
1
3.
(const)
PL3
EI
L
(const)
P
EL2
L4
I
L
f a
P
EL2,
I
L4b
5.3 The Pi Theorem 309
5
These two methods (the pi theorem versus Ipsen) are quite different. Both are useful and interesting.
whi29346_ch05_292-345.qxd 11/4/09 10:36 Page 309 Debd 208:MHDQ176:whi29346:0073529346:whi29346_pagefiles:](https://image.slidesharecdn.com/white09-220921151844-e1802c93/75/Seven-edition-in-fluid-mechanics-White-490-2048.jpg)


![Finally, eliminate {L} on the left side by dividing by C3
:
{1} {1} {1} {1}
We end up with four pi groups and recognize V/a as the Mach number, Ma. In aerody-
namics, the dimensionless moment is often called the moment coefficient , CM. Thus our final
result could be written in the compact form
CM fcn(, Ma, k) Ans.
Comments: Our analysis is fine, but experiment and theory and physical reasoning all indi-
cate that MLE varies more strongly with V than with a. Thus aerodynamicists commonly
define the moment coefficient as CM = MLE/(V2
C3
) or something similar. We will study
the analysis of supersonic forces and moments in Chap. 9.
We could use the pi theorem method of the previous section to analyze problem after
problem after problem, finding the dimensionless parameters that govern in each case.
Textbooks on dimensional analysis [for example, 5] do this. An alternative and very pow-
erful technique is to attack the basic equations of flow from Chap. 4. Even though these
equations cannot be solved in general, they will reveal basic dimensionless parameters,
such as the Reynolds number, in their proper form and proper position, giving clues to
when they are negligible. The boundary conditions must also be non-dimensionalized.
Let us briefly apply this technique to the incompressible flow continuity and
momentum equations with constant viscosity:
Continuity: V 0 (5.21a)
Navier-Stokes: (5.21b)
Typical boundary conditions for these two equations are (Sect. 4.6)
Fixed solid surface: V 0
Inlet or outlet: Known V, p (5.22)
Free surface, z :
We omit the energy equation (4.75) and assign its dimensionless form in the prob-
lems (Prob. P5.43).
Equations (5.21) and (5.22) contain the three basic dimensions M, L, and T. All
variables p, V, x, y, z, and t can be nondimensionalized by using density and two
reference constants that might be characteristic of the particular fluid flow:
Reference velocity U Reference length L
For example, U may be the inlet or upstream velocity and L the diameter of a body
immersed in the stream.
w
d
dt
p pa](https://image.slidesharecdn.com/white09-220921151844-e1802c93/75/Seven-edition-in-fluid-mechanics-White-493-2048.jpg)


![easier said than done, as we now discuss. There are specialized texts on model
testing [30–32].
Instead of complete similarity, the engineering literature speaks of particular types
of similarity, the most common being geometric, kinematic, dynamic, and thermal.
Let us consider each separately.
Geometric similarity concerns the length dimension {L} and must be ensured before
any sensible model testing can proceed. A formal definition is as follows:
A model and prototype are geometrically similar if and only if all body dimensions
in all three coordinates have the same linear scale ratio.
Note that all length scales must be the same. It is as if you took a photograph of the
prototype and reduced it or enlarged it until it fitted the size of the model. If the model
is to be made one-tenth the prototype size, its length, width, and height must each be
one-tenth as large. Not only that, but also its entire shape must be one-tenth as large,
and technically we speak of homologous points, which are points that have the same
relative location. For example, the nose of the prototype is homologous to the nose
of the model. The left wingtip of the prototype is homologous to the left wingtip of
the model. Then geometric similarity requires that all homologous points be related
by the same linear scale ratio. This applies to the fluid geometry as well as the model
geometry.
All angles are preserved in geometric similarity. All flow directions are preserved.
The orientations of model and prototype with respect to the surroundings must be
identical.
Figure 5.4 illustrates a prototype wing and a one-tenth-scale model. The model
lengths are all one-tenth as large, but its angle of attack with respect to the free stream
is the same for both model and prototype: 10° not 1°. All physical details on the model
must be scaled, and some are rather subtle and sometimes overlooked:
1. The model nose radius must be one-tenth as large.
2. The model surface roughness must be one-tenth as large.
Geometric Similarity
322 Chapter 5 Dimensional Analysis and Similarity
10°
Vp
(a)
a
Homologous
points
a
Vm
10°
40 m
8 m
0.8 m
4 m
(b)
*
1 m
*
0.1 m
Fig. 5.4 Geometric similarity in
model testing: (a) prototype;
(b) one-tenth-scale model.
whi29346_ch05_292-345.qxd 11/4/09 10:36 Page 322 Debd 208:MHDQ176:whi29346:0073529346:whi29346_pagefiles:](https://image.slidesharecdn.com/white09-220921151844-e1802c93/75/Seven-edition-in-fluid-mechanics-White-507-2048.jpg)
![3. If the prototype has a 5-mm boundary layer trip wire 1.5 m from the leading
edge, the model should have a 0.5-mm trip wire 0.15 m from its leading edge.
4. If the prototype is constructed with protruding fasteners, the model should have
homologous protruding fasteners one-tenth as large.
And so on. Any departure from these details is a violation of geometric similarity and
must be justified by experimental comparison to show that the prototype behavior was
not significantly affected by the discrepancy.
Models that appear similar in shape but that clearly violate geometric similarity
should not be compared except at your own risk. Figure 5.5 illustrates this point. The
spheres in Fig. 5.5a are all geometrically similar and can be tested with a high expec-
tation of success if the Reynolds number, Froude number, or the like is matched. But
the ellipsoids in Fig. 5.5b merely look similar. They actually have different linear scale
ratios and therefore cannot be compared in a rational manner, even though they may
have identical Reynolds and Froude numbers and so on. The data will not be the same
for these ellipsoids, and any attempt to “compare” them is a matter of rough engi-
neering judgment.
Kinematic similarity requires that the model and prototype have the same length scale
ratio and the same time scale ratio. The result is that the velocity scale ratio will be
the same for both. As Langhaar [4] states it:
The motions of two systems are kinematically similar if homologous particles lie
at homologous points at homologous times.
Length scale equivalence simply implies geometric similarity, but time scale equiva-
lence may require additional dynamic considerations such as equivalence of the
Reynolds and Mach numbers.
One special case is incompressible frictionless flow with no free surface, as sketched
in Fig. 5.6a. These perfect-fluid flows are kinematically similar with independent length
and time scales, and no additional parameters are necessary (see Chap. 8 for further
details).
Kinematic Similarity
5.5 Modeling and Its Pitfalls 323
Huge
sphere
(a)
(b)
Medium
sphere
Tiny
sphere
V1 V2 V3 V4
V1 V2 V3
Large 4:1
ellipsoid
Medium 3.5:1
ellipsoid
Small 3:1
ellipsoid
Large
sphere
Fig. 5.5 Geometric similarity and
dissimilarity of flows: (a) similar;
(b) dissimilar.
whi29346_ch05_292-345.qxd 11/4/09 10:36 Page 323 Debd 208:MHDQ176:whi29346:0073529346:whi29346_pagefiles:](https://image.slidesharecdn.com/white09-220921151844-e1802c93/75/Seven-edition-in-fluid-mechanics-White-508-2048.jpg)


![Second, consider aerodynamic model testing in air with no free surface. The
important parameters are the Reynolds number and the Mach number. Equation (5.34)
should be satisfied, plus the compressibility criterion
(5.36)
Elimination of Vm/Vp between (5.34) and (5.36) gives
(5.37)
Since the prototype is no doubt an air operation, we need a wind-tunnel fluid of low
viscosity and high speed of sound. Hydrogen is the only practical example, but clearly
it is too expensive and dangerous. Therefore wind tunnels normally operate with air
as the working fluid. Cooling and pressurizing the air will bring Eq. (5.37) into better
agreement but not enough to satisfy a length scale reduction of, say, one-tenth.
Therefore Reynolds number scaling is also commonly violated in aerodynamic testing,
and an extrapolation like that in Fig. 5.8 is required here also.
There are specialized monographs devoted entirely to wind tunnel testing: low
speed [38], high speed [39], and a detailed general discussion [40]. The following
example illustrates modeling discrepancies in aeronautical testing.
EXAMPLE 5.9
A prototype airplane, with a chord length of 1.6 m, is to fly at Ma 2 at 10 km standard
altitude. A one-eighth scale model is to be tested in a helium wind tunnel at 100°C and
1 atm. Find the helium test section velocity that will match (a) the Mach number or (b) the
Reynolds number of the prototype. In each case criticize the lack of dynamic similarity.
(c) What high pressure in the helium tunnel will match both the Mach and Reynolds num-
bers? (d) Why does part (c) still not achieve dynamic similarity?
Solution
For helium, from Table A.4, R 2077 m2
/(s2
-K), k 1.66, and estimate He 2.32 E5 kg/
( ) from the power-law, n 0.67, in the table. (a) Calculate the helium speed of sound
and velocity:
Ans. (a)
For dynamic similarity, the Reynolds numbers should also be equal. From Table A.6 at an
altitude of 10,000 m, read air 0.4125 kg/m3
, aair 299.5 m/s, and estimate air 1.48
E5 kg/ from the power-law, n 0.7, in Table A.4. The air velocity is Vair (Ma)(aair)
2(299.5) 599 m/s. The model chord length is (1.6 m)/8 0.2 m. The helium density
m # s
VHe 2268
m
s
Maair MaHe 2.0
VHe
aHe
VHe
1134 m/s
aHe 1(kRT)He 2(1.66)(2077 m2
/s2
K) (373 K) 1134 m/s
m # s
m
p
Lm
Lp
am
ap
Vm
am
Vp
ap
5.5 Modeling and Its Pitfalls 327
whi29346_ch05_292-345.qxd 11/4/09 10:36 Page 327 Debd 208:MHDQ176:whi29346:0073529346:whi29346_pagefiles:](https://image.slidesharecdn.com/white09-220921151844-e1802c93/75/Seven-edition-in-fluid-mechanics-White-512-2048.jpg)
![is He (p/RT)He (101,350 Pa)/[(2077 m2
/s2
K)(373 K)] 0.131 kg/m3
. Now calculate
the two Reynolds numbers:
The model Reynolds number is 10 times less than the prototype. This is typical when using
small-scale models. The test results must be extrapolated for Reynolds number effects.
(b) Now ignore Mach number and let the model Reynolds number match the prototype:
Ans. (b)
This is ridiculous: a hypersonic Mach number of 21, suitable for escaping from the earth’s
gravity. One should match the Mach numbers and correct for a lower Reynolds number.
(c) Match both Reynolds and Mach numbers by increasing the helium density:
Ma matches if
Then
Solve for
Ans. (c)
A match is possible if we increase the tunnel pressure by a factor of ten, a daunting task.
(d) Even with Ma and Re matched, we are still not dynamically similar because the two gases
have different specific heat ratios: kHe 1.66 and kair 1.40. This discrepancy will cause
substantial differences in pressure, density, and temperature throughout supersonic flow.
Figure 5.9 shows a hydraulic model of the Bluestone Lake Dam in West Virginia.
The model itself is located at the U.S. Army Waterways Experiment Station in
Vicksburg, MS. The horizontal scale is 1:65, which is sufficient that the vertical scale
can also be 1:65 without incurring significant surface tension (Weber number) effects.
Velocities are scaled by the Froude number. However, the prototype Reynolds num-
ber, which is of order 1E7, cannot be matched here. The engineers set the Reynolds
number at about 2E4, high enough for a reasonable approximation of prototype tur-
bulent flow viscous effects. Note the intense turbulence below the dam. The down-
stream bed, or apron, of a dam must be strengthened structurally to avoid bed erosion.
He 1.36
kg
m3 pHe RT 0He (1.36)(2077)(373) 1.05 E6 Pa
ReHe 26.6 E6
He(2268 m/s)(0.2 m)
2.32 E5 kg/(m # s)
VHe 2268
m
s
VHe 23,600
m
s
ReHe Reair 26.6 E6
(0.131 kg/m3
)VHe(0.2 m)
2.32 E5 kg/(m # s)
ReC,He
VC
`
He
(0.131 kg/m3
)(2268 m/s)(0.2 m)
2.32 E5 kg/(m # s)
2.56 E6
ReC,air
VC
`
air
(0.4125 kg/m3
)(599 m/s)(1.6 m)
1.48 E5 kg/(m # s)
26.6 E6
328 Chapter 5 Dimensional Analysis and Similarity
whi29346_ch05_292-345.qxd 11/4/09 10:36 Page 328 Debd 208:MHDQ176:whi29346:0073529346:whi29346_pagefiles:](https://image.slidesharecdn.com/white09-220921151844-e1802c93/75/Seven-edition-in-fluid-mechanics-White-513-2048.jpg)


![Problem Distribution
Section Topic Problems
5.1 Introduction P5.1–P5.9
5.2 The principle of dimensional homogeneity P5.10–P5.13
5.3 The pi theorem; Ipsen’s method P5.14–P5.42
5.4 Nondimensionalizing the basic equations P5.43–P5.47
5.4 Data for spheres, cylinders, other bodies P5.48–P5.59
5.5 Scaling of model data P5.60–P5.74
5.5 Froude and Mach number scaling P5.75–P5.84
5.5 Inventive rescaling of the data P5.85–P5.91
Introduction; dynamic similarity
P5.1 For axial flow through a circular tube, the Reynolds num-
ber for transition to turbulence is approximately 2300 [see
Eq. (6.2)], based on the diameter and average velocity. If
d 5 cm and the fluid is kerosene at 20°C, find the vol-
ume flow rate in m3
/h that causes transition.
P5.2 A prototype automobile is designed for cold weather in
Denver, CO (10°C, 83 kPa). Its drag force is to be tested
on a one-seventh-scale model in a wind tunnel at 150 mi/h,
20°C and 1 atm. If the model and prototype are to satisfy
dynamic similarity, what prototype velocity, in mi/h,
needs to be matched? Comment on your result.
P5.3 The transfer of energy by viscous dissipation is dependent
upon viscosity , thermal conductivity k, stream velocity
U, and stream temperature T0. Group these quantities, if
possible, into the dimensionless Brinkman number, which
is proportional to .
P5.4 When tested in water at 20°C flowing at 2 m/s, an 8-cm-
diameter sphere has a measured drag of 5 N. What will
be the velocity and drag force on a 1.5-m-diameter
weather balloon moored in sea-level standard air under
dynamically similar conditions?
P5.5 An automobile has a characteristic length and area of 8 ft
and 60 ft2
, respectively. When tested in sea-level standard
air, it has the following measured drag force versus speed:
V, mi/h 20 40 60
Drag, lbf 31 115 249
The same car travels in Colorado at 65 mi/h at an altitude
of 3500 m. Using dimensional analysis, estimate (a) its
drag force and (b) the horsepower required to overcome
air drag.
P5.6 The full-scale parachute in the chapter-opener photo had
a drag force of approximately 950 lbf when tested at a
velocity of 12 mi/h in air at 20°C and 1 atm. Earlier, a
model parachute of diameter 1.7 m was tested in the same
tunnel. (a) For dynamic similarity, what should be the air
velocity for the model? (b) What is the expected drag
force of the model? (c) Is there anything surprising about
your result to part (b)?
P5.7 A body is dropped on the moon (g 1.62 m/s2
) with an
initial velocity of 12 m/s. By using option 2 variables,
Eq. (5.11), the ground impact occurs at t** 0.34 and
S** 0.84. Estimate (a) the initial displacement, (b) the
final displacement, and (c) the time of impact.
P5.8 The Morton number Mo, used to correlate bubble dynam-
ics studies, is a dimensionless combination of accelera-
tion of gravity g, viscosity , density , and surface ten-
sion coefficient . If Mo is proportional to g, find its
form.
P5.9 The Richardson number, Ri, which correlates the
production of turbulence by buoyancy, is a dimension-
less combination of the acceleration of gravity g, the
fluid temperature T0, the local temperature gradient
, and the local velocity gradient . Determine
the form of the Richardson number if it is proportional
to g.
The principle of dimensional homogeneity
P5.10 Determine the dimension {MLT} of the following
quantities:
(a) (b) (c)
(d)
All quantities have their standard meanings; for example,
is density.
P5.11 During World War II, Sir Geoffrey Taylor, a British
fluid dynamicist, used dimensional analysis to estimate
the wave speed of an atomic bomb explosion. He
assumed that the blast wave radius R was a function of
energy released E, air density , and time t. Use dimen-
sional reasoning to show how wave radius must vary
with time.
P5.12 The Stokes number, St, used in particle dynamics studies,
is a dimensionless combination of five variables: acceler-
ation of gravity g, viscosity , density , particle veloc-
ity U, and particle diameter D. (a) If St is proportional to
and inversely proportional to g, find its form. (b) Show
that St is actually the quotient of two more traditional
dimensionless groups.
P5.13 The speed of propagation C of a capillary wave in deep
water is known to be a function only of density ,
wavelength , and surface tension . Find the proper
functional relationship, completing it with a dimension-
less constant. For a given density and wavelength, how
does the propagation speed change if the surface tension
is doubled?
u
t
dx dy dz
cp
2
T
x y
2
1
(p p0) dA
u
u
x
u/z
T/z
334 Chapter 5 Dimensional Analysis and Similarity
whi29346_ch05_292-345.qxd 11/9/09 7:43PM Page 334 ntt 208:MHDQ176:whi29346:0073529346:whi29346_pagefiles:](https://image.slidesharecdn.com/white09-220921151844-e1802c93/75/Seven-edition-in-fluid-mechanics-White-519-2048.jpg)


![is
negligible? Hint: Take , , and g as repeating variables.
P5.20 A fixed cylinder of diameter D and length L, immersed in
a stream flowing normal to its axis at velocity U, will
experience zero average lift. However, if the cylinder is
rotating at angular velocity , a lift force F will arise. The
fluid density is important, but viscosity is secondary and
can be neglected. Formulate this lift behavior as a dimen-
sionless function.
5MT3
1
6
P5.21 In Example 5.1 we used the pi theorem to develop
Eq. (5.2) from Eq. (5.1). Instead of merely listing the pri-
mary dimensions of each variable, some workers list the
powers of each primary dimension for each variable in an
array:
This array of exponents is called the dimensional
matrix for the given function. Show that the rank of
this matrix (the size of the largest nonzero determi-
nant) is equal to j n k, the desired reduction
between original variables and the pi groups. This is a
general property of dimensional matrices, as noted by
Buckingham [1].
P5.22 When freewheeling, the angular velocity of a windmill
is found to be a function of the windmill diameter D, the
wind velocity V, the air density , the windmill height H
as compared to the atmospheric boundary layer height L,
and the number of blades N:
Viscosity effects are negligible. Find appropriate pi
groups for this problem and rewrite the function in dimen-
sionless form.
P5.23 The period T of vibration of a beam is a function of
its length L, area moment of inertia I, modulus of
elasticity E, density , and Poisson’s ratio
. Rewrite
this relation in dimensionless form. What further
reduction can we make if E and I can occur only in
the product form EI? Hint: Take L, , and E as repeat-
ing variables.
P5.24 The lift force F on a missile is a function of its length
L, velocity V, diameter D, angle of attack , density
, viscosity , and speed of sound a of the air. Write
out the dimensional matrix of this function and deter-
mine its rank. (See Prob. P5.21 for an explanation of
this concept.) Rewrite the function in terms of pi
groups.
P5.25 The thrust F of a propeller is generally thought to be a
function of its diameter D and angular velocity , the
forward speed V, and the density and viscosity of
the fluid. Rewrite this relationship as a dimensionless
function.
P5.26 A pendulum has an oscillation period T which is
assumed to depend on its length L, bob mass m, angle
fcnaD, V, ,
H
L
, Nb
F L U
M 1 0 0 1 1
L £ 1 1 1 3 1§
T 2 0 1 0 1
Problems 335
whi29346_ch05_292-345.qxd 11/4/09 10:37 Page 335 Debd 208:MHDQ176:whi29346:0073529346:whi29346_pagefiles:](https://image.slidesharecdn.com/white09-220921151844-e1802c93/75/Seven-edition-in-fluid-mechanics-White-522-2048.jpg)


![338 Chapter 5 Dimensional Analysis and Similarity
P5.50 The parachute in the chapter-opener photo is, of course,
meant to decelerate the payload on Mars. The wind tun-
nel test gave a drag coefficient of about 1.1, based upon
the projected area of the parachute. Suppose it was falling
on earth and, at an altitude of 1000 m, showed a steady
descent rate of about 18 mi/h. Estimate the weight of the
payload.
P5.51 A ship is towing a sonar array that approximates a sub-
merged cylinder 1 ft in diameter and 30 ft long with its
axis normal to the direction of tow. If the tow speed is
12 kn (1 kn 1.69 ft/s), estimate the horsepower required
to tow this cylinder. What will be the frequency of vor-
tices shed from the cylinder? Use Figs. 5.2 and 5.3.
P5.52 When fluid in a long pipe starts up from rest at a uniform
acceleration a, the initial flow is laminar. The flow under-
goes transition to turbulence at a time t* which depends,
to first approximation, only upon a, , and . Experiments
by P. J. Lefebvre, on water at 20°C starting from rest with
1-g acceleration in a 3-cm-diameter pipe, showed transi-
tion at t* 1.02 s. Use this data to estimate (a) the tran-
sition time and (b) the transition Reynolds number ReD
for water flow accelerating at 35 m/s2
in a 5-cm-diame-
ter pipe.
P5.53 Vortex shedding can be used to design a vortex flowmeter
(Fig. 6.33). A blunt rod stretched across the pipe sheds vor-
tices whose frequency is read by the sensor downstream.
Suppose the pipe diameter is 5 cm and the rod is a cylin-
der of diameter 8 mm. If the sensor reads 5400 counts per
minute, estimate the volume flow rate of water in m3
/h.
How might the meter react to other liquids?
P5.54 A fishnet is made of 1-mm-diameter strings knotted into
2 2 cm squares. Estimate the horsepower required to
tow 300 ft2
of this netting at 3 kn in seawater at 20°C.
The net plane is normal to the flow direction.
P5.55 The radio antenna on a car begins to vibrate wildly at 8 Hz
when the car is driven at 45 mi/h over a rutted road that
approximates a sine wave of amplitude 2 cm and wave-
length 2.5 m. The antenna diameter is 4 mm. Is the
vibration due to the road or to vortex shedding?
P5.56 Flow past a long cylinder of square cross-section results
in more drag than the comparable round cylinder. Here
are data taken in a water tunnel for a square cylinder of
side length b 2 cm:
V, m/s 1.0 2.0 3.0 4.0
Drag, N/(m of depth) 21 85 191 335
(a) Use these data to predict the drag force per unit depth
of wind blowing at 6 m/s, in air at 20°C, over a tall square
chimney of side length b 55 cm. (b) Is there any uncer-
tainty in your estimate?
P5.57 The simply supported 1040 carbon-steel rod of Fig. P5.57
is subjected to a crossflow stream of air at 20°C and
1 atm. For what stream velocity U will the rod center
deflection be approximately 1 cm?
P5.57
P5.58 For the steel rod of Prob. P5.57, at what airstream
velocity U will the rod begin to vibrate laterally in
resonance in its first mode (a half sine wave)? Hint:
Consult a vibration text [34,35] under “lateral beam
vibration.”
P5.59 A long, slender, smooth 3-cm-diameter flagpole bends
alarmingly in 20 mi/h sea-level winds, causing patriotic
citizens to gasp. An engineer claims that the pole will
bend less if its surface is deliberately roughened. Is she
correct, at least qualitatively?
Scaling of model data
*P5.60 The thrust F of a free propeller, either aircraft or
marine, depends upon density , the rotation rate n in
r/s, the diameter D, and the forward velocity V. Viscous
effects are slight and neglected here. Tests of a 25-cm-
diameter model aircraft propeller, in a sea-level wind
tunnel, yield the following thrust data at a velocity of
20 m/s:
Rotation rate, r/min 4800 6000 8000
Measured thrust, N 6.1 19 47
(a) Use this data to make a crude but effective dimen-
sionless plot. (b) Use the dimensionless data to predict
the thrust, in newtons, of a similar 1.6-m-diameter pro-
totype propeller when rotating at 3800 r/min and flying
at 225 mi/h at 4000-m standard altitude.
P5.61 If viscosity is neglected, typical pump flow results from
Example 5.3 are shown in Fig. P5.61 for a model pump
tested in water. The pressure rise decreases and the power
required increases with the dimensionless flow coefficient.
Curve-fit expressions are given for the data. Suppose a
similar pump of 12-cm diameter is built to move gasoline
at 20°C and a flow rate of 25 m 3
/h. If the pump rotation
speed is 30 r/s, find (a) the pressure rise and (b) the power
required.
U
D = 1 cm, L = 60 cm
δ = 1 cm?
EES
EES
whi29346_ch05_292-345.qxd 11/4/09 10:37 Page 338 Debd 208:MHDQ176:whi29346:0073529346:whi29346_pagefiles:](https://image.slidesharecdn.com/white09-220921151844-e1802c93/75/Seven-edition-in-fluid-mechanics-White-530-2048.jpg)


![L)
/L
L2
/,
L/,
L/,
2
L2
/,
Comprehensive Problems 343
Comprehensive Problems
C5.1 Estimating pipe wall friction is one of the most common
tasks in fluids engineering. For long circular rough pipes in
turbulent flow, wall shear w is a function of density , vis-
cosity , average velocity V, pipe diameter d, and wall
roughness height . Thus, functionally, we can write w
fcn(, , V, d, ). (a) Using dimensional analysis, rewrite this
function in dimensionless form. (b) A certain pipe has d
5 cm and 0.25 mm. For flow of water at 20°C, meas-
urements show the following values of wall shear stress:
Q, gal/min 1.5 3.0 6.0 9.0 12.0 14.0
w, Pa 0.05 0.18 0.37 0.64 0.86 1.25
Plot these data using the dimensionless form obtained in
part (a) and suggest a curve-fit formula. Does your plot
reveal the entire functional relation obtained in part (a)?
C5.2 When the fluid exiting a nozzle, as in Fig. P3.49, is a gas,
instead of water, compressibility may be important, espe-
cially if upstream pressure p1 is large and exit diameter d2
is small. In this case, the difference p1 p2 is no longer con-
trolling, and the gas mass flow ṁ reaches a maximum value
that depends on p1 and d2 and also on the absolute upstream
temperature T1 and the gas constant R. Thus, functionally,
ṁ fcn(p1, d2, T1, R). (a) Using dimensional analysis,
rewrite this function in dimensionless form. (b) A certain
pipe has d2 1 cm. For flow of air, measurements show the
following values of mass flow through the nozzle:
T1, K 300 300 300 500 800
p1, kPa 200 250 300 300 300
ṁ, kg/s 0.037 0.046 0.055 0.043 0.034
Plot these data in the dimensionless form obtained in part
(a). Does your plot reveal the entire functional relation
obtained in part (a)?
C5.3 Reconsider the fully developed draining vertical oil film
problem (see Fig. P4.80) as an exercise in dimensional
analysis. Let the vertical velocity be a function only of dis-
tance from the plate, fluid properties, gravity, and film
thickness. That is, w fcn(x, , , g, ). (a) Use the pi
theorem to rewrite this function in terms of dimensionless
parameters. (b) Verify that the exact solution from Prob.
P4.80 is consistent with your result in part (a).
C5.4 The Taco Inc. model 4013 centrifugal pump has an
impeller of diameter D 12.95 in. When pumping 20°C
water at 1160 r/min, the measured flow rate Q and
pressure rise p are given by the manufacturer as follows:
Q, gal/min 200 300 400 500 600 700
p, lb/in2
36 35 34 32 29 23
(a) Assuming that p fcn(, Q, D, ), use the pi theo-
rem to rewrite this function in terms of dimensionless
parameters and then plot the given data in dimensionless
form. (b) It is desired to use the same pump, running at
900 r/min, to pump 20°C gasoline at 400 gal/min. Accord-
ing to your dimensionless correlation, what pressure rise
p is expected, in lbf/in2
?
C5.5 Does an automobile radio antenna vibrate in resonance due
to vortex shedding? Consider an antenna of length L and
diameter D. According to beam vibration theory [see
[34, 35], p. 401], the first mode natural frequency of a solid
circular cantilever beam is
n 3.516[EI/(AL4
)]1/2
,
whi29346_ch05_292-345.qxd 11/4/09 10:37 Page 343 Debd 208:MHDQ176:whi29346:0073529346:whi29346_pagefiles:](https://image.slidesharecdn.com/white09-220921151844-e1802c93/75/Seven-edition-in-fluid-mechanics-White-538-2048.jpg)
![References
1. E. Buckingham, “On Physically Similar Systems: Illustra-
tions of the Use of Dimensional Equations,” Phys. Rev.,
vol. 4, no. 4, 1914, pp. 345–376.
2. J. D. Anderson, Computational Fluid Dynamics: The Basics
with Applications, McGraw-Hill, New York, 1995.
344 Chapter 5 Dimensional Analysis and Similarity
Design Projects
D5.1 We are given laboratory data, taken by Prof. Robert Kirchhoff
and his students at the University of Massachusetts, for the
spin rate of a 2-cup anemometer. The anemometer was
made of ping-pong balls (d 1.5 in) split in half, facing
in opposite directions, and glued to thin ( -in) rods pegged
to a center axle. (See Fig. P7.91 for a sketch.) There were
four rods, of lengths l 0.212, 0.322, 0.458, and 0.574 ft.
The experimental data, for wind tunnel velocity U and
rotation rate , are as follows:
l 0.212 l 0.322 l 0.458 l 0.574
U, ft/s , r/min U, ft/s , r/min U, ft/s , r/min U, ft/s , r/min
18.95 435 18.95 225 20.10 140 23.21 115
22.20 545 23.19 290 26.77 215 27.60 145
25.90 650 29.15 370 31.37 260 32.07 175
29.94 760 32.79 425 36.05 295 36.05 195
38.45 970 38.45 495 39.03 327 39.60 215
Assume that the angular velocity of the device is a func-
tion of wind speed U, air density and viscosity , rod
length l, and cup diameter d. For all data, assume air is at
1 atm and 20°C. Define appropriate pi groups for this prob-
lem, and plot the data in this dimensionless manner. Com-
ment on the possible uncertainty of the results.
As a design application, suppose we are to use this
anemometer geometry for a large-scale (d 30 cm) airport
wind anemometer. If wind speeds vary up to 25 m/s and we
desire an average rotation rate 120 r/min, what should
be the proper rod length? What are possible limitations of
your design? Predict the expected (in r/min) of your design
as affected by wind speeds from 0 to 25 m/s.
D5.2 By analogy with the cylinder drag data in Fig. 5.3b,
spheres also show a strong roughness effect on drag, at
least in the Reynolds number range 4 E4 ReD 3 E5,
which accounts for the dimpling of golf balls to increase
their distance traveled. Some experimental data for
roughened spheres [33] are given in Fig. D5.2. The figure
1
4
also shows typical golf ball data. We see that some rough-
ened spheres are better than golf balls in some regions. For
the present study, let us neglect the ball’s spin, which causes
the very important side-force or Magnus effect (see
Fig. 8.15) and assume that the ball is hit without spin and
follows the equations of motion for plane motion (x, z):
mẋ˙
F cos](https://image.slidesharecdn.com/white09-220921151844-e1802c93/75/Seven-edition-in-fluid-mechanics-White-539-2048.jpg)


![347
Motivation. This chapter is completely devoted to an important practical fluids engi-
neering problem: flow in ducts with various velocities, various fluids, and various duct
shapes. Piping systems are encountered in almost every engineering design and thus
have been studied extensively. There is a small amount of theory plus a large amount
of experimentation.
The basic piping problem is this: Given the pipe geometry and its added compo-
nents (such as fittings, valves, bends, and diffusers) plus the desired flow rate and
fluid properties, what pressure drop is needed to drive the flow? Of course, it may be
stated in alternative form: Given the pressure drop available from a pump, what flow
rate will ensue? The correlations discussed in this chapter are adequate to solve most
such piping problems.
Now that we have derived and studied the basic flow equations in Chap. 4, you would
think that we could just whip off myriad beautiful solutions illustrating the full range
of fluid behavior, of course expressing all these educational results in dimensionless
form, using our new tool from Chap. 5, dimensional analysis.
The fact of the matter is that no general analysis of fluid motion yet exists. There
are several dozen known particular solutions, there are many approximate digital com-
puter solutions, and there are a great many experimental data. There is a lot of the-
ory available if we neglect such important effects as viscosity and compressibility
(Chap. 8), but there is no general theory and there may never be. The reason is that
a profound and vexing change in fluid behavior occurs at moderate Reynolds num-
bers. The flow ceases being smooth and steady (laminar) and becomes fluctuating and
agitated (turbulent). The changeover is called transition to turbulence. In Fig. 5.3a
we saw that transition on the cylinder and sphere occurred at about Re 3 105
,
where the sharp drop in the drag coefficient appeared. Transition depends on many
effects, such as wall roughness (Fig. 5.3b) or fluctuations in the inlet stream, but the
primary parameter is the Reynolds number. There are a great many data on transition
but only a small amount of theory [1 to 3].
Turbulence can be detected from a measurement by a small, sensitive instrument
such as a hot-wire anemometer (Fig. 6.29e) or a piezoelectric pressure transducer. The
6.1 Reynolds Number Regimes
Chapter 6
Viscous Flow in Ducts
whi29346_ch06_346-455.qxd 11/4/09 10:38 Page 347 Debd 208:MHDQ176:whi29346:0073529346:whi29346_pagefiles:](https://image.slidesharecdn.com/white09-220921151844-e1802c93/75/Seven-edition-in-fluid-mechanics-White-546-2048.jpg)


![trajectories joined by a liquid sheet. The higher-Reynolds-number turbulent flow (Fig.
6.2b) is unsteady and irregular but, when averaged over time, is steady and predictable.
How did turbulence form inside the pipe? The laminar parabolic flow profile, which
is similar to Eq. (4.146), became unstable and, at Red 2300, began to form “slugs”
or “puffs” of intense turbulence. A puff has a fast-moving front and a slow-moving
rear and may be visualized by experimenting with glass tube flow. Figure 6.3 shows
a puff as photographed by Bandyopadhyay [45]. Near the entrance (Fig. 6.3a and b)
there is an irregular laminar–turbulent interface, and vortex roll-up is visible. Further
downstream (Fig. 6.3c) the puff becomes fully turbulent and very active, with helical
motions visible. Far downstream (Fig. 6.3d) the puff is cone-shaped and less active,
with a fuzzy ill-defined interface, sometimes called the “relaminarization” region.
A complete description of the statistical aspects of turbulence is given in Ref. 1, while
theory and data on transition effects are given in Refs. 2 and 3. At this introductory
level we merely point out that the primary parameter affecting transition is the Reynolds
number. If Re UL/, where U is the average stream velocity and L is the “width,”
or transverse thickness, of the shear layer, the following approximate ranges occur:
0 Re 1: highly viscous laminar “creeping” motion
1 Re 100: laminar, strong Reynolds number dependence
100 Re 103
: laminar, boundary layer theory useful
103
Re 104
: transition to turbulence
104
Re 106
: turbulent, moderate Reynolds number dependence
106
Re : turbulent, slight Reynolds number dependence
These representative ranges vary somewhat with flow geometry, surface roughness,
and the level of fluctuations in the inlet stream. The great majority of our analyses
are concerned with laminar flow or with turbulent flow, and one should not normally
design a flow operation in the transition region.
350 Chapter 6 Viscous Flow in Ducts
(a)
Flow
(b)
(c)
(d)
Fig. 6.3 Formation of a turbulent
puff in pipe flow: (a) and (b) near
the entrance; (c) somewhat down-
stream; (d) far downstream. (Cour-
tesy of Cambridge University
Press–P. R. Bandyopadhyay,
“ Aspects of the Equilibrium Puff
in Transitional Pipe Flow,” Journal
of Fluid Mechanics, vol. 163,
1986, pp. 439–458.)
whi29346_ch06_346-455.qxd 11/4/09 10:38 Page 350 Debd 208:MHDQ176:whi29346:0073529346:whi29346_pagefiles:](https://image.slidesharecdn.com/white09-220921151844-e1802c93/75/Seven-edition-in-fluid-mechanics-White-549-2048.jpg)

![p V1.75
seems impossible on dimensional grounds but is easily explained when
the dimensionless pipe flow data (Fig. 5.10) are displayed.
In 1883 Osborne Reynolds, a British engineering professor, showed that the change
depended on the parameter Vd/, now named in his honor. By introducing a dye
streak into a pipe flow, Reynolds could observe transition and turbulence. His sketches
[4] of the flow behavior are shown in Fig. 6.5.
If we examine Hagen’s data and compute the Reynolds number at V 1.1 ft/s,
we obtain Red 2100. The flow became fully turbulent, V 2.2 ft/s, at Red 4200.
The accepted design value for pipe flow transition is now taken to be
(6.2)
This is accurate for commercial pipes (Fig. 6.13), although with special care in pro-
viding a rounded entrance, smooth walls, and a steady inlet stream, Red,crit can be
delayed until much higher values. The study of transition in pipe flow, both experi-
mentally and theoretically, continues to be a fascinating topic for researchers, as dis-
cussed in a recent review article [55]. Note: The value of 2300 is for transition in
pipes. Other geometries, such as plates, airfoils, cylinders, and spheres, have com-
pletely different transition Reynolds numbers.
Transition also occurs in external flows around bodies such as the sphere and cylin-
der in Fig. 5.3. Ludwig Prandtl, a German engineering professor, showed in 1914 that
the thin boundary layer surrounding the body was undergoing transition from lami-
nar to turbulent flow. Thereafter the force coefficient of a body was acknowledged to
be a function of the Reynolds number [Eq. (5.2)].
There are now extensive theories and experiments of laminar flow instability that
explain why a flow changes to turbulence. Reference 5 is an advanced textbook on
this subject.
Laminar flow theory is now well developed, and many solutions are known [2, 3],
but no analyses can simulate the fine-scale random fluctuations of turbulent flow.1
Therefore most turbulent flow theory is semiempirical, based on dimensional analy-
sis and physical reasoning; it is concerned with the mean flow properties only and the
mean of the fluctuations, not their rapid variations. The turbulent flow “theory” pre-
sented here in Chaps. 6 and 7 is unbelievably crude yet surprisingly effective. We
shall attempt a rational approach that places turbulent flow analysis on a firm physi-
cal basis.
Both laminar and turbulent flow may be either internal (that is, “bounded” by walls)
or external and unbounded. This chapter treats internal flows, and Chap. 7 studies
external flows.
An internal flow is constrained by the bounding walls, and the viscous effects
will grow and meet and permeate the entire flow. Figure 6.6 shows an internal flow
in a long duct. There is an entrance region where a nearly inviscid upstream flow
converges and enters the tube. Viscous boundary layers grow downstream, retard-
ing the axial flow u(r, x) at the wall and thereby accelerating the center core flow
6.2 Internal versus External
Viscous Flows
Red,crit 2300
352 Chapter 6 Viscous Flow in Ducts
Needle
Tank
Dye filament
(a)
(b)
(c)
Fig. 6.5 Reynolds’ sketches of pipe
flow transition: (a) low-speed, lam-
inar flow; (b) high-speed, turbulent
flow; (c) spark photograph of con-
dition (b). (From Ref. 4.)
1
However, direct numerical simulation (DNS) of low-Reynolds-number turbulence is now quite
common [32].
whi29346_ch06_346-455.qxd 11/4/09 10:38 Page 352 Debd 208:MHDQ176:whi29346:0073529346:whi29346_pagefiles:](https://image.slidesharecdn.com/white09-220921151844-e1802c93/75/Seven-edition-in-fluid-mechanics-White-551-2048.jpg)
![to maintain the incompressible continuity requirement
(6.3)
At a finite distance from the entrance, the boundary layers merge and the inviscid
core disappears. The tube flow is then entirely viscous, and the axial velocity adjusts
slightly further until at x Le it no longer changes with x and is said to be fully
developed, u u(r) only. Downstream of x Le the velocity profile is constant, the
wall shear is constant, and the pressure drops linearly with x, for either laminar or
turbulent flow. All these details are shown in Fig. 6.6.
Dimensional analysis shows that the Reynolds number is the only parameter affect-
ing entrance length. If
then (6.4)
For laminar flow [2, 3], the accepted correlation is
(6.5)
Le
d
0.06 Red laminar
Le
d
ga
Vd
b g(Red)
Le f(d, V, , ) V
Q
A
Q u dA const
6.2 Internal versus External Viscous Flows 353
Inviscid
core flow
0 Le
x
Entrance
pressure
drop
Linear
pressure
drop in
fully developed
flow region
Pressure
Entrance length Le
(developing profile region)
Growing
boundary
layers
Boundary
layers
merge
Developed
velocity
profile u(r)
u(r, x)
x
r
Fully developed
flow region
Fig. 6.6 Developing velocity
profiles and pressure changes in
the entrance of a duct flow.
whi29346_ch06_346-455.qxd 11/4/09 10:38 Page 353 Debd 208:MHDQ176:whi29346:0073529346:whi29346_pagefiles:](https://image.slidesharecdn.com/white09-220921151844-e1802c93/75/Seven-edition-in-fluid-mechanics-White-552-2048.jpg)
![The maximum laminar entrance length, at Red,crit 2300, is Le 138d, which is the
longest development length possible.
In turbulent flow, the boundary layers grow faster, and Le is relatively shorter. For
decades, the writer has favored a sixth-power-law estimate, , but
recent CFD results, communicated by Fabien Anselmet, and separately by Sukanta
Dash, indicate that a better turbulent entrance-length correlation is
(6.6)
Some computed turbulent entrance-length estimates are thus
Red 4000 104
105
106
107
Le/d 13 16 28 51 90
Now 90 diameters may seem “long,” but typical pipe flow applications involve an
L/d value of 1000 or more, in which case the entrance effect may be neglected and
a simple analysis made for fully developed flow. This is possible for both laminar and
turbulent flows, including rough walls and noncircular cross sections.
EXAMPLE 6.2
A -in-diameter water pipe is 60 ft long and delivers water at 5 gal/min at 20°C. What frac-
tion of this pipe is taken up by the entrance region?
Solution
Convert
The average velocity is
From Table 1.4 read for water 1.01 10 6
m2
/s 1.09 10 5
ft2
/s. Then the pipe
Reynolds number is
This is greater than 4000; hence the flow is fully turbulent, and Eq. (6.6) applies for entrance
length:
The actual pipe has L/d (60 ft)/[( /12)ft] 1440. Hence the entrance region takes up the
fraction
Ans.
This is a very small percentage, so that we can reasonably treat this pipe flow as essentially
fully developed.
Le
L
21
1440
0.015 1.5%
1
2
Le
d
1.6 Red
1/4
(1.6)(31,300)1/4
21
Red
Vd
(8.17 ft/s)3(1
2/12) ft4
1.09 10 5
ft2
/s
31,300
V
Q
A
0.0111 ft3
/s
(/4)3(1
2/12) ft42 8.17 ft/s
Q (5 gal/min)
0.00223 ft3
/s
1 gal/min
0.0111 ft3
/s
1
2
Le
d
1.6 Red
1/4
for Red
107
Le/d 4.4 Red
1/6
354 Chapter 6 Viscous Flow in Ducts
whi29346_ch06_346-455.qxd 11/4/09 10:38 Page 354 Debd 208:MHDQ176:whi29346:0073529346:whi29346_pagefiles:](https://image.slidesharecdn.com/white09-220921151844-e1802c93/75/Seven-edition-in-fluid-mechanics-White-553-2048.jpg)


![subject to no slip at the walls and known inlet and exit conditions. (We shall save our
free-surface solutions for Chap. 10.)
We will not work with the differential energy relation, Eq. (4.53), in this chapter, but
it is very important, both for heat transfer calculations and for general understanding of
duct flow processes. There is work being done by pressure forces to drive the fluid
through the duct. Where does this energy go? There is no work done by the wall shear
stresses, because the velocity at the wall is zero. The answer is that pressure work is
balanced by viscous dissipation in the interior of the flow. The integral of the dissipa-
tion function , from Eq. (4.50), over the flow field will equal the pressure work. An
example of this fundamental viscous flow energy balance is given in Problem C6.7.
Both laminar and turbulent flows satisfy Eqs. (6.14). For laminar flow, where there
are no random fluctuations, we go right to the attack and solve them for a variety of
geometries [2, 3], leaving many more, of course, for the problems.
For turbulent flow, because of the fluctuations, every velocity and pressure term in
Eqs. (6.14) is a rapidly varying random function of time and space. At present our
mathematics cannot handle such instantaneous fluctuating variables. No single pair of
random functions V(x, y, z, t) and p(x, y, z, t) is known to be a solution to Eqs. (6.14).
Moreover, our attention as engineers is toward the average or mean values of veloc-
ity, pressure, shear stress, and the like in a high-Reynolds-number (turbulent) flow.
This approach led Osborne Reynolds in 1895 to rewrite Eqs. (6.14) in terms of mean
or time-averaged turbulent variables.
The time mean of a turbulent function u(x, y, z, t) is defined by
(6.15)
where T is an averaging period taken to be longer than any significant period of the
fluctuations themselves. The mean values of turbulent velocity and pressure are illus-
trated in Fig. 6.8. For turbulent gas and water flows, an averaging period T 5 s is
usually quite adequate.
u
1
T
T
0
u dt
u
Reynolds’ Time-Averaging
Concept
360 Chapter 6 Viscous Flow in Ducts
t
u
(a)
t
p
(b)
u′
u
u = u + u′
p′
p = p + p′
p
Fig. 6.8 Definition of mean and
fluctuating turbulent variables: (a)
velocity; (b) pressure.
whi29346_ch06_346-455.qxd 11/4/09 10:38 Page 360 Debd 208:MHDQ176:whi29346:0073529346:whi29346_pagefiles:](https://image.slidesharecdn.com/white09-220921151844-e1802c93/75/Seven-edition-in-fluid-mechanics-White-561-2048.jpg)


![Again, by dimensional analysis we rewrite this as
(6.27)
where u* has the same meaning as in Eq. (6.25). Equation (6.27) is called the velocity-
defect law for the outer layer.
Both the wall law (6.25) and the defect law (6.27) are found to be accurate for a
wide variety of experimental turbulent duct and boundary layer flows [1 to 3]. They
are different in form, yet they must overlap smoothly in the intermediate layer. In
1937 C. B. Millikan showed that this can be true only if the overlap layer velocity
varies logarithmically with y:
(6.28)
Over the full range of turbulent smooth wall flows, the dimensionless constants](https://image.slidesharecdn.com/white09-220921151844-e1802c93/75/Seven-edition-in-fluid-mechanics-White-564-2048.jpg)


![is exactly the case. The four outer-law profiles shown all merge smoothly with
the logarithmic overlap law but have different magnitudes because they vary in
external pressure gradient. The wall law is unique and follows the linear viscous
relation
(6.29)
from the wall to about y
5, thereafter curving over to merge with the logarithmic
law at about y
30.
Believe it or not, Fig. 6.10, which is nothing more than a shrewd correlation of
velocity profiles, is the basis for most existing “theory” of turbulent shear flows.
Notice that we have not solved any equations at all but have merely expressed the
streamwise velocity in a neat form.
There is serendipity in Fig. 6.10: The logarithmic law (6.28), instead of just
being a short overlapping link, actually approximates nearly the entire velocity
profile, except for the outer law when the pressure is increasing strongly down-
stream (as in a diffuser). The inner wall law typically extends over less than 2
percent of the profile and can be neglected. Thus we can use Eq. (6.28) as an
excellent approximation to solve nearly every turbulent flow problem presented
in this and the next chapter. Many additional applications are given in Refs. 2
and 3.
Turbulence modeling is a very active field. Scores of papers have been published to
more accurately simulate the turbulent stresses in Eq. (6.21) and their y and z com-
ponents. This research, now available in advanced texts [1, 13, 19], goes well beyond
the present book, which is confined to the use of the logarithmic law (6.28) for pipe
and boundary layer problems. For example, L. Prandtl, who invented boundary layer
theory in 1904, later proposed an eddy viscosity model of the Reynolds stress term in
Eq. (6.23):
(6.30)
The term t, which is a property of the flow, not the fluid, is called the eddy viscos-
ity and can be modeled in various ways. The most popular form is Eq. (6.30), where
l is called the mixing length of the turbulent eddies (analogous to mean free path in
molecular theory). Near a solid wall, l is approximately proportional to distance from
the wall, and Kármán suggested
(6.31)
As a homework assignment, Prob. P6.40, you may show that Eqs. (6.30) and (6.31)
lead to the logarithmic law (6.28) near a wall.
Modern turbulence models approximate three-dimensional turbulent flows and
employ additional partial differential equations for such quantities as the turbulence
kinetic energy, the turbulent dissipation, and the six Reynolds stresses. For details,
see Refs. 1, 13, and 19.
l](https://image.slidesharecdn.com/white09-220921151844-e1802c93/75/Seven-edition-in-fluid-mechanics-White-568-2048.jpg)


![into Eq. (6.40), we obtain the alternative form
(6.41)
For a given flow rate Q, the turbulent pressure drop decreases with diameter even
more sharply than the laminar formula (6.12). Thus the quickest way to reduce
required pumping pressure is to increase the pipe size, although, of course, the larger
pipe is more expensive. Doubling the pipe size decreases p by a factor of about 27
for a given Q. Compare Eq. (6.40) with Example 5.7 and Fig. 5.10.
The maximum velocity in turbulent pipe flow is given by Eq. (6.32), evaluated at
r 0:
(6.42)
Combining this with Eq. (6.33), we obtain the formula relating mean velocity to max-
imum velocity:
(6.43)
Some numerical values are
Red 4000 104
105
106
107
108
V/umax 0.794 0.814 0.852 0.877 0.895 0.909
The ratio varies with the Reynolds number and is much larger than the value of 0.5
predicted for all laminar pipe flow in Eq. (6.12). Thus a turbulent velocity profile, as
shown in Fig. 6.11b, is very flat in the center and drops off sharply to zero at the wall.
It was not known until experiments in 1800 by Coulomb [6] that surface roughness
has an effect on friction resistance. It turns out that the effect is negligible for lami-
nar pipe flow, and all the laminar formulas derived in this section are valid for rough
Effect of Rough Walls
V
umax
(1 1.31f) 1
umax
u*
1](https://image.slidesharecdn.com/white09-220921151844-e1802c93/75/Seven-edition-in-fluid-mechanics-White-573-2048.jpg)

![walls also. But turbulent flow is strongly affected by roughness. In Fig. 6.10 the lin-
ear viscous sublayer extends out only to y
yu*/ 5. Thus, compared with the
diameter, the sublayer thickness ys is only
(6.44)
For example, at Red 105
, f 0.0180, and ys /d 0.001, a wall roughness of
about 0.001d will break up the sublayer and profoundly change the wall law in
Fig. 6.10.
Measurements of u(y) in turbulent rough-wall flow by Prandtl’s student Nikuradse
[7] show, as in Fig. 6.12a, that a roughness height
will force the logarithm law pro-
file outward on the abscissa by an amount approximately equal to ln
, where
u*/. The slope of the logarithm law remains the same, 1/](https://image.slidesharecdn.com/white09-220921151844-e1802c93/75/Seven-edition-in-fluid-mechanics-White-575-2048.jpg)
![, but the shift outward
causes the constant B to be less by an amount B (1/) ln
.
Nikuradse [7] simulated roughness by gluing uniform sand grains onto the inner
walls of the pipes. He then measured the pressure drops and flow rates and correlated
friction factor versus Reynolds number in Fig. 6.12b. We see that laminar friction is
unaffected, but turbulent friction, after an onset point, increases monotonically with
the roughness ratio
/d. For any given
/d, the friction factor becomes constant (fully
ys
d
5/u*
d
14.1
Redf1/2
368 Chapter 6 Viscous Flow in Ducts
0.08
0.06
0.04
0.02
0.01
0.10
103
Red
f
Eq. (6.39a)
Eq. (6.38)
= 0.0333
0.0163
0.00833
0.00397
0.00198
0.00099
(b)
Rough
Smooth
≈1n ∋
∋
+
ΔB
log
yu*
v
(a)
u
u*
104
105
106
Red
64
d
Fig. 6.12 Effect of wall roughness on turbulent pipe flow. (a) The logarithmic overlap
velocity profile shifts down and to the right; (b) experiments with sand-grain roughness by
Nikuradse [7] show a systematic increase of the turbulent friction factor with the roughness
ratio.
whi29346_ch06_346-455.qxd 11/4/09 10:39 Page 368 Debd 208:MHDQ176:whi29346:0073529346:whi29346_pagefiles:](https://image.slidesharecdn.com/white09-220921151844-e1802c93/75/Seven-edition-in-fluid-mechanics-White-576-2048.jpg)
![rough) at high Reynolds numbers. These points of change are certain values of
u*/:
hydraulically smooth walls, no effect of roughness on friction
transitional roughness, moderate Reynolds number effect
For fully rough flow,
70, the log law downshift B in Fig. 6.12a is
(6.45)
and the logarithm law modified for roughness becomes
(6.46)
The viscosity vanishes, and hence fully rough flow is independent of the Reynolds
number. If we integrate Eq. (6.46) to obtain the average velocity in the pipe, we obtain
or fully rough flow (6.47)
There is no Reynolds number effect; hence the head loss varies exactly as the square
of the velocity in this case. Some numerical values of friction factor may be listed:
/d 0.00001 0.0001 0.001 0.01 0.05
f 0.00806 0.0120 0.0196 0.0379 0.0716
The friction factor increases by 9 times as the roughness increases by a factor of
5000. In the transitional roughness region, sand grains behave somewhat differ-
ently from commercially rough pipes, so Fig. 6.12b has now been replaced by the
Moody chart.
In 1939 to cover the transitionally rough range, Colebrook [9] combined the smooth
wall [Eq. (6.38)] and fully rough [Eq. (6.47)] relations into a clever interpolation
formula:
(6.48)
This is the accepted design formula for turbulent friction. It was plotted in 1944 by
Moody [8] into what is now called the Moody chart for pipe friction (Fig. 6.13). The
1
f1/2 2.0 loga
/d
3.7
2.51
Red f1/2b
The Moody Chart
1
f1/2 2.0 log
/d
3.7
V
u*
2.44 ln
d
3.2
u
1](https://image.slidesharecdn.com/white09-220921151844-e1802c93/75/Seven-edition-in-fluid-mechanics-White-577-2048.jpg)


![Moody chart is probably the most famous and useful figure in fluid mechanics. It
is accurate to 15 percent for design calculations over the full range shown in
Fig. 6.13. It can be used for circular and noncircular (Sec. 6.6) pipe flows and for
open-channel flows (Chap. 10). The data can even be adapted as an approximation to
boundary layer flows (Chap. 7).
Equation (6.48) is cumbersome to evaluate for f if Red is known, although it easily
yields to the EES Equation Solver. An alternative explicit formula given by Haaland
[33] as
(6.49)
varies less than 2 percent from Eq. (6.48).
1
f1/2 1.8 log c
6.9
Red
a
/d
3.7
b
1.11
d
370 Chapter 6 Viscous Flow in Ducts
Values of (Vd) for water at 60°F (velocity, ft/s × diameter, in)
0.10
0.09
0.08
0.07
0.06
0.05
0.04
0.03
0.025
0.02
0.01
0.009
0.008
Friction
factor
f
=
h
L
d
V
2
2g
0.015
0.05
0.04
0.03
0.02
0.008
0.006
0.004
0.002
0.001
0.0008
0.0006
0.0004
0.0002
0.0001
0.000,05
0.000,01
Relative
roughness
ε
d
0.015
0.01
103
2(103
) 3 4 5 6 8
104
8000
2 4 6 8 10 20 40 60 100 200 400 600 800 1000 2000 4000 6000 10,000 20,000 40,000 60,000 100,000
Values of (Vd) for atmospheric air at 60°F
80,000
0.1 0.2 0.4 0.6 0.8 1 2 4 6 8 10 20 40 80 100 200 400 600 800 1000
60 2000 4000 6000
8000
10,000
2(104
) 3 4 5 6 8
105
2(105
) 3 4 5 6 8
106
2(106
) 3 4 5 6 8
107
2(107
) 3 4 5 6 8
108
ε
d
= 0.000,001
ε
d
= 0.000,005
Reynolds number Re =
Vd
ν
Complete turbulence, rough pipes
Transition
zone
Critical
zone
L
a
m
i
n
a
r
f
l
o
w
f
=
6
4
R
e
Smooth pipes
Recr
Laminar
flow
(
(
Fig. 6.13 The Moody chart for pipe friction with smooth and rough walls. This chart is identical to Eq. (6.48) for turbulent flow.
(From Ref. 8, by permission of the ASME.)
whi29346_ch06_346-455.qxd 11/4/09 10:39 Page 370 Debd 208:MHDQ176:whi29346:0073529346:whi29346_pagefiles:](https://image.slidesharecdn.com/white09-220921151844-e1802c93/75/Seven-edition-in-fluid-mechanics-White-581-2048.jpg)
![The shaded area in the Moody chart indicates the range where transition from lam-
inar to turbulent flow occurs. There are no reliable friction factors in this range, 2000
Red, 4000. Notice that the roughness curves are nearly horizontal in the fully
rough regime to the right of the dashed line.
From tests with commercial pipes, recommended values for average pipe rough-
ness are listed in Table 6.1.
EXAMPLE 6.62
Compute the loss of head and pressure drop in 200 ft of horizontal 6-in-diameter asphalted
cast iron pipe carrying water with a mean velocity of 6 ft/s.
Solution
• System sketch: See Fig. 6.7 for a horizontal pipe, with z 0 and hf proportional to p.
• Assumptions: Turbulent flow, asphalted horizontal cast iron pipe, d 0.5 ft, L 200 ft.
• Approach: Find Red and
/d; enter the Moody chart, Fig. 6.13; find f, then hf and p.
• Property values: From Table A.3 for water, converting to BG units, 998/515.38
1.94 slug/ft3
, 0.001/47.88 2.09E-5 slug/(ft-s).
• Solution step 1: Calculate Red and the roughness ratio. As a crutch, Moody provided
water and air values of “Vd” at the top of Fig. 6.13 to find Red. No, let’s calculate it
ourselves:
Red
Vd
(1.94 slug/ft3
)(6 ft/s)(0.5 ft)
2.09E-5 slug/(ft s)
279,000 (turbulent)
6.6 Turbulent Pipe Flow 371
Table 6.1 Recommended
Roughness Values for Commercial
Ducts
Material Condition ft mm Uncertainty, %
Steel Sheet metal, new 0.00016 0.05 60
Stainless, new 0.000007 0.002 50
Commercial, new 0.00015 0.046 30
Riveted 0.01 3.0 70
Rusted 0.007 2.0 50
Iron Cast, new 0.00085 0.26 50
Wrought, new 0.00015 0.046 20
Galvanized, new 0.0005 0.15 40
Asphalted cast 0.0004 0.12 50
Brass Drawn, new 0.000007 0.002 50
Plastic Drawn tubing 0.000005 0.0015 60
Glass — Smooth Smooth
Concrete Smoothed 0.00013 0.04 60
Rough 0.007 2.0 50
Rubber Smoothed 0.000033 0.01 60
Wood Stave 0.0016 0.5 40
2
This example was given by Moody in his 1944 paper [8].
whi29346_ch06_346-455.qxd 11/4/09 10:39 Page 371 Debd 208:MHDQ176:whi29346:0073529346:whi29346_pagefiles:](https://image.slidesharecdn.com/white09-220921151844-e1802c93/75/Seven-edition-in-fluid-mechanics-White-582-2048.jpg)
![From Table 6.1, for asphalted cast iron,
0.0004 ft. Then calculate
• Solution step 2: Find the friction factor from the Moody chart or from Eq. (6.48). If
you use the Moody chart, Fig. 6.13, you need practice. Find the line on the right side for
/d 0.0008 and follow it back to the left until it hits the vertical line for Red 2.79E5.
Read, approximately, f 0.02 [or compute f 0.0198 from Eq. (6.48), perhaps using
EES].
• Solution step 3: Calculate hf from Eq. (6.10) and p from Eq. (6.8) for a horizontal
pipe:
Ans.
Ans.
• Comments: In giving this example, Moody [8] stated that this estimate, even for clean
new pipe, can be considered accurate only to about 10 percent.
EXAMPLE 6.7
Oil, with 900 kg/m3
and 0.00001 m2
/s, flows at 0.2 m3
/s through 500 m of 200-mm-
diameter cast iron pipe. Determine (a) the head loss and (b) the pressure drop if the pipe
slopes down at 10° in the flow direction.
Solution
First compute the velocity from the known flow rate:
Then the Reynolds number is
From Table 6.1,
0.26 mm for cast iron pipe. Then
Enter the Moody chart on the right at
/d 0.0013 (you will have to interpolate), and move
to the left to intersect with Re 128,000. Read f 0.0225 [from Eq. (6.48) for these val-
ues we could compute f 0.0227]. Then the head loss is
Ans. (a)
hf f
L
d
V2
2g
(0.0225)
500 m
0.2 m
(6.4 m/s)2
2(9.81 m/s2
)
117 m
d
0.26 mm
200 mm
0.0013
Red
Vd
v
(6.4 m/s)(0.2 m)
0.00001 m2
/s
128,000
V
Q
R2
0.2 m3
/s
(0.1 m)2 6.4 m/s
p ghf (1.94 slug/ft3
)(32.2 ft/s2
)(4.5 ft) 280 lbf/ft2
hf f
L
d
V2
2g
(0.02)a
200 ft
0.5 ft
b
(6 ft/s)2
2(32.2 ft/s2
)
4.5 ft
/d (0.0004 ft)/(0.5 ft) 0.0008
372 Chapter 6 Viscous Flow in Ducts
whi29346_ch06_346-455.qxd 11/4/09 10:39 Page 372 Debd 208:MHDQ176:whi29346:0073529346:whi29346_pagefiles:](https://image.slidesharecdn.com/white09-220921151844-e1802c93/75/Seven-edition-in-fluid-mechanics-White-583-2048.jpg)
![From Eq. (6.9) for the inclined pipe,
or
Ans. (b)
EXAMPLE 6.8
Repeat Example 6.4 to see whether there is any possible turbulent flow solution for a
smooth-walled pipe.
Solution
In Example 6.4 we estimated a head loss hf 1.66 ft, assuming laminar exit flow ( 2.0).
For this condition the friction factor is
For laminar flow, Red 64/f 64/0.0388 1650, as we showed in Example 6.4. However,
from the Moody chart (Fig. 6.13), we see that f 0.0388 also corresponds to a turbulent
smooth-wall condition, at Red 4500. If the flow actually were turbulent, we should change
our kinetic energy factor to 1.06 [Eq. (3.77)], whence the corrected hf 1.82 ft and
f 0.0425. With f known, we can estimate the Reynolds number from our formulas:
So the flow might have been turbulent, in which case the viscosity of the fluid would have been
Ans.
This is about 55 percent less than our laminar estimate in Example 6.4. The moral is to keep
the capillary-flow Reynolds number below about 1000 to avoid such duplicate solutions.
The Moody chart (Fig. 6.13) can be used to solve almost any problem involving fric-
tion losses in long pipe flows. However, many such problems involve considerable
iteration and repeated calculations using the chart because the standard Moody chart
is essentially a head loss chart. One is supposed to know all other variables, com-
pute Red, enter the chart, find f, and hence compute hf. This is one of four funda-
mental problems which are commonly encountered in pipe flow calculations:
1. Given d, L, and V or Q, , , and g, compute the head loss hf (head loss problem).
2. Given d, L, hf, , , and g, compute the velocity V or flow rate Q (flow rate
problem).
3. Given Q, L, hf, , , and g, compute the diameter d of the pipe (sizing problem).
4. Given Q, d, hf, , , and g, compute the pipe length L.
6.7 Four Types of Pipe Flow
Problems
Vd
Red
1.80(3.32)(0.004)
3300
7.2 10 6
slug/(ft # s)
Red 3250 3Eq. (6.38)4 or Red 3400 3Eq. (6.39b)4
f hf
d
L
2g
V2 (1.66 ft)
(0.004 ft)(2)(32.2 ft/s2
)
(1.0 ft)(3.32 ft/s)2 0.0388
(900 kg/m3
)(9.81 m/s2
)(30 m) 265,000 kg/(m # s2
) 265,000 Pa
p g3hf (500 m) sin 104 g(117 m 87 m)
hf
p
g
z1 z2
p
g
L sin 10
6.7 Four Types of Pipe Flow Problems 373
whi29346_ch06_346-455.qxd 11/4/09 10:39 Page 373 Debd 208:MHDQ176:whi29346:0073529346:whi29346_pagefiles:](https://image.slidesharecdn.com/white09-220921151844-e1802c93/75/Seven-edition-in-fluid-mechanics-White-584-2048.jpg)
![Problems 1 and 4 are well suited to the Moody chart. We have to iterate to compute
velocity or diameter because both d and V are contained in the ordinate and the
abscissa of the chart.
There are two alternatives to iteration for problems of type 2 and 3: (a) prepara-
tion of a suitable new Moody-type chart (see Probs. P6.68 and P6.73); or (b) the use
of solver software, especially the Engineering Equation Solver, known as EES [47],
which gives the answer directly if the proper data are entered. Examples 6.9 and 6.11
include the EES approach to these problems.
Even though velocity (or flow rate) appears in both the ordinate and the abscissa on
the Moody chart, iteration for turbulent flow is nevertheless quite fast because f varies
so slowly with Red. Alternately, in the spirit of Example 5.7, we could change the
scaling variables to (, , d) and thus arrive at dimensionless head loss versus dimen-
sionless velocity. The result is3
(6.50)
Example 5.7 did this and offered the simple correlation 0.155 , which is
valid for turbulent flow with smooth walls and Red
1 E5.
A formula valid for all turbulent pipe flows is found by simply rewriting the Cole-
brook interpolation, Eq. (6.48), in the form of Eq. (6.50):
(6.51)
Given , we compute Red (and hence velocity) directly. Let us illustrate these two
approaches with the following example.
EXAMPLE 6.9
Oil, with 950 kg/m3
and 2 E-5 m2
/s, flows through a 30-cm-diameter pipe 100 m
long with a head loss of 8 m. The roughness ratio is
/d 0.0002. Find the average veloc-
ity and flow rate.
Direct Solution
First calculate the dimensionless head loss parameter:
Now enter Eq. (6.51) to find the Reynolds number:
Red 38(5.3 E7)41/2
log a
0.0002
3.7
1.775
15.3 E7
b 72,600
gd3
hf
Lv2
(9.81 m/s2
)(0.3 m)3
(8.0 m)
(100 m)(2 E-5 m2
/s)2 5.30 E7
Red (8)1/2
log a
/d
3.7
1.775
1
b
gd3
hf
Lv2
Red
1.75
fcn(Red) where
gd3
hf
Lv2
f Re2
d
2
Type 2 Problem:
Find the Flow Rate
374 Chapter 6 Viscous Flow in Ducts
3
The parameter was suggested by H. Rouse in 1942.
whi29346_ch06_346-455.qxd 11/4/09 10:39 Page 374 Debd 208:MHDQ176:whi29346:0073529346:whi29346_pagefiles:](https://image.slidesharecdn.com/white09-220921151844-e1802c93/75/Seven-edition-in-fluid-mechanics-White-585-2048.jpg)
![The velocity and flow rate follow from the Reynolds number:
Ans.
No iteration is required, but this idea falters if additional losses are present. Note that we
never bothered to compute the friction factor.
Iterative Solution
By definition, the friction factor is known except for V:
(SI units)
To get started, we only need to guess f, compute , then get Red, compute a
better f from the Moody chart, and repeat. The process converges fairly rapidly. A good first
guess is the “fully rough” value for
/d 0.0002, or f 0.014 from Fig. 6.13. The itera-
tion would be as follows:
Guess f 0.014, then m/s and Red Vd/ 87,000. At
Red 87,000 and
/d 0.0002, compute fnew 0.0195 [Eq. (6.48)].
New f 0.0195, m/s and Red Vd/ 73,700. At Red
73,700 and
/d 0.0002, compute fnew 0.0201 [Eq. (6.48)].
Better f 0.0201, m/s and Red 72,600. At Red
72,600 and
/d 0.0002, compute fnew 0.0201 [Eq. (6.48)].
We have converged to three significant figures. Thus our iterative solution is
Ans.
The iterative approach is straightforward and not too onerous, so it is routinely used by
engineers. Obviously this repetitive procedure is ideal for a personal computer.
Engineering Equation Solver (EES) Solution
In EES, one simply enters the data and the appropriate equations, letting the software do the
rest. Correct units must of course be used. For the present example, the data could be entered
as SI:
rho950 nu2E-5 d0.3 L100 epsod0.0002 hf8.0 g9.81
The appropriate equations are the Moody formula (6.48) plus the definitions of Reynolds num-
ber, volume flow rate as determined from velocity, and the Darcy head loss formula (6.10):
ReV*d/nu
QV*pi*d^2/4
f( 2.0*log10(epsod/3.72.51/Re/f^0.5))^( 2)
hff*L/d*V^2/2/g
Q Va
4
bd2
(4.84)a
4
b(0.3)2
0.342 m3
/s
V 4.84 m/s
V 10.471/0.0201 4.84
V 10.471/0.0195 4.91
V 10.471/0.014 5.80
V 10.471/f
f hf
d
L
2g
V2 (8 m)a
0.3 m
100 m
bc
2(9.81 m/s2
V2 d or f V2
0.471
Q V
4
d2
a4.84
m
s
b
4
(0.3 m)2
0.342 m3
/s
V
Red
d
(2 E-5 m2
/s)(72,600)
0.3 m
4.84 m/s
6.7 Four Types of Pipe Flow Problems 375
EES
whi29346_ch06_346-455.qxd 11/4/09 10:39 Page 375 Debd 208:MHDQ176:whi29346:0073529346:whi29346_pagefiles:](https://image.slidesharecdn.com/white09-220921151844-e1802c93/75/Seven-edition-in-fluid-mechanics-White-586-2048.jpg)
![EES understands that “pi” represents 3.141593. Then hit “SOLVE” from the menu. If errors
have been entered, EES will complain that the system cannot be solved and attempt to
explain why. Otherwise, the software will iterate, and in this case EES prints the correct
solution:
Q0.342 V4.84 f0.0201 Re72585
The units are spelled out in a separate list as [m, kg, s, N]. This elegant approach to engi-
neering problem solving has one drawback—namely, that the user fails to check the solu-
tion for engineering viability. For example, are the data typed correctly? Is the Reynolds
number turbulent?
The Moody chart is especially awkward for finding the pipe size, since d occurs in
all three parameters f, Red, and
/d. Further, it depends on whether we know the veloc-
ity or the flow rate. We cannot know both, or else we could immediately compute
.
Let us assume that we know the flow rate Q. Note that this requires us to redefine
the Reynolds number in terms of Q:
(6.52)
Then, if we choose (Q, , ) as scaling parameters (to eliminate d), we obtain the
functional relationship
and can thus solve d when the right-hand side is known. Unfortunately, the writer
knows of no formula for this relation. Here it seems reasonable to forgo a plot or
curve fitted formula and to simply set up the problem as an iteration in terms of the
Moody chart variables. In this case we also have to set up the friction factor in terms
of the flow rate:
(6.53)
The following two examples illustrate the iteration.
EXAMPLE 6.10
Work Example 6.9 backward, assuming that Q 0.342 m3
/s and
0.06 mm are known
but that d (30 cm) is unknown. Recall L 100 m, 950 kg/m3
, 2 E-5 m2
/s, and
hf 8 m.
Iterative Solution
First write the diameter in terms of the friction factor:
(1)
f
2
8
(9.81 m/s2
)(8 m)d5
(100 m)(0.342 m3
/s)2 8.28d5
or d 0.655f1/5
f hf
d
L
2g
V2
2
8
ghf d5
LQ2
Red
4Q
d
fcna
ghf Q3
L5 ,
Q
b
Red
Vd
4Q
d
d 14Q/(V)
Type 3 Problem: Find the Pipe
Diameter
376 Chapter 6 Viscous Flow in Ducts
whi29346_ch06_346-455.qxd 11/4/09 10:39 Page 376 Debd 208:MHDQ176:whi29346:0073529346:whi29346_pagefiles:](https://image.slidesharecdn.com/white09-220921151844-e1802c93/75/Seven-edition-in-fluid-mechanics-White-587-2048.jpg)


![Jones [10] shows that the effective-laminar-diameter idea collapses all data for rec-
tangular ducts of arbitrary height-to-width ratio onto the Moody chart for pipe flow.
We recommend this idea for all noncircular ducts.
EXAMPLE 6.13
Fluid flows at an average velocity of 6 ft/s between horizontal parallel plates a distance of
2.4 in apart. Find the head loss and pressure drop for each 100 ft of length for 1.9
slugs/ft3
and (a) 0.00002 ft2
/s and (b) 0.002 ft2
/s. Assume smooth walls.
Solution
The viscosity 3.8 10 5
slug/(ft s). The spacing is 2h 2.4 in 0.2 ft, and
Dh 4h 0.4 ft. The Reynolds number is
The flow is therefore turbulent. For reasonable accuracy, simply look on the Moody chart
(Fig. 6.13) for smooth walls:
Ans. (a)
Since there is no change in elevation,
Ans. (a)
This is the head loss and pressure drop per 100 ft of channel. For more accuracy, take
Deff Dh from laminar theory; then
and from the Moody chart read f 0.0189 for smooth walls. Thus a better estimate is
and Better ans. (a)
The more accurate formula predicts friction about 9 percent higher.
Compute 0.0038 slug/(ft s). The Reynolds number is 6.0(0.4)/0.002 1200;
therefore the flow is laminar, since Re is less than 2300.
You could use the laminar flow friction factor, Eq. (6.64)
from which
and Ans. (b)
p 1.9(32.2)(11.2) 684 lbf/ft2
hf 0.08
100
0.4
(6.0)2
2(32.2)
11.2 ft
flam
96
ReDh
96
1200
0.08
Part (b)
p 1.9(32.2)(2.64) 161 lbf/ft2
hf 0.0189
100
0.4
(6.0)2
2(32.2)
2.64 ft
Reeff 64
96(120,000) 80,000
64
96
p ghf 1.9(32.2)(2.42) 148 lbf/ft2
f 0.0173 hf f
L
Dh
V2
2g
0.0173
100
0.4
(6.0)2
2(32.2)
2.42 ft
ReDh
VDh
(6.0 ft/s)(0.4 ft)
0.00002 ft2
/s
120,000
Part (a)
6.8 Flow in Noncircular Ducts 383
whi29346_ch06_346-455.qxd 11/4/09 10:40 Page 383 Debd 208:MHDQ176:whi29346:0073529346:whi29346_pagefiles:](https://image.slidesharecdn.com/white09-220921151844-e1802c93/75/Seven-edition-in-fluid-mechanics-White-597-2048.jpg)

![The final solution for the velocity profile is
(6.72)
The volume flow is given by
(6.73)
The velocity profile u(r) resembles a parabola wrapped around in a circle to form a
split doughnut, as in Fig. 6.15.
It is confusing to base the friction factor on the wall shear because there are two
shear stresses, the inner stress being greater than the outer. It is better to define f with
respect to the head loss, as in Eq. (6.58),
(6.74)
The hydraulic diameter for an annulus is
(6.75)
It is twice the clearance, rather like the parallel-plate result of twice the distance
between plates [Eq. (6.62)].
Substituting hf, Dh, and V into Eq. (6.74), we find that the friction factor for lam-
inar flow in a concentric annulus is of the form
(6.76)
The dimensionless term is a sort of correction factor for the hydraulic diameter. We
could rewrite Eq. (6.76) as
Concentric annulus: (6.77)
Some numerical values of f and Deff/Dh 1/ are given in Table 6.3. Again,
laminar annular flow becomes unstable at 2000.
For turbulent flow through a concentric annulus, the analysis might proceed by
patching together two logarithmic law profiles, one going out from the inner wall to
meet the other coming in from the outer wall. We omit such a scheme here and pro-
ceed directly to the friction factor. According to the general rule proposed in Eq. (6.61),
turbulent friction is predicted with excellent accuracy by replacing d in the Moody
chart by Deff 2(a b)/, with values listed in Table 6.3.5
This idea includes rough-
ness also (replace
/d in the chart by
/Deff). For a quick design number with about
10 percent accuracy, one can simply use the hydraulic diameter Dh 2(a b).
ReDh
ReDh
f
64
Reeff
Reeff
1
ReDh
f
64
ReDh
(a b)2
(a2
b2
)
a4
b4
(a2
b2
)2
/ln (a/b)
Dh
4(a2
b2
)
2(a b)
2(a b)
f hf
Dh
L
2g
V2 where V
Q
(a2
b2
)
Q
a
b
u 2r dr
8
c
d
dx
(p gz)d c a4
b4
(a2
b2
)2
ln (a/b)
d
u
1
4
c
d
dx
(p gz) d c a2
r2
a2
b2
ln (b/a)
ln
a
r
d
6.8 Flow in Noncircular Ducts 385
5
Jones and Leung [44] show that data for annular flow also satisfy the effective-laminar-diameter idea.
Table 6.3 Laminar Friction Factors
for a Concentric Annulus
b/a f Deff /Dh 1/
0.0 64.0 1.000
0.00001 70.09 0.913
0.0001 71.78 0.892
0.001 74.68 0.857
0.01 80.11 0.799
0.05 86.27 0.742
0.1 89.37 0.716
0.2 92.35 0.693
0.4 94.71 0.676
0.6 95.59 0.670
0.8 95.92 0.667
1.0 96.0 0.667
ReDh
whi29346_ch06_346-455.qxd 11/4/09 10:40 Page 385 Debd 208:MHDQ176:whi29346:0073529346:whi29346_pagefiles:](https://image.slidesharecdn.com/white09-220921151844-e1802c93/75/Seven-edition-in-fluid-mechanics-White-599-2048.jpg)

![feff 0.0257. Using the latter estimate, we find the required reservoir level from Eq. (1):
Ans.
• Comments: Note that we do not replace Dh by Deff in the head loss term fL/Dh, which
comes from a momentum balance and requires hydraulic diameter. If we used the sim-
pler friction estimate, f 0.0232, we would obtain h 3.72 m, or about 9 percent lower.
In principle, any duct cross section can be solved analytically for the laminar flow
velocity distribution, volume flow, and friction factor. This is because any cross sec-
tion can be mapped onto a circle by the methods of complex variables, and other pow-
erful analytical techniques are also available. Many examples are given by White
[3, pp. 112–115], Berker [11], and Olson and Wright [12, pp. 315–317]. Reference
34 is devoted entirely to laminar duct flow.
In general, however, most unusual duct sections have strictly academic and not
commercial value. We list here only the rectangular and isosceles-triangular sections,
in Table 6.4, leaving other cross sections for you to find in the references.
For turbulent flow in a duct of unusual cross section, one should replace d by Dh on
the Moody chart if no laminar theory is available. If laminar results are known, such
as Table 6.4, replace d by Deff [64/(f Re)]Dh for the particular geometry of the duct.
For laminar flow in rectangles and triangles, the wall friction varies greatly, being
largest near the midpoints of the sides and zero in the corners. In turbulent flow
through the same sections, the shear is nearly constant along the sides, dropping off
sharply to zero in the corners. This is because of the phenomenon of turbulent
secondary flow, in which there are nonzero mean velocities v and w in the plane of
the cross section. Some measurements of axial velocity and secondary flow patterns
are shown in Fig. 6.16, as sketched by Nikuradse in his 1926 dissertation. The
Other Noncircular Cross Sections
h
V2
2
2g
a2 feff
L
Dh
b
(1.99 m/s)2
2(9.81 m/s)2 c1.03 0.0257
30 m
0.04 m
d 4.1 m
6.8 Flow in Noncircular Ducts 387
Table 6.4 Laminar Friction
Constants f Re for Rectangular and
Triangular Ducts
Rectangular Isosceles triangle
b/a f , deg f
0.0 96.00 0 48.0
0.05 89.91 10 51.6
0.1 84.68 20 52.9
0.125 82.34 30 53.3
0.167 78.81 40 52.9
0.25 72.93 50 52.0
0.4 65.47 60 51.1
0.5 62.19 70 49.5
0.75 57.89 80 48.3
1.0 56.91 90 48.0
ReDh
ReDh
b
a
2
Midplane
(a) (b)
Fig. 6.16 Illustration of secondary
turbulent flow in noncircular ducts:
(a) axial mean velocity contours;
(b) secondary flow in-plane cellu-
lar motions. (After J. Nikuradse,
dissertation, Göttingen, 1926.)
whi29346_ch06_346-455.qxd 11/4/09 10:40 Page 387 Debd 208:MHDQ176:whi29346:0073529346:whi29346_pagefiles:](https://image.slidesharecdn.com/white09-220921151844-e1802c93/75/Seven-edition-in-fluid-mechanics-White-601-2048.jpg)
![secondary flow “cells” drive the mean flow toward the corners, so that the axial veloc-
ity contours are similar to the cross section and the wall shear is nearly constant. This
is why the hydraulic-diameter concept is so successful for turbulent flow. Laminar
flow in a straight noncircular duct has no secondary flow. An accurate theoretical
prediction of turbulent secondary flow has yet to be achieved, although numerical
models are often successful [36].
EXAMPLE 6.15
Air, with 0.00237 slug/ft3
and 0.000157 ft2
/s, is forced through a horizontal square
9-by 9-in duct 100 ft long at 25 ft3
/s. Find the pressure drop if 0.0003 ft.
Solution
Compute the mean velocity and hydraulic diameter:
From Table 6.4, for b/a 1.0, the effective diameter is
whence
From the Moody chart, read f 0.0177. Then the pressure drop is
or p 5.5 lbf/ft2
Ans.
Pressure drop in air ducts is usually small because of the low density.
For any pipe system, in addition to the Moody-type friction loss computed for the
length of pipe, there are additional so-called minor losses or local losses due to
1. Pipe entrance or exit.
2. Sudden expansion or contraction.
3. Bends, elbows, tees, and other fittings.
6.9 Minor or Local Losses
in Pipe Systems6
p ghf g af
L
Dh
V2
2g
b 0.00237(32.2)c0.0177
100
0.75
44.42
2(32.2)
d
Deff
0.0003
0.843
0.000356
Reeff
VDeff
44.4(0.843)
0.000157
239,000
Deff
64
56.91
Dh 0.843 ft
Dh
4A
4(81 in2
)
36 in
9 in 0.75 ft
V
25 ft3
/s
(0.75 ft)2 44.4 ft/s
388 Chapter 6 Viscous Flow in Ducts
6
This section may be omitted without loss of continuity.
whi29346_ch06_346-455.qxd 11/6/09 9:32PM Page 388 ntt G4 Mac OS 9.2:Desktop Folder:sanjay_6/11/9:](https://image.slidesharecdn.com/white09-220921151844-e1802c93/75/Seven-edition-in-fluid-mechanics-White-602-2048.jpg)
![4. Valves, open or partially closed.
5. Gradual expansions or contractions.
The losses may not be so minor; for example, a partially closed valve can cause a
greater pressure drop than a long pipe.
Since the flow pattern in fittings and valves is quite complex, the theory is very
weak. The losses are commonly measured experimentally and correlated with the pipe
flow parameters. The data, especially for valves, are somewhat dependent on the par-
ticular manufacturer’s design, so that the values listed here must be taken as average
design estimates [15, 16, 35, 43, 46].
The measured minor loss is usually given as a ratio of the head loss hm p/(g)
through the device to the velocity head V2
/(2g) of the associated piping system:
(6.78)
Although K is dimensionless, it often is not correlated in the literature with the
Reynolds number and roughness ratio but rather simply with the raw size of the pipe
in, say, inches. Almost all data are reported for turbulent flow conditions.
A single pipe system may have many minor losses. Since all are correlated with
V2
/(2g), they can be summed into a single total system loss if the pipe has constant
diameter:
(6.79)
Note, however, that we must sum the losses separately if the pipe size changes so that
V2
changes. The length L in Eq. (6.79) is the total length of the pipe axis.
There are many different valve designs in commercial use. Figure 6.17 shows five
typical designs: (a) the gate, which slides down across the section; (b) the globe,
which closes a hole in a special insert; (c) the angle, similar to a globe but with a
90° turn; (d) the swing-check valve, which allows only one-way flow; and (e) the
disk, which closes the section with a circular gate. The globe, with its tortuous flow
path, has the highest losses when fully open. Many excellent details about these and
other valves are given in the handbooks by Skousen [35] and Smith and Zappe [52].
Table 6.5 lists loss coefficients K for four types of valve, three angles of elbow fit-
ting, and two tee connections. Fittings may be connected by either internal screws or
flanges, hence the two listings. We see that K generally decreases with pipe size,
which is consistent with the higher Reynolds number and decreased roughness ratio
of large pipes. We stress that Table 6.5 represents losses averaged among various
manufacturers, so there is an uncertainty as high as 50 percent.
In addition, most of the data in Table 6.5 are relatively old [15, 16] and therefore
based on fittings manufactured in the 1950s. Modern forged and molded fittings may
yield somewhat different loss factors, often less than listed in Table 6.5. An exam-
ple, shown in Fig. 6.18a, gives recent data [48] for fairly short (bend-radius/elbow-
diameter 1.2) flanged 90° elbows. The elbow diameter was 1.69 in. Notice first
that K is plotted versus Reynolds number, rather than versus the raw (dimensional)
pipe diameters in Table 6.5, and therefore Fig. 6.18a has more generality. Then notice
htot hf ghm
V2
2g
a
fL
d
gKb
Loss coefficient K
hm
V2
/(2g)
p
1
2V2
6.9 Minor or Local Losses in Pipe Systems 389
whi29346_ch06_346-455.qxd 11/4/09 10:40 Page 389 Debd 208:MHDQ176:whi29346:0073529346:whi29346_pagefiles:](https://image.slidesharecdn.com/white09-220921151844-e1802c93/75/Seven-edition-in-fluid-mechanics-White-603-2048.jpg)
![that the K values of 0.23 0.05 are significantly less than the values for 90° elbows
in Table 6.5, indicating smoother walls and/or better design. One may conclude that
(1) Table 6.5 data are probably conservative and (2) loss factors are highly depend-
ent on actual design and manufacturing factors, with Table 6.5 serving only as a
rough guide.
The valve losses in Table 6.5 are for the fully open condition. Losses can be much
higher for a partially open valve. Figure 6.18b gives average losses for three valves
as a function of “percentage open,” as defined by the opening-distance ratio h/D (see
Fig. 6.17 for the geometries). Again we should warn of a possible uncertainty of 50
percent. Of all minor losses, valves, because of their complex geometry, are most sen-
sitive to manufacturers’ design details. For more accuracy, the particular design and
manufacturer should be consulted [35].
The butterfly valve of Fig. 6.19a is a stem-mounted disk that, when closed, seats
against an O-ring or compliant seal near the pipe surface. A single 90° turn opens the
valve completely, hence the design is ideal for controllable quick-opening and quick-
closing situations such as occur in fire protection and the electric power industry.
However, considerable dynamic torque is needed to close these valves, and losses are
high when the valves are nearly closed.
Figure 6.19b shows butterfly-valve loss coefficients as a function of the opening
angle for turbulent flow conditions ( 0 is closed). The losses are huge when the
opening is small, and K drops off nearly exponentially with the opening angle. There
390 Chapter 6 Viscous Flow in Ducts
h
D
(a)
(a)
D
D
h
(b)
D
D
(c)
D
(d)
(e)
h D
Fig. 6.17 Typical commercial valve
geometries: (a) gate valve;
(b) globe valve; (c) angle valve;
(d) swing-check valve; (e) disk-
type gate valve.
whi29346_ch06_346-455.qxd 11/4/09 10:40 Page 390 Debd 208:MHDQ176:whi29346:0073529346:whi29346_pagefiles:](https://image.slidesharecdn.com/white09-220921151844-e1802c93/75/Seven-edition-in-fluid-mechanics-White-604-2048.jpg)
![is a factor of 2 spread among the various manufacturers. Note that K in Fig. 6.19b
is, as usual, based on the average pipe velocity V Q/A, not on the increased veloc-
ity of the flow as it passes through the narrow valve passage.
A bend or curve in a pipe, as in Fig. 6.20, always induces a loss larger than the sim-
ple straight-pipe Moody friction loss, due to flow separation on the curved walls and a
swirling secondary flow arising from the centripetal acceleration. The smooth-wall loss
6.9 Minor or Local Losses in Pipe Systems 391
Table 6.5 Resistance Coefficients
K hm/[V2
/(2g)] for Open Valves,
Elbows, and Tees
Nominal diameter, in
Screwed Flanged
1 2 4 1 2 4 8 20
Valves (fully open):
Globe 14 8.2 6.9 5.7 13 8.5 6.0 5.8 5.5
Gate 0.30 0.24 0.16 0.11 0.80 0.35 0.16 0.07 0.03
Swing check 5.1 2.9 2.1 2.0 2.0 2.0 2.0 2.0 2.0
Angle 9.0 4.7 2.0 1.0 4.5 2.4 2.0 2.0 2.0
Elbows:
45° regular 0.39 0.32 0.30 0.29
45° long radius 0.21 0.20 0.19 0.16 0.14
90° regular 2.0 1.5 0.95 0.64 0.50 0.39 0.30 0.26 0.21
90° long radius 1.0 0.72 0.41 0.23 0.40 0.30 0.19 0.15 0.10
180° regular 2.0 1.5 0.95 0.64 0.41 0.35 0.30 0.25 0.20
180° long radius 0.40 0.30 0.21 0.15 0.10
Tees:
Line flow 0.90 0.90 0.90 0.90 0.24 0.19 0.14 0.10 0.07
Branch flow 2.4 1.8 1.4 1.1 1.0 0.80 0.64 0.58 0.41
1
2
0.05 0.1 0.2 0.3 0.5 1.0 2.0 3.0 4.0
Reynolds number (millions)
0.16
0.18
0.20
0.22
0.24
0.26
0.28
0.30
0.32
0.34
K
factor
10%
10%
Curve-fit correlation
K 1.49 Re 0.145
Legend
Plastic elbow
Metal elbow no. 1
Metal elbow no. 2
Fig. 6.18a Recent measured loss
coefficients for 90° elbows. These
values are less than those reported
in Table 6.5. (From Ref. 48, cour-
tesy of R. D. Coffield.)
whi29346_ch06_346-455.qxd 11/4/09 10:40 Page 391 Debd 208:MHDQ176:whi29346:0073529346:whi29346_pagefiles:](https://image.slidesharecdn.com/white09-220921151844-e1802c93/75/Seven-edition-in-fluid-mechanics-White-605-2048.jpg)
![coefficients K in Fig. 6.20, from the data of Ito [49], are for total loss, including Moody
friction effects. The separation and secondary flow losses decrease with R/d, while the
Moody losses increase because the bend length increases. The curves in Fig. 6.20 thus
show a minimum where the two effects cross. Ito [49] gives a curve-fit formula for the
90° bend in turbulent flow:
(6.80a)
The formula accounts for Reynolds number, which equals 200,000 in Fig. 6.20. Com-
prehensive reviews of curved-pipe flow, for both laminar and turbulent flow, are given
by Berger et al. [53] and for 90 bends by Spedding et al. [54].
As shown in Fig. 6.21, entrance losses are highly dependent on entrance geome-
try, but exit losses are not. Sharp edges or protrusions in the entrance cause large
zones of flow separation and large losses. A little rounding goes a long way, and a
90 bend: K 0.388 a
R
d
b
0.84
ReD
0.17
where 0.95 4.42a
R
d
b
1.96
1
392 Chapter 6 Viscous Flow in Ducts
20.00
18.00
16.00
14.00
12.00
10.00
8.00
6.00
4.00
2.00
0.00
0.25 0.30 0.40 0.50 0.60 0.70 0.75 0.80 0.90 1.00
Fractional opening h
D
K
Gate
Disk
Globe
(a)
1000.00
100.00
10.00
1.00
0.10
20 30 40 50 60 70 90
Valve opening angle, degrees
(b)
K
80
Fig. 6.18b Average loss
coefficients for partially open
valves (see sketches in Fig. 6.17).
Fig. 6.19 Performance of butterfly
valves: (a) typical geometry (Cour-
tesy of Tyco Engineered Products
and Services); (b) loss coefficients
for three different manufacturers.
whi29346_ch06_346-455.qxd 11/4/09 10:40 Page 392 Debd 208:MHDQ176:whi29346:0073529346:whi29346_pagefiles:](https://image.slidesharecdn.com/white09-220921151844-e1802c93/75/Seven-edition-in-fluid-mechanics-White-606-2048.jpg)
![6.9 Minor or Local Losses in Pipe Systems 393
Secondary
flow pattern:
d = constant
0.8
0.6
0.2
K
0
1.0
0 10
5 15
R
d
R 0.4
=
1
8
0
°
= 90°
= 45°
Fig. 6.20 Resistance coefficients
for smooth-walled 45°, 90°, and
180° bends, at Red 200,000,
after Ito [49].
(b)
0.6
0.4
0.2
0
0 0.10 0.15 0.20
r
d
L
θ
K
Sharp-edged
V
10°
50°
30°
r
d
L
d
r
d
,
L
d
θ =
0 0.1 0.2 0.3 0.4
(a)
K 0.02
1.0
0.5
V
t
l
t
d
= 0
l
d
Fig. 6.21 Entrance and exit loss
coefficients: (a) reentrant inlets;
(b) rounded and beveled inlets. Exit
losses are K 1.0 for all shapes
of exit (reentrant, sharp, beveled,
or rounded). (From Ref. 37.)
whi29346_ch06_346-455.qxd 11/10/09 5:17PM Page 393 ntt 208:MHDQ176:whi29346:0073529346:whi29346_pagefiles:](https://image.slidesharecdn.com/white09-220921151844-e1802c93/75/Seven-edition-in-fluid-mechanics-White-607-2048.jpg)

![6.9 Minor or Local Losses in Pipe Systems 395
Fig. 6.23 Flow losses in a gradual
conical expansion region, as calcu-
lated from Gibson’s suggestion
[15, 50], Eq. (6.82), for a smooth
wall.
50
40
30
20
10
0.9
1.0
0.8
0.7
0.6 0.6
0.5
0.5
0.4
0.4
0.3
0.3
0.2
0.2
0.1
d1/d2 0.1
0.0
0
Data:
K
d1/d2 0.33
0.50 [16]
Total cone angle 2, degrees
2θ
V1 d1 d2 V2
As flow enters a gradual expansion or diffuser, such as the conical geometry of
Fig. 6.23, the velocity drops and the pressure rises. Head loss can be large, due to
flow separation on the walls, if the cone angle is too great. A thinner entrance
boundary layer, as in Fig. 6.6, causes a slightly smaller loss than a fully developed
inlet flow. The flow loss is a combination of nonideal pressure recovery plus wall
friction. Some correlating curves are shown in Fig. 6.23. The loss coefficient K is
based on the velocity head in the inlet (small) pipe and depends upon cone angle
2 and the diffuser diameter ratio d1/d2. There is scatter in the reported data [15,
16]. The curves in Fig. 6.23 are based on a correlation by A. H. Gibson [50], cited
in Ref. 15:
(6.82)
For large angles, 2 45, drop the coefficient (2.61 sin), which leaves us with
a loss equivalent to the sudden expansion of Eq. (6.80). As seen, the formula is
in reasonable agreement with the data from Ref.16. The minimum loss lies in the
region 5 2 15, which is the best geometry for an efficient diffuser. For
angles less than 5, the diffuser is too long and has too much friction. Angles
greater than 15 cause flow separation, resulting in poor pressure recovery. Pro-
fessor Gordon Holloway provided the writer a recent example, where an improved
diffuser design reduced the power requirement of a wind tunnel by 40 percent
(100 hp decrease!). We shall look again at diffusers in Sec. 6.11, using the data
of Ref. 14.
Kdiffuser
hm
V2
1(2 g)
2.61 sin a1
d2
D2b
2
favg
L
davg
for 2
45
Gradual Expansion—The Diffuser
whi29346_ch06_346-455.qxd 11/4/09 10:40 Page 395 Debd 208:MHDQ176:whi29346:0073529346:whi29346_pagefiles:](https://image.slidesharecdn.com/white09-220921151844-e1802c93/75/Seven-edition-in-fluid-mechanics-White-609-2048.jpg)
![For a gradual contraction, the loss is very small, as seen from the following exper-
imental values [15]:
Contraction cone angle 2, deg 30 45 60
K for gradual contraction 0.02 0.04 0.07
References 15, 16, 43, and 46 contain additional data on minor losses.
EXAMPLE 6.16
Water, 1.94 slugs/ft3
and 0.000011 ft2
/s, is pumped between two reservoirs at
0.2 ft3
/s through 400 ft of 2-in-diameter pipe and several minor losses, as shown in
Fig. E6.16. The roughness ratio is
/d 0.001. Compute the pump horsepower required.
E6.16
Solution
Write the steady flow energy equation between sections 1 and 2, the two reservoir surfaces:
where hp is the head increase across the pump. But since p1 p2 and V1 V2 0, solve
for the pump head:
(1)
Now with the flow rate known, calculate
Now list and sum the minor loss coefficients:
V
Q
A
0.2 ft3
/s
1
4( 2
12 ft)2 9.17 ft/s
hp z2 z1 hf a hm 120 ft 20 ft
V2
2g
a
fL
d
a Kb
p1
g
V2
1
2g
z1 a
p2
g
V2
2
2g
z2b hf a hm hp
Sharp
entrance
Open globe
valve
Pump
400 ft of pipe, d = ft
12-in
bend radius
Half-open
gate valve
Sharp
exit
Screwed
regular
90° elbow
z2 = 120 ft
z1 = 20 ft
2
1
2
12
396 Chapter 6 Viscous Flow in Ducts
whi29346_ch06_346-455.qxd 11/4/09 10:40 Page 396 Debd 208:MHDQ176:whi29346:0073529346:whi29346_pagefiles:](https://image.slidesharecdn.com/white09-220921151844-e1802c93/75/Seven-edition-in-fluid-mechanics-White-610-2048.jpg)


![Substitution into Eq. (1) gives the better estimate
or Ans.
A second iteration gives Q 10.22 m3
/h, a negligible change.
The second multiple-pipe system is the parallel flow case shown in Fig. 6.24b. Here
the pressure drop is the same in each pipe, and the total flow is the sum of the indi-
vidual flows:
(6.88a)
Q Q1 Q2 Q3 (6.88b)
If the total head loss is known, it is straightforward to solve for Qi in each pipe and
sum them, as will be seen in Example 6.18. The reverse problem, of determining Qi
when hf is known, requires iteration. Each pipe is related to hf by the Moody relation
hf f(L/d)(V2
/2g) fQ2
/C, where C 2
gd5
/8L. Thus each pipe has nearly quad-
ratic nonlinear parallel resistance, and head loss is related to total flow rate by
(6.89)
Since the fi vary with Reynolds number and roughness ratio, one begins Eq. (6.89)
by guessing values of fi (fully rough values are recommended) and calculating a first
estimate of hf. Then each pipe yields a flow-rate estimate Qi (Cihf/fi)1/2
and hence
a new Reynolds number and a better estimate of fi. Then repeat Eq. (6.89) to
convergence.
It should be noted that both of these parallel-pipe cases—finding either Q or hf —
are easily solved by EES if reasonable initial guesses are given.
EXAMPLE 6.18
Assume that the same three pipes in Example 6.17 are now in parallel with the same total
head loss of 20.3 m. Compute the total flow rate Q, neglecting minor losses.
Solution
From Eq. (6.88a) we can solve for each V separately:
(1)
Guess fully rough flow in pipe 1: f1 0.0262, V1 3.49 m/s; hence Re1 V1d1/
273,000. From the Moody chart read f1 0.0267; recompute V1 3.46 m/s, Q1 62.5
m3
/h. [This problem can also be solved from Eq. (6.51).]
20.3 m
V2
1
2g
1250f1
V2
2
2g
2500f2
V2
3
2g
2000f3
hf
Q2
1 g 1Ci/fi22 where Ci
2
gdi
5
8Li
hASB h1 h2 h3
Pipes in Parallel
Q 10.2 m3
/h
V1 0.565 m/s Q 1
4d2
1V1 2.84 10 3
m3
/s
400 Chapter 6 Viscous Flow in Ducts
whi29346_ch06_346-455.qxd 11/4/09 10:40 Page 400 Debd 208:MHDQ176:whi29346:0073529346:whi29346_pagefiles:](https://image.slidesharecdn.com/white09-220921151844-e1802c93/75/Seven-edition-in-fluid-mechanics-White-614-2048.jpg)


![By supplying these rules to each junction and independent loop in the network, one
obtains a set of simultaneous equations for the flow rates in each pipe leg and the
HGL (or pressure) at each junction. Solution may then be obtained by numerical iter-
ation, as first developed in a hand calculation technique by Prof. Hardy Cross in 1936
[17]. Computer solution of pipe network problems is now quite common and covered
in at least one specialized text [18]. Network analysis is quite useful for real water
distribution systems if well calibrated with the actual system head loss data.
The Moody chart is such a great correlation for tubes of any cross section with any
roughness or flow rate that we may be deluded into thinking that the world of
internal flow prediction is at our feet. Not so. The theory is reliable only for ducts of
constant cross section. As soon as the section varies, we must rely principally on
experiment to determine the flow properties. As mentioned many times before, experi-
mentation is a vital part of fluid mechanics.
Literally thousands of papers in the literature report experimental data for specific
internal and external viscous flows. We have already seen several examples:
1. Vortex shedding from a cylinder (Fig. 5.2).
2. Drag of a sphere and a cylinder (Fig. 5.3).
3. Hydraulic model of a dam spillway (Fig. 5.9).
4. Rough-wall pipe flows (Fig. 6.12).
5. Secondary flow in ducts (Fig. 6.16).
6. Minor duct loss coefficients (Sec. 6.9).
Chapter 7 will treat a great many more external flow experiments, especially in Sec.
7.6. Here we shall show data for one type of internal flow, the diffuser.
6.11 Experimental Duct Flows:
Diffuser Performance
6.11 Experimental Duct Flows: Diffuser Performance 403
7
2
1
3
6
4
5
10
12
9
11
8
A B C
D
E
Loop I Loop II
Loop III
Loop IV
F
G H
I
Fig. 6.25 Schematic of a piping
network.
whi29346_ch06_346-455.qxd 11/4/09 10:40 Page 403 Debd 208:MHDQ176:whi29346:0073529346:whi29346_pagefiles:](https://image.slidesharecdn.com/white09-220921151844-e1802c93/75/Seven-edition-in-fluid-mechanics-White-617-2048.jpg)
![A diffuser, shown in Fig. 6.26a and b, is an expansion or area increase intended to
reduce velocity in order to recover the pressure head of the flow. Rouse and Ince [6]
relate that it may have been invented by customers of the early Roman (about 100
A.D.) water supply system, where water flowed continuously and was billed accord-
ing to pipe size. The ingenious customers discovered that they could increase the flow
rate at no extra cost by flaring the outlet section of the pipe.
Engineers have always designed diffusers to increase pressure and reduce kinetic
energy of ducted flows, but until about 1950, diffuser design was a combination of art,
luck, and vast amounts of empiricism. Small changes in design parameters caused large
changes in performance. The Bernoulli equation seemed highly suspect as a useful tool.
Neglecting losses and gravity effects, the incompressible Bernoulli equation pre-
dicts that
(6.92)
where p0 is the stagnation pressure the fluid would achieve if the fluid were slowed
to rest (V 0) without losses.
The basic output of a diffuser is the pressure-recovery coefficient C p, defined as
(6.93)
where subscripts e and t mean the exit and the throat (or inlet), respectively. Higher
Cp means better performance.
Cp
pe pt
p0t pt
p 1
2V2
p0 const
Diffuser Performance
404 Chapter 6 Viscous Flow in Ducts
W1 2θ W2
2
L
(a)
(b)
L
D De
Throat
Exit
L
W1
100
70
40
20
10
7
4
2
1
1 2 4 7 10 20 40 100
Transitory
stall Maximum
unsteadiness
2
,
degrees
Cp max
c
b
Jet flow
θ
(c)
c
No
stall a
a
b
Bistable
steady stall
1
b
2θ
Fig. 6.26 Diffuser geometry and typical flow regimes: (a) geometry of a flat-walled diffuser;
(b) geometry of a conical diffuser; (c) flat diffuser stability map. (From Ref. 14, by permis-
sion of Creare, Inc.)
whi29346_ch06_346-455.qxd 11/10/09 5:17PM Page 404 ntt 208:MHDQ176:whi29346:0073529346:whi29346_pagefiles:](https://image.slidesharecdn.com/white09-220921151844-e1802c93/75/Seven-edition-in-fluid-mechanics-White-618-2048.jpg)
![Consider the flat-walled diffuser in Fig. 6.26a, where section 1 is the inlet and sec-
tion 2 the exit. Application of Bernoulli’s equation (6.92) to this diffuser predicts that
or (6.94)
Meanwhile, steady one-dimensional continuity would require that
(6.95)
Combining (6.94) and (6.95), we can write the performance in terms of the area ratio
AR A2/A1, which is a basic parameter in diffuser design:
(6.96)
A typical design would have AR 5:1, for which Eq. (6.96) predicts Cp 0.96, or
nearly full recovery. But, in fact, measured values of Cp for this area ratio [14] are
only as high as 0.86 and can be as low as 0.24.
The basic reason for the discrepancy is flow separation, as sketched in Fig. 6.27.
The increasing pressure in the diffuser is an unfavorable gradient (Sec. 7.5), which
Cp,frictionless 1 (AR) 2
Q V1A1 V2A2
Cp,frictionless 1 a
V2
V1
b
2
p01 p1 1
2V1
2
p2 1
2V2
2
p02
6.11 Experimental Duct Flows: Diffuser Performance 405
Thin
boundary
layers
Low
velocity,
high
pressure
(a)
Thick
boundary
layers
(b)
Backflow
High
velocity,
low
pressure
“Stalled”
flow
Separation
point
Fig. 6.27 Diffuser performance:
(a) ideal pattern with good
performance; (b) actual measured
pattern with boundary layer separa-
tion and resultant poor
performance.
whi29346_ch06_346-455.qxd 11/4/09 10:41 Page 405 Debd 208:MHDQ176:whi29346:0073529346:whi29346_pagefiles:](https://image.slidesharecdn.com/white09-220921151844-e1802c93/75/Seven-edition-in-fluid-mechanics-White-619-2048.jpg)
![causes the viscous boundary layers to break away from the walls and greatly
reduces the performance. Computational fluid dynamics (CFD) can now predict
this behavior.
As an added complication to boundary layer separation, the flow patterns in a dif-
fuser are highly variable and were considered mysterious and erratic until 1955, when
Kline revealed the structure of these patterns with flow visualization techniques in a
simple water channel.
A complete stability map of diffuser flow patterns was published in 1962 by Fox
and Kline [21], as shown in Fig. 6.26c. There are four basic regions. Below line
aa there is steady viscous flow, no separation, and moderately good performance.
Note that even a very short diffuser will separate, or stall, if its half-angle is greater
than 10°.
Between lines aa and bb is a transitory stall pattern with strongly unsteady flow.
Best performance (highest Cp) occurs in this region. The third pattern, between bb
and cc, is steady bistable stall from one wall only. The stall pattern may flip-flop from
one wall to the other, and performance is poor.
The fourth pattern, above line cc, is jet flow, where the wall separation is so gross
and pervasive that the mainstream ignores the walls and simply passes on through at
nearly constant area. Performance is extremely poor in this region.
Dimensional analysis of a flat-walled or conical diffuser shows that Cp should
depend on the following parameters:
1. Any two of the following geometric parameters:
a. Area ratio AR A2/A1 or (De /D)2
b. Divergence angle 2
c. Slenderness L/W1 or L/D
2. Inlet Reynolds number Ret V1W1/ or Ret V1D/
3. Inlet Mach number Mat V1/a1
4. Inlet boundary layer blockage factor Bt ABL/A1, where ABL is the wall area
blocked, or displaced, by the retarded boundary layer flow in the inlet (typically
Bt varies from 0.03 to 0.12)
A flat-walled diffuser would require an additional shape parameter to describe its
cross section:
5. Aspect ratio AS b/W1
Even with this formidable list, we have omitted five possible important effects: inlet
turbulence, inlet swirl, inlet profile vorticity, superimposed pulsations, and down-
stream obstruction, all of which occur in practical machinery applications.
The three most important parameters are AR, , and B. Typical performance maps
for diffusers are shown in Fig. 6.28. For this case of 8 to 9 percent blockage, both
the flat-walled and conical types give about the same maximum performance, Cp
0.70, but at different divergence angles (9° flat versus 4.5° conical). Both types fall
far short of the Bernoulli estimates of Cp 0.93 (flat) and 0.99 (conical), primarily
because of the blockage effect.
From the data of Ref. 14 we can determine that, in general, performance decreases
with blockage and is approximately the same for both flat-walled and conical diffusers,
406 Chapter 6 Viscous Flow in Ducts
whi29346_ch06_346-455.qxd 11/4/09 10:41 Page 406 Debd 208:MHDQ176:whi29346:0073529346:whi29346_pagefiles:](https://image.slidesharecdn.com/white09-220921151844-e1802c93/75/Seven-edition-in-fluid-mechanics-White-620-2048.jpg)
![as shown in Table 6.6. In all cases, the best conical diffuser is 10 to 80 percent longer
than the best flat-walled design. Therefore, if length is limited in the design, the flat-
walled design will give the better performance depending on duct cross section.
The experimental design of a diffuser is an excellent example of a successful attempt
to minimize the undesirable effects of adverse pressure gradient and flow separation.
6.11 Experimental Duct Flows: Diffuser Performance 407
AS = 1.0
Mat = 0.2
Bt = 0.08
ReDh
= 279,000
Flat
5
4.5
4
3.5
3
2
1.75
20°
18°
16°
14°
12°
10° 8°
4 5
6°
6 7 8 9 10 12 14 16 18 20
2 = 4°
L
W1
0.60
0.62
0.64
0.66
0.68
0.69
0
.
7
0
Cp
Transitory
stall
boundary
AR
(a)
Table 6.6 Maximum Diffuser
Performance Data [14]
Flat-walled Conical
Inlet blockage
Bt Cp,max L/W1 Cp,max L/d
0.02 0.86 18 0.83 20
0.04 0.80 18 0.78 22
0.06 0.75 19 0.74 24
0.08 0.70 20 0.71 26
0.10 0.66 18 0.68 28
0.12 0.63 16 0.65 30
Fig. 6.28a Typical performance
maps for flat-wall and conical dif-
fusers at similar operating
conditions: flat wall. (From Ref.
14, by permission of Creare, Inc.)
whi29346_ch06_346-455.qxd 11/4/09 10:41 Page 407 Debd 208:MHDQ176:whi29346:0073529346:whi29346_pagefiles:](https://image.slidesharecdn.com/white09-220921151844-e1802c93/75/Seven-edition-in-fluid-mechanics-White-621-2048.jpg)


![Floats or Buoyant Particles. A simple but effective estimate of flow velocity can be
found from visible particles entrained in the flow. Examples include flakes on the sur-
face of a channel flow, small neutrally buoyant spheres mixed with a liquid, or hydro-
gen bubbles. Sometimes gas flows can be estimated from the motion of entrained dust
particles. One must establish whether the particle motion truly simulates the fluid motion.
Floats are commonly used to track the movement of ocean waters and can be designed
to move at the surface, along the bottom, or at any given depth [24]. Many official tidal
current charts [25] were obtained by releasing and timing a floating spar attached to a
length of string. One can release whole groups of spars to determine a flow pattern.
Rotating Sensors. The rotating devices of Fig. 6.29a to d can be used in either gases
or liquids, and their rotation rate is approximately proportional to the flow velocity.
The cup anemometer (Fig. 6.29a) and Savonius rotor (Fig. 6.29b) always rotate the
same way, regardless of flow direction. They are popular in atmospheric and oceano-
graphic applications and can be fitted with a direction vane to align themselves with
the flow. The ducted-propeller (Fig. 6.29c) and free-propeller (Fig. 6.29d) meters must
be aligned with the flow parallel to their axis of rotation. They can sense reverse flow
because they will then rotate in the opposite direction. All these rotating sensors can
be attached to counters or sensed by electromagnetic or slip-ring devices for either a
continuous or a digital reading of flow velocity. All have the disadvantage of being
relatively large and thus not representing a “point.”
Pitot-Static Tube. A slender tube aligned with the flow (Figs. 6.29g and 6.30) can
measure local velocity by means of a pressure difference. It has sidewall holes to
measure the static pressure ps in the moving stream and a hole in the front to meas-
ure the stagnation pressure p0, where the stream is decelerated to zero velocity. Instead
of measuring p0 or ps separately, it is customary to measure their difference with, say,
a transducer, as in Fig. 6.30.
If ReD 1000, where D is the probe diameter, the flow around the probe is nearly
frictionless and Bernoulli’s relation, Eq. (3.54), applies with good accuracy. For
incompressible flow
ps 1
2V2
gzs p0 1
2(0)2
gz0
410 Chapter 6 Viscous Flow in Ducts
V
θ
ps
Stagnation
pressure 4 to 8
holes
Static
pressure
≈
Free-stream
pressure
+10%
–10%
Error
0° 10° 20°
Static pressure
Stagnation pressure
Yaw angle
p0
p
S
Differential
pressure
transducer
8D
θ
0
Fig. 6.30 Pitot-static tube for com-
bined measurement of static and
stagnation pressure in a moving
stream.
whi29346_ch06_346-455.qxd 11/4/09 10:41 Page 410 Debd 208:MHDQ176:whi29346:0073529346:whi29346_pagefiles:](https://image.slidesharecdn.com/white09-220921151844-e1802c93/75/Seven-edition-in-fluid-mechanics-White-624-2048.jpg)
![Assuming that the elevation pressure difference g(zs z0) is negligible, this reduces to
(6.97)
This is the Pitot formula, named after the French engineer, Henri de Pitot, who
designed the device in 1732.
The primary disadvantage of the pitot tube is that it must be aligned with the flow
direction, which may be unknown. For yaw angles greater than 5°, there are substantial
errors in both the p0 and ps measurements, as shown in Fig. 6.30. The pitot-static tube
is useful in liquids and gases; for gases a compressibility correction is necessary if the
stream Mach number is high (Chap. 9). Because of the slow response of the fluid-filled
tubes leading to the pressure sensors, it is not useful for unsteady flow measurements.
It does resemble a point and can be made small enough to measure, for example, blood
flow in arteries and veins. It is not suitable for low-velocity measurement in gases
because of the small pressure differences developed. For example, if V 1 ft/s in stan-
dard air, from Eq. (6.97) we compute p0 p equal to only 0.001 lbf/ft2
(0.048 Pa).
This is beyond the resolution of most pressure gages.
Electromagnetic Meter. If a magnetic field is applied across a conducting fluid, the
fluid motion will induce a voltage across two electrodes placed in or near the flow.
The electrodes can be streamlined or built into the wall, and they cause little or no
flow resistance. The output is very strong for highly conducting fluids such as liquid
metals. Seawater also gives good output, and electromagnetic current meters are in
common use in oceanography. Even low-conductivity freshwater can be measured by
amplifying the output and insulating the electrodes. Commercial instruments are avail-
able for most liquid flows but are relatively costly. Electromagnetic flowmeters are
treated in Ref. 26.
Hot-Wire Anemometer. A very fine wire (d 0.01 mm or less) heated between two
small probes, as in Fig. 6.29e, is ideally suited to measure rapidly fluctuating flows
such as the turbulent boundary layer. The idea dates back to work by L. V. King in
1914 on heat loss from long thin cylinders. If electric power is supplied to heat the
cylinder, the loss varies with flow velocity across the cylinder according to King’s law
(6.98)
where n at very low Reynolds numbers and equals at high Reynolds numbers.
The hot wire normally operates in the high-Reynolds-number range but should be
calibrated in each situation to find the best-fit a, b, and n. The wire can be oper-
ated either at constant current I, so that resistance R is a measure of V, or at constant
resistance R (constant temperature), with I a measure of velocity. In either case, the
output is a nonlinear function of V, and the equipment should contain a linearizer to
produce convenient velocity data. Many varieties of commercial hot-wire equipment
are available, as are do-it-yourself designs [27]. Excellent detailed discussions of the
hot wire are given in Ref. 28.
Because of its frailty, the hot wire is not suited to liquid flows, whose high den-
sity and entrained sediment will knock the wire right off. A more stable yet quite sen-
sitive alternative for liquid flow measurement is the hot-film anemometer (Fig. 6.29f).
A thin metallic film, usually platinum, is plated onto a relatively thick support, which
1
2
1
3
q I2
R a b(V)n
V c2
(p0 ps)
d
1/2
6.12 Fluid Meters 411
whi29346_ch06_346-455.qxd 11/4/09 10:41 Page 411 Debd 208:MHDQ176:whi29346:0073529346:whi29346_pagefiles:](https://image.slidesharecdn.com/white09-220921151844-e1802c93/75/Seven-edition-in-fluid-mechanics-White-625-2048.jpg)
![can be a wedge, a cone, or a cylinder. The operation is similar to the hot wire. The
cone gives best response but is liable to error when the flow is yawed to its axis.
Hot wires can easily be arranged in groups to measure two- and three-dimensional
velocity components.
Laser-Doppler Anemometer. In the LDA a laser beam provides highly focused, coher-
ent monochromatic light that is passed through the flow. When this light is scattered
from a moving particle in the flow, a stationary observer can detect a change, or doppler
shift, in the frequency of the scattered light. The shift f is proportional to the veloc-
ity of the particle. There is essentially zero disturbance of the flow by the laser.
Figure 6.29h shows the popular dual-beam mode of the LDA. A focusing device
splits the laser into two beams, which cross the flow at an angle . Their intersection,
which is the measuring volume or resolution of the measurement, resembles an ellip-
soid about 0.5 mm wide and 0.1 mm in diameter. Particles passing through this meas-
uring volume scatter the beams; they then pass through receiving optics to a pho-
todetector, which converts the light to an electric signal. A signal processor then
converts electric frequency to a voltage that can be either displayed or stored. If is
the wavelength of the laser light, the measured velocity is given by
(6.99)
Multiple components of velocity can be detected by using more than one photode-
tector and other operating modes. Either liquids or gases can be measured as long as
scattering particles are present. In liquids, normal impurities serve as scatterers, but
gases may have to be seeded. The particles may be as small as the wavelength of the
light. Although the measuring volume is not as small as with a hot wire, the LDA is
capable of measuring turbulent fluctuations.
The advantages of the LDA are as follows:
1. No disturbance of the flow.
2. High spatial resolution of the flow field.
3. Velocity data that are independent of the fluid thermodynamic properties.
4. An output voltage that is linear with velocity.
5. No need for calibration.
The disadvantages are that both the apparatus and the fluid must be transparent to light
and that the cost is high (a basic system shown in Fig. 6.29h begins at about $50,000).
Once installed, an LDA can map the entire flow field in minutest detail. To truly appre-
ciate the power of the LDA, one should examine, for instance, the amazingly detailed
three-dimensional flow profiles measured by Eckardt [29] in a high-speed centrifugal com-
pressor impeller. Extensive discussions of laser velocimetry are given in Refs. 38 and 39.
Particle Image Velocimetry. This popular new idea, called PIV for short, measures not
just a single point but instead maps the entire field of flow. An illustration was shown
in Fig. 1.17b. The flow is seeded with neutrally buoyant particles. A planar laser light
sheet across the flow is pulsed twice and photographed twice. If r is the particle
displacement vector over a short time t, an estimate of its velocity is V r/t.
V
f
2 sin (/2)
412 Chapter 6 Viscous Flow in Ducts
whi29346_ch06_346-455.qxd 11/4/09 10:41 Page 412 Debd 208:MHDQ176:whi29346:0073529346:whi29346_pagefiles:](https://image.slidesharecdn.com/white09-220921151844-e1802c93/75/Seven-edition-in-fluid-mechanics-White-626-2048.jpg)
![A dedicated computer applies this formula to a whole cloud of particles and thus maps
the flow field. One can also use the data to calculate velocity gradient and vorticity
fields. Since the particles all look alike, other cameras may be needed to identify them.
Three-dimensional velocities can be measured by two cameras in a stereoscopic
arrangement. The PIV method is not limited to stop-action. New high-speed cameras
(up to 10,000 frames per second) can record movies of unsteady flow fields. For fur-
ther details, see the monograph by M. Raffel [51].
EXAMPLE 6.20
The pitot-static tube of Fig. 6.30 uses mercury as a manometer fluid. When it is placed in
a water flow, the manometer height reading is h 8.4 in. Neglecting yaw and other errors,
what is the flow velocity V in ft/s?
Solution
From the two-fluid manometer relation (2.33), with zA z2, the pressure difference is related
to h by
Taking the specific weights of mercury and water from Table 2.1, we have
The density of water is 62.4/32.2 1.94 slugs/ft3
. Introducing these values into the pitot-
static formula (6.97), we obtain
Ans.
Since this is a low-speed flow, no compressibility correction is needed.
It is often desirable to measure the integrated mass, or volume flow, passing through a
duct. Accurate measurement of flow is vital in billing customers for a given amount of
liquid or gas passing through a duct. The different devices available to make these meas-
urements are discussed in great detail in the ASME text on fluid meters [30]. These
devices split into two classes: mechanical instruments and head loss instruments.
The mechanical instruments measure actual mass or volume of fluid by trapping
it and counting it. The various types of measurement are
1. Mass measurement
a. Weighing tanks
b. Tilting traps
2. Volume measurement
a. Volume tanks
b. Reciprocating pistons
Volume Flow Measurements
V c
2(549 lbf/ft2
)
1.94 slugs/ft3 d
1/2
23.8 ft/s
p0 ps (846 62.4 lbf/ft3
)
8.4
12
ft 549 lbf/ft2
p0 ps (M w)h
6.12 Fluid Meters 413
whi29346_ch06_346-455.qxd 11/4/09 10:41 Page 413 Debd 208:MHDQ176:whi29346:0073529346:whi29346_pagefiles:](https://image.slidesharecdn.com/white09-220921151844-e1802c93/75/Seven-edition-in-fluid-mechanics-White-627-2048.jpg)


![acceleration associated with noninertial coordinates [recall Fig. 3.11 and the Coriolis
term 2 V in Eq. (3.48)]. The output of the meter is directly proportional to mass
flow.
Figure 6.37 is a schematic of a Coriolis device, to be inserted into a piping sys-
tem. The flow enters a double-loop, double-tube arrangement, which is electromag-
netically vibrated at a high natural frequency (amplitude 1 mm and frequency
100 Hz). The up flow induces inward loop motion, while the down flow creates out-
ward loop motion, both due to the Coriolis effect. Sensors at both ends register a
phase difference that is proportional to mass flow. Quoted accuracy is approximately
0.2 percent of full scale.
Laminar Flow Element. In many, perhaps most, commercial flowmeters, the flow
through the meter is turbulent and the variation of flow rate with pressure drop is
nonlinear. In laminar duct flow, however, Q is linearly proportional to p, as in
Eq. (6.12): Q [R4
/(8L)] p. Thus a laminar flow sensing element is attrac-
tive, since its calibration will be linear. To ensure laminar flow for what otherwise
would be a turbulent condition, all or part of the fluid is directed into small pas-
sages, each of which has a low (laminar) Reynolds number. A honeycomb is a pop-
ular design.
Figure 6.38 uses axial flow through a narrow annulus to effect laminar flow. The
theory again predicts Qp, as in Eq. (6.73). However, the flow is very sensitive to
passage size; for example, halving the annulus clearance increases p more than eight
times. Careful calibration is thus necessary. In Fig. 6.38 the laminar flow concept has
been synthesized into a complete mass flow system, with temperature control, differ-
ential pressure measurement, and a microprocessor all self-contained. The accuracy
of this device is rated at 0.2 percent.
Bernoulli Obstruction Theory. Consider the generalized flow obstruction shown in
Fig. 6.39. The flow in the basic duct of diameter D is forced through an obstruction
6.12 Fluid Meters 419
Fig. 6.36 A commercial rotameter.
The float rises in the tapered tube
to an equilibrium position, which
is a measure of the fluid flow rate.
(Courtesy of Blue White Industries,
Huntington Beach, CA.)
Fig. 6.37 A Coriolis mass flowme-
ter. (Courtesy of ABB Instrumenta-
tion, Inc.)
whi29346_ch06_346-455.qxd 11/4/09 10:41 Page 419 Debd 208:MHDQ176:whi29346:0073529346:whi29346_pagefiles:](https://image.slidesharecdn.com/white09-220921151844-e1802c93/75/Seven-edition-in-fluid-mechanics-White-633-2048.jpg)


![Thus Eq. (6.104) can be written in the equivalent form
(6.108)
Obviously the flow coefficient is correlated in the same manner:
(6.109)
Occasionally one uses the throat Reynolds number instead of the approach Reynolds
number:
(6.110)
Since the design parameters are assumed known, the correlation of from Eq. (6.109)
or of Cd from Eq. (6.105) is the desired solution to the fluid metering problem.
The mass flow is related to Q by
(6.111)
and is thus correlated by exactly the same formulas.
Figure 6.40 shows the three basic devices recommended for use by the International
Organization for Standardization (ISO) [31]: the orifice, nozzle, and venturi tube.
ṁ Q
Red
Vtd
ReD
f(, ReD)
Q At c
2(p1 p2)
d
1/2
422 Chapter 6 Viscous Flow in Ducts
3
2d
Flow
d 0.6d
d
t2 13 mm
t1 0.15D
(a)
Flow
d
D
Bevel angle:
45° to 60°
Edge thickness:
0.005D to 0.02D
Plate thickness:
up to 0.05D
(b)
Ellipse
2
D
Flow
0.7d
Throat tap
ISA 1932
nozzle shape
2
d
Conical
diffuser
15°
(c)
Fig. 6.40 Standard shapes for the
three primary Bernoulli obstruction-
type meters: (a) long-radius nozzle;
(b) thin-plate orifice; (c) venturi
nozzle. (Based on data from the
International Organization for
Standardization.)
whi29346_ch06_346-455.qxd 08/23/2010 3:25 pm Page 422 207:MH01007_r1:whi29346_disk1of1:0073529346:whi29346_pagefiles:](https://image.slidesharecdn.com/white09-220921151844-e1802c93/75/Seven-edition-in-fluid-mechanics-White-636-2048.jpg)
![Thin-Plate Orifi ce. The thin-plate orifice, Fig. 6.40b, can be made with in the range
of 0.2 to 0.8, except that the hole diameter d should not be less than 12.5 mm. To
measure p1 and p2, three types of tappings are commonly used:
1. Corner taps where the plate meets the pipe wall.
2. D: D taps: pipe-wall taps at D upstream and D downstream.
3. Flange taps: 1 in (25 mm) upstream and 1 in (25 mm) downstream of the plate,
regardless of the size D.
Types 1 and 2 approximate geometric similarity, but since the flange taps 3 do not,
they must be correlated separately for every single size of pipe in which a flange-tap
plate is used [30, 31].
Figure 6.41 shows the discharge coefficient of an orifice with D: D or type 2 taps
in the Reynolds number range ReD 104
to 107
of normal use. Although detailed charts
such as Fig. 6.41 are available for designers [30], the ASME recommends use of the
curve-fit formulas developed by the ISO [31]. The basic form of the curve fit is [42]
(6.112)
where f() 0.5959 0.03122.1
0.1848
Cd f() 91.712.5
ReD
0.75
0.094
1 4 F1 0.03373
F2
1
2
1
2
1
2
6.12 Fluid Meters 423
0.66
0.65
0.64
0.63
0.62
0.61
0.60
0.59
0.58
104 106 107
ReD
0.7
0.6
0.5
0.4
0.3
0.2
β = 0.8 =
d
D
p1
p2
d
Flow
1
2
D
Cd
105
D
D
Fig. 6.41 Discharge coefficient for
a thin-plate orifice with D: D
taps, plotted from Eqs. (6.112) and
(6.113b).
1
2
whi29346_ch06_346-455.qxd 11/10/09 5:17PM Page 423 ntt 208:MHDQ176:whi29346:0073529346:whi29346_pagefiles:](https://image.slidesharecdn.com/white09-220921151844-e1802c93/75/Seven-edition-in-fluid-mechanics-White-637-2048.jpg)
![424 Chapter 6 Viscous Flow in Ducts
The correlation factors F1 and F2 vary with tap position:
Corner taps: (6.113a)
(6.113b)
Flange taps: (6.113c)
Note that the flange taps (6.113c), not being geometrically similar, use raw diameter
in inches in the formula. The constants will change if other diameter units are used.
We cautioned against such dimensional formulas in Example 1.4 and Eq. (5.17) and
give Eq. (6.113c) only because flange taps are widely used in the United States.
Flow Nozzle. The flow nozzle comes in two types, a long-radius type shown in Fig.
6.40a and a short-radius type (not shown) called the ISA 1932 nozzle [30, 31]. The
flow nozzle, with its smooth rounded entrance convergence, practically eliminates the
vena contracta and gives discharge coefficients near unity. The nonrecoverable loss is
still large because there is no diffuser provided for gradual expansion.
The ISO recommended correlation for long-radius-nozzle discharge coefficient is
(6.114)
The second form is independent of the ratio and is plotted in Fig. 6.42. A similar
ISO correlation is recommended for the short-radius ISA 1932 flow nozzle:
(6.115)
Flow nozzles may have values between 0.2 and 0.8.
(0.000215 0.001125 0.002494.7
)a
106
ReD
b
1.15
Cd 0.9900 0.22624.1
Cd 0.9965 0.006531/2
a
106
ReD
b
1/2
0.9965 0.00653a
106
Red
b
1/2
F2
1
D (in)
F1 •
1
D (in)
D 2.3 in
0.4333 2.0
D
2.3 in
F1 0.4333 F2 0.47
D: 1
2D taps:
F1 0 F2 0
1.00
0.99
0.98
0.97
0.96
0.95
0.94
0.93
104
105
106
107
108
Cd
Red, ReD
All values
of 
Long-radius
nozzle (Red)
Classical
Herschel venturi (ReD)
Fig. 6.42 Discharge coefficient for
long-radius nozzle and classical
Herschel-type venturi.
whi29346_ch06_346-455.qxd 11/4/09 10:41 Page 424 Debd 208:MHDQ176:whi29346:0073529346:whi29346_pagefiles:](https://image.slidesharecdn.com/white09-220921151844-e1802c93/75/Seven-edition-in-fluid-mechanics-White-638-2048.jpg)


![EXAMPLE 6.21
We want to meter the volume flow of water ( 1000 kg/m3
, 1.02 10 6
m2
/s)
moving through a 200-mm-diameter pipe at an average velocity of 2.0 m/s. If the dif-
ferential pressure gage selected reads accurately at p1 p2 50,000 Pa, what size meter
should be selected for installing (a) an orifice with D: D taps, (b) a long-radius flow
nozzle, or (c) a venturi nozzle? What would be the nonrecoverable head loss for each
design?
Solution
Here the unknown is the ratio of the meter. Since the discharge coefficient is a compli-
cated function of , iteration or EES will be necessary. We are given D 0.2 m and V1
2.0 m/s. The pipe-approach Reynolds number is thus
For all three cases [(a) to (c)] the generalized formula (6.108) holds:
(1)
where the given data are V1 2.0 m/s, 1000 kg/m3
, and p 50,000 Pa. Inserting
these known values into Eq. (1) gives a relation between and :
(2)
The unknowns are (or ) and Cd. Parts (a) to (c) depend on the particular chart or for-
mula needed for Cd fcn(ReD, ). We can make an initial guess 0.5 and iterate to
convergence.
2.0
2 c
2(50,000)
1000
d
1/2
or 2
0.2
Vt
V1
2 c
2(p1 p2)
d
1/2
Cd
(1 4
)1/2
ReD
V1D
v
(2.0)(0.2)
1.02 10 6 392,000
1
2
6.12 Fluid Meters 427
Sharp-edged orifices:
 = 0.2 0.5 0.7 0.8
 = 0.2 0.5 0.6 0.7 0.8
Nozzles and venturis:
Expansion
factor,
Y
0.6
0.7
0.8
0.9
1
0.6 0.7 0.8 0.9 1
p2/p1
Fig. 6.45 Compressible flow
expansion factor Y for flowmeters.
whi29346_ch06_346-455.qxd 11/4/09 10:41 Page 427 Debd 208:MHDQ176:whi29346:0073529346:whi29346_pagefiles:](https://image.slidesharecdn.com/white09-220921151844-e1802c93/75/Seven-edition-in-fluid-mechanics-White-641-2048.jpg)

![EXAMPLE 6.22
A long-radius nozzle of diameter 6 cm is used to meter air flow in a 10-cm-diameter pipe.
Upstream conditions are p1 200 kPa and T1 100°C. If the pressure drop through the
nozzle is 60 kPa, estimate the flow rate in m3
/s.
Solution
• Assumptions: The pressure drops 30 percent, so we need the compressibility factor Y,
and Eq. (6.117) is applicable to this problem.
• Approach: Find 1 and Cd and apply Eq. (6.117) with 6/10 0.6.
• Property values: Given p1 and T1, 1 p1/RT1 (200,000)/[287(100 273)] 1.87
kg/m3
. The downstream pressure is p2 200 60 140 kPa, hence p2/p1 0.7. At
100°C, from Table A.2, the viscosity of air is 2.17E-5 kg/m-s
• Solution steps: Initially apply Eq. (6.117) by guessing, from Fig. 6.42, that Cd 0.98.
From Fig. 6.45, for a nozzle with p2/p1 0.7 and 0.6, read Y 0.80. Then
Now estimate Red, putting it in the convenient mass flow form:
Returning to Fig. 6.42, we could read a slightly better Cd 0.99. Thus our final estimate is
Ans.
• Comments: Figure 6.45 is not just a “chart” for engineers to use casually. It is based on
the compressible flow theory of Chap. 9. There, we may reassign this example as a theory.
ṁ 1.14 kg/s
Red
Vd
4 ṁ
d
4(1.13 kg/s)
(2.17 E-5 kg/m s)(0.06 m)
1.11E6
1.13
kg
s
ṁ Cd YAt
B
21(p1 p2)
1 4 (0.98)(0.80)
4
(0.06 m)2
B
2(1.87 kg/m3
)(60,000 Pa)
1 (0.6)
Summary 429
This chapter has been concerned with internal pipe and duct flows, which are proba-
bly the most common problems encountered in engineering fluid mechanics. Such
flows are very sensitive to the Reynolds number and change from laminar to transi-
tional to turbulent flow as the Reynolds number increases.
The various Reynolds number regimes were outlined, and a semiempirical
approach to turbulent flow modeling was presented. The chapter then made a detailed
analysis of flow through a straight circular pipe, leading to the famous Moody chart
(Fig. 6.13) for the friction factor. Possible uses of the Moody chart were discussed
for flow rate and sizing problems, as well as the application of the Moody chart to
noncircular ducts using an equivalent duct “diameter.” The addition of minor losses
due to valves, elbows, fittings, and other devices was presented in the form of loss
coefficients to be incorporated along with Moody-type friction losses. Multiple-pipe
systems were discussed briefly and were seen to be quite complex algebraically and
appropriate for computer solution.
Summary
whi29346_ch06_346-455.qxd 11/4/09 10:41 Page 429 Debd 208:MHDQ176:whi29346:0073529346:whi29346_pagefiles:](https://image.slidesharecdn.com/white09-220921151844-e1802c93/75/Seven-edition-in-fluid-mechanics-White-643-2048.jpg)
![430 Chapter 6 Viscous Flow in Ducts
Problems
Most of the problems herein are fairly straightforward. More diffi-
cult or open-ended assignments are labeled with an asterisk. Prob-
lems labeled with an EES icon will benefit from the use of the
Engineering Equation Solver (EES), while problems labeled with a
computer icon may require the use of a computer. The standard
end-of-chapter problems P6.1 to P6.163 (categorized in the problem
list here) are followed by word problems W6.1 to W6.4, funda-
mentals of engineering exam problems FE6.1 to FE6.15, compre-
hensive problems C6.1 to C6.9, and design projects D6.1 and D6.2.
Problem Distribution
Section Topic Problems
6.1 Reynolds number regimes P6.1–P6.5
6.2 Internal and external flow P6.6–P6.8
6.3 Head loss—friction factor P6.9–P6.11
6.4 Laminar pipe flow P6.12–P6.33
6.5 Turbulence modeling P6.34–P6.40
6.6 Turbulent pipe flow P6.41–P6.62
6.7 Flow rate and sizing problems P6.63–P6.85
6.8 Noncircular ducts P6.86–P6.98
6.9 Minor or local losses P6.99–P6.110
6.10 Series and parallel pipe systems P6.111–P6.120
6.10 Three-reservoir and pipe network systems P6.121–P6.130
6.11 Diffuser performance P6.131–P6.134
6.12 The pitot-static tube P6.135–P6.139
6.12 Flowmeters: the orifice plate P6.140–P6.148
6.12 Flowmeters: the flow nozzle P6.149–P6.153
6.12 Flowmeters: the venturi meter P6.154–P6.159
6.12 Flowmeters: other designs P6.160–P6.161
6.12 Flowmeters: compressibility correction P6.162–P6.163
Reynolds number regimes
P6.1 An engineer claims that the flow of SAE 30W oil, at
20C, through a 5-cm-diameter smooth pipe at 1 million
N/h, is laminar. Do you agree? A million newtons is a lot,
so this sounds like an awfully high flow rate.
P6.2 The present pumping rate of North Slope crude oil
through the Alaska Pipeline (see the chapter-opener
photo) is about 600,000 barrels per day (1 barrel 42
U.S. gallons). What would be the maximum rate if the
flow were constrained to be laminar? Assume that Alaskan
oil fits Fig. A.1 of the Appendix at 60°C.
EES
P6.3 Following up Prob. P6.2, suppose the Alaska Pipeline
were carrying 30 million U.S. gallons per day of SAE 30W
oil at 20°C? Estimate the Reynolds number. Is the flow
laminar?
P6.4 For flow of SAE 30 oil through a 5-cm-diameter pipe, from
Fig. A.1, for what flow rate in m3
/h would we expect tran-
sition to turbulence at (a) 20°C and (b) 100°C?
P6.5 In flow past a body or wall, early transition to turbulence
can be induced by placing a trip wire on the wall across the
flow, as in Fig. P6.5. If the trip wire in Fig. P6.5 is placed
where the local velocity is U, it will trigger turbulence if
Ud/ 850, where d is the wire diameter [3, p. 388]. If the
sphere diameter is 20 cm and transition is observed at ReD
90,000, what is the diameter of the trip wire in mm?
P6.5
Internal and external flow
P6.6 For flow of a uniform stream parallel to a sharp flat plate,
transition to a turbulent boundary layer on the plate may
occur at Rex Ux/ 1E6, where U is the approach
velocity and x is distance along the plate. If U 2.5 m/s,
determine the distance x for the following fluids at 20C
and 1 atm: (a) hydrogen, (b) air, (c) gasoline, (d) water,
(e) mercury, and ( f ) glycerin.
P6.7 Cola, approximated as pure water at 20°C, is to fill an
8-oz container (1 U.S. gal 128 fl oz) through a 5-mm-
diameter tube. Estimate the minimum filling time if the
tube flow is to remain laminar. For what cola (water) tem-
perature would this minimum time be 1 min?
P6.8 When water at 20°C is in steady turbulent flow through
an 8-cm-diameter pipe, the wall shear stress is 72 Pa.
What is the axial pressure gradient (p/x) if the pipe is
(a) horizontal and (b) vertical with the flow up?
D
Trip wire d
U
Diffusers are added to ducts to increase pressure recovery at the exit of a system.
Their behavior was presented as experimental data, since the theory of real diffusers
is still not well developed. The chapter ended with a discussion of flowmeters, espe-
cially the pitot-static tube and the Bernoulli obstruction type of meter. Flowmeters
also require careful experimental calibration.
whi29346_ch06_346-455.qxd 11/4/09 10:41 Page 430 Debd 208:MHDQ176:whi29346:0073529346:whi29346_pagefiles:](https://image.slidesharecdn.com/white09-220921151844-e1802c93/75/Seven-edition-in-fluid-mechanics-White-644-2048.jpg)


![0.41 is Ká rmá n’s dimensionless mixing-length con-
stant [2, 3]. Assuming that turb w near the wall, show
that this expression can be integrated to yield the loga-
rithmic overlap law, Eq. (6.28).
Turbulent pipe flow––no minor losses
P6.41 Two reservoirs, which differ in surface elevation by 40 m,
are connected by 350 m of new pipe of diameter 8 cm. If
the desired flow rate is at least 130 N/s of water at 20C,
can the pipe material be made of (a) galvanized iron,
(b) commercial steel, or (c) cast iron? Neglect minor losses.
P6.42 Fluid flows steadily, at volume rate Q, through a large hor-
izontal pipe and then divides into two small pipes, the larger
of which has an inside diameter of 25 mm and carries three
times the flow of the smaller pipe. Both small pipes have the
same length and pressure drop. If all flows are turbulent, at
ReD near 104
, estimate the diameter of the smaller pipe.
P6.43 A reservoir supplies water through 100 m of 30-cm-
diameter cast iron pipe to a turbine that extracts 80 hp from
the flow. The water then exhausts to the atmosphere.
P6.43
Neglect minor losses. (a) Assuming that f 0.019, find the
flow rate (which results in a cubic polynomial). Explain why
there are two legitimate solutions. (b) For extra credit, solve
for the flow rates using the actual friction factors.
P6.44 Mercury at 20°C fl ows through 4 m of 7-mm-diameter
glass tubing at an average velocity of 5 m/s. Estimate the
head loss in m and the pressure drop in kPa.
Water
at 20° C
Turbine
Cast iron pipe
z1 = 35 m
z2 = 5 m
434 Chapter 6 Viscous Flow in Ducts
whi29346_ch06_346-455.qxd 11/4/09 10:41 Page 434 Debd 208:MHDQ176:whi29346:0073529346:whi29346_pagefiles:](https://image.slidesharecdn.com/white09-220921151844-e1802c93/75/Seven-edition-in-fluid-mechanics-White-650-2048.jpg)

![P6.55 The reservoirs in Fig. P6.55 contain water at 20°C. If the
pipe is smooth with L 4500 m and d 4 cm, what will
the flow rate in m3
/h be for z 100 m?
P6.55
P6.56 The Alaska Pipeline in the chapter-opener photo has a
design flow rate of 4.4E7 gallons per day of crude oil
at 60°C (see Fig. A.1). (a) Assuming a galvanized-iron
wall, estimate the total pressure drop required for the
800-mile trip. (b) If there are nine equally spaced
pumps, estimate the horsepower each pump must
deliver.
P6.57 Apply the analysis of Prob. P6.54 to the following data.
Let W 5 m, Y 8 m, ho 2 m, L 15 m, D 5 cm,
and
0. (a) By letting h 1.5 m and 0.5 m as repre-
sentative depths, estimate the average friction factor. Then
(b) estimate the time to drain the pool.
P6.58 For the system in Prob. 6.53, a pump is used at night to
drive water back to the upper reservoir. If the pump deliv-
ers 15,000 W to the water, estimate the flow rate.
P6.59 The following data were obtained for flow of 20°C water
at 20 m3
/h through a badly corroded 5-cm-diameter pipe
that slopes downward at an angle of 8°: p1 420 kPa, z1
12 m, p2 250 kPa, z2 3 m. Estimate (a) the rough-
ness ratio of the pipe and (b) the percentage change in
head loss if the pipe were smooth and the flow rate the
same.
P6.60 In the spirit of Haaland’s explicit pipe friction factor
approximation, Eq. (6.49), Jeppson [20] proposed the fol-
lowing explicit formula:
(a) Is this identical to Haaland’s formula with just a sim-
ple rearrangement? Explain. (b) Compare Jeppson’s for-
mula to Haaland’s for a few representative values of (tur-
bulent) Red and /d and their errors compared to the
Colebrook formula (6.48). Discuss briefly.
P6.61 What level h must be maintained in Fig. P6.61 to deliver
a flow rate of 0.015 ft3
/s through the -in commercial steel
pipe?
1
2
1
1f
2.0 log10 a
/d
3.7
5.74
Re0.9
d
b
1
2
B
L, D,
Δz
ε
P6.61
P6.62 Water at 20°C is to be pumped through 2000 ft of pipe from
reservoir 1 to 2 at a rate of 3 ft3
/s, as shown in Fig. P6.62.
If the pipe is cast iron of diameter 6 in and the pump is 75
percent efficient, what horsepower pump is needed?
P6.62
Flow rate and sizing problems
P6.63 A tank contains 1 m3
of water at 20°C and has a drawn-
capillary outlet tube at the bottom, as in Fig. P6.63. Find
the outlet volume flux Q in m3
/h at this instant.
P6.63
P6.64 For the system in Fig. P6.63, solve for the flow rate in
m3
/h if the fluid is SAE 10 oil at 20°C. Is the flow lam-
inar or turbulent?
Q
1 m 1 m3
L = 80 cm
D = 4 cm
Pump
L = 2000 ft
2
1
120 ft
Water
at 20°C
h
L = 80 ft
D =
1
2
in
436 Chapter 6 Viscous Flow in Ducts
EES
whi29346_ch06_346-455.qxd 11/4/09 10:41 Page 436 Debd 208:MHDQ176:whi29346:0073529346:whi29346_pagefiles:](https://image.slidesharecdn.com/white09-220921151844-e1802c93/75/Seven-edition-in-fluid-mechanics-White-652-2048.jpg)


![12 m long, as in Fig. P6.92. Estimate (a) the air flow rate
in m3
/h if the room pressure is 10 Pa vacuum and (b) the
room pressure if the flow rate is 1200 m3
/h. Neglect minor
losses.
P6.92
P6.93 In Moody’s Example 6.6, the 6-inch diameter, 200-ft-long
asphalted cast iron pipe has a pressure drop of about 280
lbf/ft2
when the average water velocity is 6 ft/s. Compare
this to an annular cast iron pipe with an inner diameter
of 6 in and the same annular average velocity of 6 ft/s.
(a) What outer diameter would cause the flow to have the
same pressure drop of 280 lbf/ft2
? (b) How do the cross-
section areas compare, and why? Use the hydraulic diam-
eter approximation.
P6.94 Air at 20°C flows through a smooth duct of diameter
20 cm at an average velocity of 5 m/s. It then flows into
a smooth square duct of side length a. Find the square
duct size a for which the pressure drop per meter will be
exactly the same as the circular duct?
P6.95 Although analytical solutions are available for laminar
flow in many duct shapes [34], what do we do about
ducts of arbitrary shape? Bahrami et al. [57] propose that
a better approach to the pipe result, fRe 64, is achieved
by replacing the hydraulic diameter Dh by , where A
is the area of the cross section. Test this idea for the
isosceles triangles of Table 6.4. If time is short, at least
try 10°, 50°, and 80°. What do you conclude about this
idea?
P6.96 A fuel cell [59] consists of air (or oxygen) and hydrogen
micro ducts, separated by a membrane that promotes pro-
ton exchange for an electric current, as in Fig. P6.96. Sup-
pose that the air side, at 20°C and approximately 1 atm,
has five 1 mm by 1 mm ducts, each 1 m long. The total
flow rate is 1.5E-4 kg/s. (a) Determine if the flow is lam-
inar or turbulent. (b) Estimate the pressure drop. (Prob-
lem courtesy of Dr. Pezhman Shirvanian.)
P6.97 A heat exchanger consists of multiple parallel-plate pas-
sages, as shown in Fig. P6.97. The available pressure
drop is 2 kPa, and the fluid is water at 20°C. If the
desired total flow rate is 900 m3
/h, estimate the appro-
priate number of passages. The plate walls are hydrauli-
cally smooth.
1A
12 m
Room
30 cm by 30 cm
patm
Fan
P6.96
P6.97
P6.98 A rectangular heat exchanger is to be divided into smaller
sections using sheets of commercial steel 0.4 mm thick, as
sketched in Fig. P6.98. The flow rate is 20 kg/s of water at
20°C. Basic dimensions are L 1 m, W 20 cm, and
H 10 cm. What is the proper number of square sections
if the overall pressure drop is to be no more than 1600 Pa?
P6.98
H
W
L
2 m
50 cm
50 cm
Flow
Anode Cathode
1 mm by 1 mm by 1m
PEM membrane
Hydrogen
flow
Air
flow
Problems 439
whi29346_ch06_346-455.qxd 11/9/09 7:44PM Page 439 ntt 208:MHDQ176:whi29346:0073529346:whi29346_pagefiles:](https://image.slidesharecdn.com/white09-220921151844-e1802c93/75/Seven-edition-in-fluid-mechanics-White-655-2048.jpg)


![448 Chapter 6 Viscous Flow in Ducts
P6.159 A modern venturi nozzle is tested in a laboratory flow with
water at 20°C. The pipe diameter is 5.5 cm, and the ven-
turi throat diameter is 3.5 cm. The flow rate is measured
by a weigh tank and the pressure drop by a water–mercury
manometer. The mass flow rate and manometer readings
are as follows:
, kg/s 0.95 1.98 2.99 5.06 8.15
h, mm 3.7 15.9 36.2 102.4 264.4
Use these data to plot a calibration curve of venturi dis-
charge coefficient versus Reynolds number. Compare with
the accepted correlation, Eq. (6.114).
Flowmeters: other designs
P6.160 An instrument popular in the beverage industry is the
target flowmeter in Fig. P6.160. A small flat disk is
mounted in the center of the pipe, supported by a strong
but thin rod. (a) Explain how the flowmeter works.
(b) If the bending moment M of the rod is measured at
the wall, derive a formula for the estimated velocity of
the flow. (c) List a few advantages and disadvantages of
such an instrument.
P6.160
P6.161 An instrument popular in the water supply industry,
sketched in Fig. P6.161, is the single jet water meter.
(a) How does it work? (b) What do you think a typical
calibration curve would look like? (c) Can you cite fur-
ther details, for example, reliability, head loss, cost
[58]?
Flow
ṁ
P6.161
Flowmeters: compressibility correction
P6.162 Air flows at high speed through a Herschel venturi moni-
tored by a mercury manometer, as shown in Fig. P6.162.
The upstream conditions are 150 kPa and 80°C. If h 37
cm, estimate the mass flow in kg/s. (Hint: The flow is
compressible.)
P6.162
P6.163 Modify Prob. P6.162 as follows. Find the manometer
reading h for which the mass flow through the venturi is
approximately 0.4 kg/s. (Hint: The flow is compressible.)
h
Air
D = 6 cm
d = 4 cm
Mercury
Word Problems
W6.1 In fully developed straight-duct flow, the velocity pro-
files do not change (why?), but the pressure drops
along the pipe axis. Thus there is pressure work done
on the fluid. If, say, the pipe is insulated from heat loss,
where does this energy go? Make a thermodynamic
analysis of the pipe flow.
W6.2 From the Moody chart (Fig. 6.13), rough surfaces,
such as sand grains or ragged machining, do not affect
laminar flow. Can you](https://image.slidesharecdn.com/white09-220921151844-e1802c93/75/Seven-edition-in-fluid-mechanics-White-664-2048.jpg)


![Geotechnical Engineering-I [Lec #19: Consolidation-III]](https://cdn.slidesharecdn.com/ss_thumbnails/19-180924141035-thumbnail.jpg?width=640&height=640&fit=bounds)


![Geotechnical Engineering-II [Lec #7: Soil Stresses due to External Load]](https://cdn.slidesharecdn.com/ss_thumbnails/7-180930132739-thumbnail.jpg?width=640&height=640&fit=bounds)
![Geotechnical Engineering-II [Lec #27: Infinite Slope Stability Analysis]](https://cdn.slidesharecdn.com/ss_thumbnails/27-181125070251-thumbnail.jpg?width=640&height=640&fit=bounds)


![Geotechnical Engineering-II [Lec #26: Slope Stability]](https://cdn.slidesharecdn.com/ss_thumbnails/26-181125070353-thumbnail.jpg?width=640&height=640&fit=bounds)