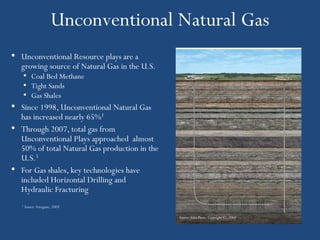
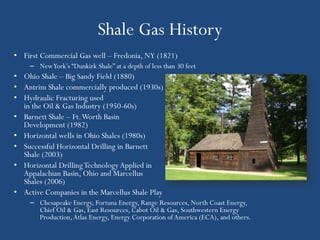
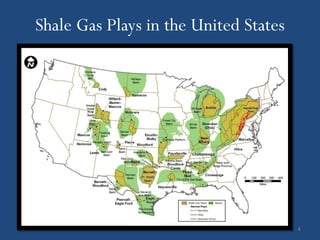
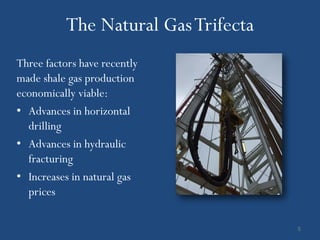
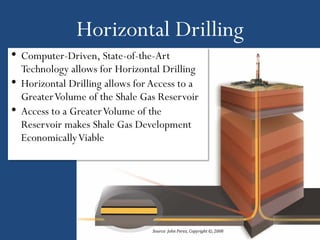
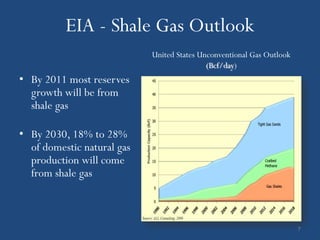
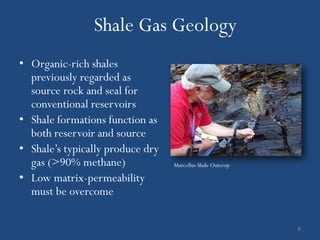
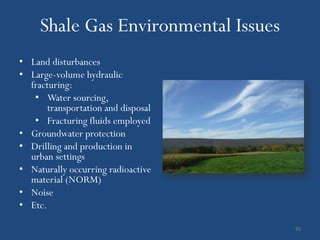
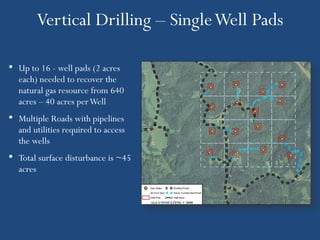
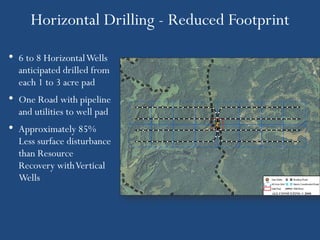
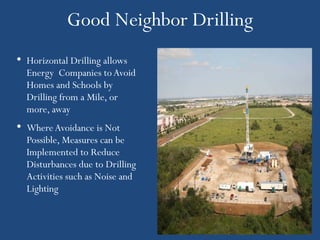
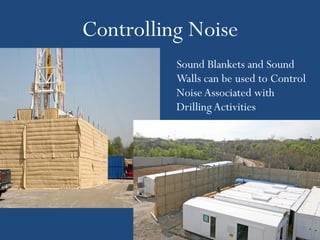
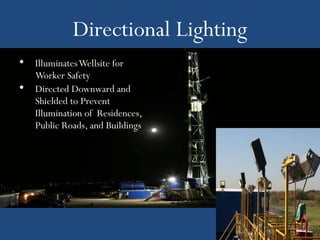
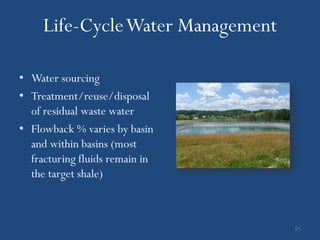
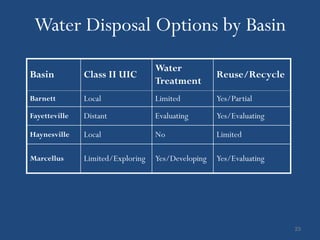
Microsoft powerpoint managing environmental risk in investing in shale plays
Modern Shale Gas Development
1. Modern Shale Gas Development
Presented by:
J. Daniel Arthur, P.E. ALL Consulting
Presented at:
Oklahoma Independent Petroleum Association
Mid-Continent CBM & Shale Gas Symposium
December 8, 2009
Tulsa, Oklahoma
1
3. Shale Gas History
• First Commercial Gas well – Fredonia, NY (1821)
– New York’s “Dunkirk Shale” at a depth of less than 30 feet
• Ohio Shale – Big Sandy Field (1880)
• Antrim Shale commercially produced (1930s)
• Hydraulic Fracturing used
in the Oil & Gas Industry (1950-60s)
• Barnett Shale – Ft. Worth Basin
Development (1982)
• Horizontal wells in Ohio Shales (1980s)
• Successful Horizontal Drilling in Barnett
Shale (2003)
• Horizontal Drilling Technology Applied in
Appalachian Basin, Ohio and Marcellus
Shales (2006)
• Active Companies in the Marcellus Shale Play
– Chesapeake Energy, Fortuna Energy, Range Resources, North Coast Energy,
Chief Oil & Gas, East Resources, Cabot Oil & Gas, Southwestern Energy
Production, Atlas Energy, Energy Corporation of America (ECA), and others.
5. The Natural Gas Trifecta
Three factors have recently
made shale gas production
economically viable:
• Advances in horizontal
drilling
• Advances in hydraulic
fracturing
• Increases in natural gas
prices
5
7. EIA - Shale Gas Outlook
United States Unconventional Gas Outlook
(Bcf/day)
• By 2011 most reserves
growth will be from
shale gas
• By 2030, 18% to 28%
of domestic natural gas
production will come
from shale gas
7
8. Shale Gas Geology
• Organic-rich shales
previously regarded as
source rock and seal for
conventional reservoirs
• Shale formations function as
both reservoir and source
• Shale’s typically produce dry
gas (>90% methane) Marcellus Shale Outcrop
• Low matrix-permeability
must be overcome
8
9. Data Comparison of Shale Plays
Gas Shale Basin Barnett Marcellus Fayetteville Haynesville
Est. Arial Extent (sq. mi.) 5,000 95,000 9,000 9,000
Depth (feet) 6500-9500 4,000-8,500 1,000-7,000 10,500-13,500
Net Thickness (feet) 100-600 50-200 20-200 200
BTW (feet) ~1200 ~850 ~500 ~400
TOC, % 4.5 3-12 4.0-9.8
Total Porosity, % 4-5 2-8
Gas Content, scf/ton 300-350 60-220
Water Production (BWPD) 0
Well spacing (Acres) 60-160 40-160 40-560
Gas-In-Place (TCF) 327 1500 52 717
Reserves (TCF) 44 262-500 41.6 251
Est. Gas Production (mcf/day/well) 338 3,100 530 625-1800
10. Shale Gas Environmental Issues
• Land disturbances
• Large-volume hydraulic
fracturing:
• Water sourcing,
transportation and disposal
• Fracturing fluids employed
• Groundwater protection
• Drilling and production in
urban settings
• Naturally occurring radioactive
material (NORM)
• Noise
• Etc.
10
11. Vertical Drilling – Single Well Pads
• Up to 16 - well pads (2 acres
each) needed to recover the
natural gas resource from 640
acres – 40 acres per Well
• Multiple Roads with pipelines
and utilities required to access
the wells
• Total surface disturbance is ~45
acres
12. Horizontal Drilling - Reduced Footprint
• 6 to 8 Horizontal Wells
anticipated drilled from
each 1 to 3 acre pad
• One Road with pipeline
and utilities to well pad
• Approximately 85%
Less surface disturbance
than Resource
Recovery with Vertical
Wells
13. Good Neighbor Drilling
• Horizontal Drilling allows
Energy Companies to Avoid
Homes and Schools by
Drilling from a Mile, or
more, away
• Where Avoidance is Not
Possible, Measures can be
Implemented to Reduce
Disturbances due to Drilling
Activities such as Noise and
Lighting
14. Controlling Noise
Sound Blankets and Sound
Walls can be used to Control
Noise Associated with
Drilling Activities
15. Directional Lighting
• Illuminates Wellsite for
Worker Safety
• Directed Downward and
Shielded to Prevent
Illumination of Residences,
Public Roads, and Buildings
16. Hydraulic Fracturing
• Necessary due to low
matrix permeability
• Fractures created must
remain in the target zone
• Fracturing out of the target
zone is not cost effective:
– Adds extra cost to
stimulation job
– Could adversely affect
productivity of the well
16
17. Pre-Fracturing Evaluations
• Geology & lithology
• Coring and core analysis
• Geophysical logging
• 3D Seismic
• Correlation Analysis
• Fracture gradient analysis
• Etc.
17
18. Optimizing Hydraulic Fracturing
• Process is optimized
for each new play
based on feedback
from new wells
influencing:
– Modeling of
stimulations
– Monitoring
– Effective Example Output of a Hydraulic Fracture Stimulation Model.
Source: Chesapeake Energy Corporation.
treatment
18
19. Fracture Fluids
• 98-99.5% of slickwater
fracturing fluid is water
• Each additive has an
engineered purpose
• And proppant (sand)
19
20. Fracture Fluid Additives
Volumetric Composition of a Fracture Fluid
Source: ALL Consulting 2008.
20
21. Life-Cycle Water Management
• Water sourcing
• Treatment/reuse/disposal
of residual waste water
• Flowback % varies by basin
and within basins (most
fracturing fluids remain in
the target shale)
21
22. Total Water Use – 4 Major Shale Plays
Total Water
Industrial
Public Power Shale Gas Use
Shale Play and Irrigation Livestock
Supply Generation Wells (Billion
Mining
Bbl/yr)
82.70% 4.50% 3.70% 6.30% 2.30% 0.40% 11.15
Barnett
2.30% 1.10% 33.30% 62.90% 0.30% 0.10% 31.9
Fayetteville
45.90% 27.20% 13.50% 8.50% 4.00% 0.80% 2.15
Haynesville
11.97% 16.13% 71.70% 0.12% 0.01% 0.06% 85
Marcellus
22
23. Water Disposal Options by Basin
Water
Basin Class II UIC Reuse/Recycle
Treatment
Barnett Local Limited Yes/Partial
Fayetteville Distant Evaluating Yes/Evaluating
Haynesville Local No Limited
Marcellus Limited/Exploring Yes/Developing Yes/Evaluating
23
24. Produced Water- UIC Disposal Options
• Class II UIC wells are the primary means for management
of produced water from gas shales
• In areas new to O&G development, existing commercial
SWD wells may not yet be available
• Some areas (e.g. the Marcellus & Fayetteville shale plays) are
geologically challenged with limited available injection
zones
• Some areas take considerable time to get permits
− New York & Pennsylvania
24
25. Produced Water Treatment Options
• Distillation/ Evaporation
– To concentrated brine
– To crystalline salts
• Reverse osmosis
• Treatment and recycling
25
26. Treatment Option Limitations
• All approaches have limitations, primarily:
– Quality and quantity of water that can be treated
– Waste volumes and management:
› Concentrated brine from D/E and RO
› Salt crystal from D/E
– Economic viability
• Generally, as the TDS of the produced water increases, the
volume of useable treated water decreases and waste
increases
26
27. Produced Water Treatment and Reuse
• Many operators and service
companies now considering
viability of partially treating
flowback water sufficient for
reuse in the next fracture job
• Controlling factors may
include:
– TDS
– Scale producing sulfates
– Chemical requirements
of next fracture job
27
28. Benefits of Treatment and Reuse
• Reduces treatment costs
compared to that required
for more demanding uses
• Reduces volume requiring
disposal and hence costs
• Reduces water sourcing
and transportation
demands
28
29. Groundwater Protection
• The target zone fractured Christmas Pipeline to
Flow Process
Tree
is separated from USDWs Surface
and Storage
by considerable vertical Cement
Casing
Intermediate
thickness (thousands of Cement
Casing
feet) of confining strata Tubing
Production
Casing
• Further protection is
Cement
provided by multiple Oil or Gas Zone
Well
casing strings and cement Fluids Perforations
Vertical Producing Well
29
30. Naturally Occurring Radioactive Materials (NORM)
• Shales naturally contain low
levels of NORM
• NORM generally remains in
drill cuttings or scale
• Radiation levels are low
(these are not NRC levels of
exposure)
• Pose little practical risk to
general public who normally
would not be exposed to
oilfield equipment for
extended periods of time
30