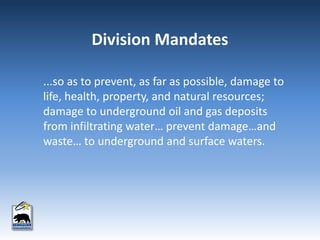
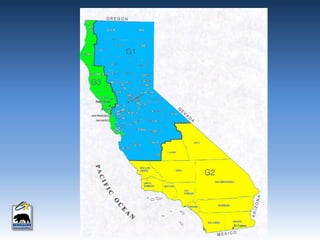
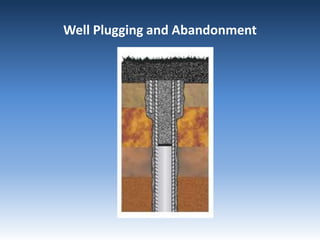
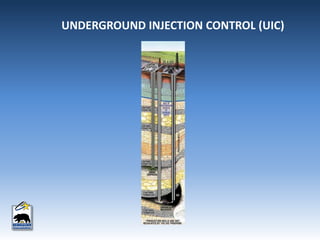
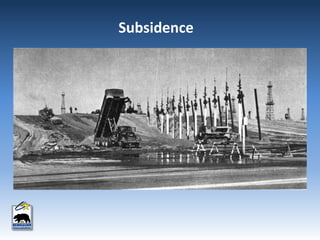
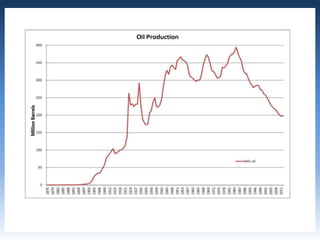
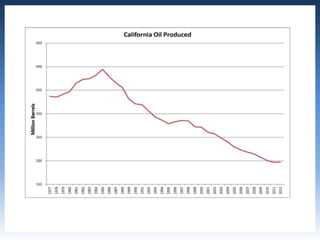
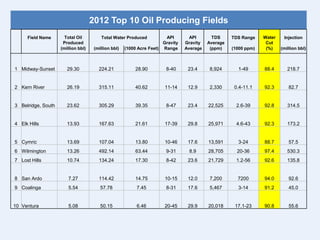
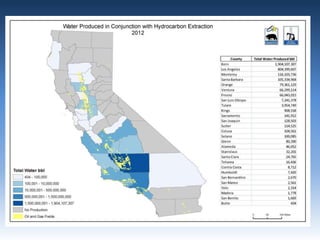
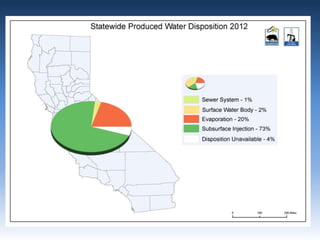
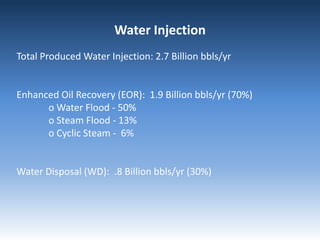
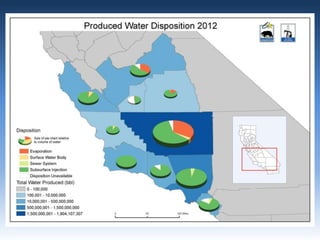
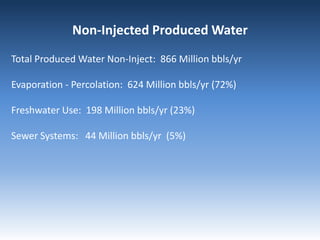
An Overview of California’s
Produced Water
Tim Kustic, State Oil and Gas Supervisor
California Division of Oil, Gas, and Geothermal Resources
Organizational Structure
 Governor’s Office
 Natural Resources Agency
 Department of Conservation
 Division of Oil, Gas, and Geothermal
Resources
…Supervisor shall so supervise the drilling,
operation, maintenance, and abandonment
of wells and the operation, maintenance, and
removal or abandonment of tanks and
facilities…
Division Mandates
...so as to prevent, as far as possible, damage to
life, health, property, and natural resources;
damage to underground oil and gas deposits
from infiltrating water… prevent damage…and
waste… to underground and surface waters.
Division Mandates
…Supervisor shall also supervise… to permit the
owners… to utilize all methods… and practices
known to the industry for the purpose of increasing
the ultimate recovery.
Division Mandates
To best meet oil and gas needs in this state, the
Supervisor shall administer this division so as to
encourage the wise development of oil and gas
resources.
Division Mandates
CA Oil porduction
Well Construction
Well Plugging and Abandonment
UNDERGROUND INJECTION CONTROL (UIC)
Subsidence
2012 Top 10 Oil Producing Fields
Field Name Total Oil
Produced
Total Water Produced API
Gravity
API
Gravity
TDS
Average
TDS Range Water
Cut
Injection
(million bbl) (million bbl) (1000 Acre Feet) Range Average (ppm) (1000 ppm) (%) (million bbl)
1 Midway-Sunset 29.30 224.21 28.90 8-40 23.4 8,924 1-49 88.4 218.7
2 Kern River 26.19 315.11 40.62 11-14 12.9 2,330 0.4-11.1 92.3 82.7
3 Belridge, South 23.62 305.29 39.35 8-47 23.4 22,525 2.6-39 92.8 314.5
4 Elk Hills 13.93 167.63 21.61 17-39 29.8 25,971 4.6-43 92.3 173.2
5 Cymric 13.69 107.04 13.80 10-46 17.6 13,591 3-24 88.7 57.5
6 Wilmington 13.26 492.14 63.44 9-31 8.9 28,705 20-36 97.4 530.3
7 Lost Hills 10.74 134.24 17.30 8-42 23.6 21,729 1.2-56 92.6 135.8
8 San Ardo 7.27 114.42 14.75 10-15 12.0 7,200 7200 94.0 92.6
9 Coalinga 5.54 57.78 7.45 8-31 17.6 5,467 3-14 91.2 45.0
10 Ventura 5.08 50.15 6.46 20-45 29.9 20,018 17.1-23 90.8 55.6
Water Injection
Total Produced Water Injection: 2.7 Billion bbls/yr
Enhanced Oil Recovery (EOR): 1.9 Billion bbls/yr (70%)
o Water Flood - 50%
o Steam Flood - 13%
o Cyclic Steam - 6%
Water Disposal (WD): .8 Billion bbls/yr (30%)
Non-Injected Produced Water
Total Produced Water Non-Inject: 866 Million bbls/yr
Evaporation - Percolation: 624 Million bbls/yr (72%)
Freshwater Use: 198 Million bbls/yr (23%)
Sewer Systems: 44 Million bbls/yr (5%)
Arroyo Grande Oilfield, San Luis Obispo County
HYDRAULIC FRACTURE STIMULATION
www.conservation.ca.gov

Produced Water | Session V - Tim Kustic

  • 2.
    An Overview ofCalifornia’s Produced Water Tim Kustic, State Oil and Gas Supervisor California Division of Oil, Gas, and Geothermal Resources
  • 3.
    Organizational Structure  Governor’sOffice  Natural Resources Agency  Department of Conservation  Division of Oil, Gas, and Geothermal Resources
  • 4.
    …Supervisor shall sosupervise the drilling, operation, maintenance, and abandonment of wells and the operation, maintenance, and removal or abandonment of tanks and facilities… Division Mandates
  • 5.
    ...so as toprevent, as far as possible, damage to life, health, property, and natural resources; damage to underground oil and gas deposits from infiltrating water… prevent damage…and waste… to underground and surface waters. Division Mandates
  • 6.
    …Supervisor shall alsosupervise… to permit the owners… to utilize all methods… and practices known to the industry for the purpose of increasing the ultimate recovery. Division Mandates
  • 7.
    To best meetoil and gas needs in this state, the Supervisor shall administer this division so as to encourage the wise development of oil and gas resources. Division Mandates
  • 8.
  • 13.
  • 14.
    Well Plugging andAbandonment
  • 24.
  • 25.
  • 29.
    2012 Top 10Oil Producing Fields Field Name Total Oil Produced Total Water Produced API Gravity API Gravity TDS Average TDS Range Water Cut Injection (million bbl) (million bbl) (1000 Acre Feet) Range Average (ppm) (1000 ppm) (%) (million bbl) 1 Midway-Sunset 29.30 224.21 28.90 8-40 23.4 8,924 1-49 88.4 218.7 2 Kern River 26.19 315.11 40.62 11-14 12.9 2,330 0.4-11.1 92.3 82.7 3 Belridge, South 23.62 305.29 39.35 8-47 23.4 22,525 2.6-39 92.8 314.5 4 Elk Hills 13.93 167.63 21.61 17-39 29.8 25,971 4.6-43 92.3 173.2 5 Cymric 13.69 107.04 13.80 10-46 17.6 13,591 3-24 88.7 57.5 6 Wilmington 13.26 492.14 63.44 9-31 8.9 28,705 20-36 97.4 530.3 7 Lost Hills 10.74 134.24 17.30 8-42 23.6 21,729 1.2-56 92.6 135.8 8 San Ardo 7.27 114.42 14.75 10-15 12.0 7,200 7200 94.0 92.6 9 Coalinga 5.54 57.78 7.45 8-31 17.6 5,467 3-14 91.2 45.0 10 Ventura 5.08 50.15 6.46 20-45 29.9 20,018 17.1-23 90.8 55.6
  • 32.
    Water Injection Total ProducedWater Injection: 2.7 Billion bbls/yr Enhanced Oil Recovery (EOR): 1.9 Billion bbls/yr (70%) o Water Flood - 50% o Steam Flood - 13% o Cyclic Steam - 6% Water Disposal (WD): .8 Billion bbls/yr (30%)
  • 34.
    Non-Injected Produced Water TotalProduced Water Non-Inject: 866 Million bbls/yr Evaporation - Percolation: 624 Million bbls/yr (72%) Freshwater Use: 198 Million bbls/yr (23%) Sewer Systems: 44 Million bbls/yr (5%)
  • 39.
    Arroyo Grande Oilfield,San Luis Obispo County
  • 40.
  • 44.

Editor's Notes

  • #5 Body of regulations to supervise/regulate industryGeothermal too
  • #6 The why – protect the environment
  • #7 ALSO allow innovation to produce natural resources
  • #8 The dual role supervise and encourageFirst annual report statement
  • #10 Energy and Environment - First environmental actions – not regulation but case lawHM - 1850
  • #11 Original challenge
  • #13 OFFSHORE Next
  • #17 1880’s
  • #18 Urban issuesBack when most folks wanted an oilwellSubsurface issues
  • #19 Urban Challenges
  • #20 Urban Challenges
  • #21 Urban oilfield operations
  • #25 Largest single program3 billion bbls / year injectedPrimacy since 198340,000 wells
  • #26 SubsidenceProduced water is not waste water.Operators buy 30 million bbls/yr
  • #27 1985 Peak
  • #29 Water cut about 90%
  • #33 EOR is recycle for beneficial use~13 % in make-up water
  • #34 Perc-Evp pondsSurface
  • #35 EOR is recycle for beneficial use
  • #37 San Ardo / Arroyo Grande
  • #39 San Ardo / Arroyo Grande
  • #41 Since 1950, for Oil in tight formationsAverage water <200,000 galFlowback ~.09% of all injected fluid.Flowback – is Class II – into existing wells. Total HF fluid is .09% of ~3 billion bbls annually injected.
  • #42 Green energy Power SF
  • #43 Geothermal Fishing Job
  • #44 Green energy Power SF
  • #45 Oil here v. import – cost/ emissions to import - regulation at foreign extraction sites2012 slight increase – first since mid 1980’s - more holes in old fields – sustained high prices – not HFEncourage the wise development of the resources for the citizens of CACan put down the mic w/o mentioning we are hiring - please stop by our booth for more information