Download as PDF, PPTX

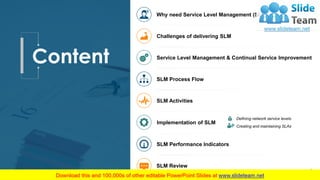


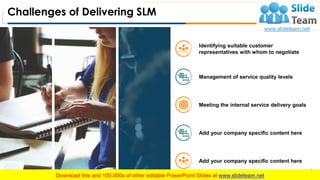

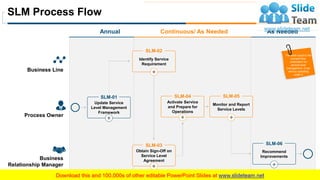
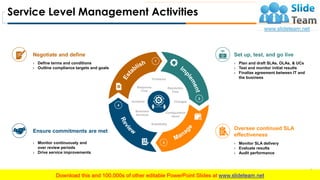


The document outlines the importance and process of Service Level Management (SLM), focusing on improving service delivery, client satisfaction, and competitive differentiation. It discusses the challenges in implementing SLM, such as identifying customer representatives and maintaining service quality, and provides a structured approach for defining Service Level Agreements (SLAs) and managing performance indicators. The document emphasizes continual service improvement, defining network service levels, and the necessary steps for successful SLM implementation.


