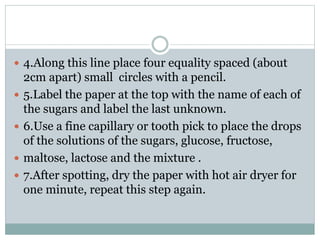
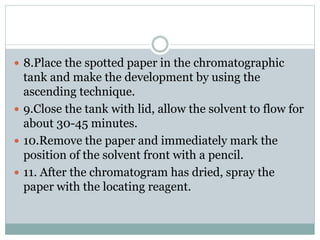
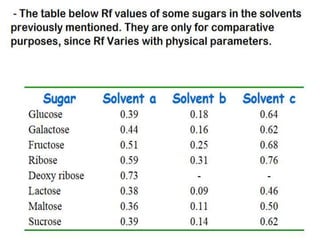
1. THE TERM CHROMATOGRAPHY COMES FROM THE EARLIER
TIMES WHEN THE TECHNIQUE WAS USED FOR THE
SEPARATION OF COLORED PLANTS PIGMENTS.
CHROMATOGRAPHY IS A TECHNIQUE FOR SEPARATION OF
CLOSELY RELATED GROUPS OF COMPOUNDS. THE
SEPARATION IS BROUGHT ABOUT BY DIFFERENTIAL
MIGRATION ALONG A POROUS MEDIUM AND THE
MIGRATION IS CAUSED BY THE FLOW OF SOLVENT.
Separation of sugar through
paper Chromatography
2. Material
Paper:
filter paper is used because of its known
Solvents:
(A) Water –saturated phenol +1% ammonia
(b) n-butanol-acetic acid-water(4:1:5v/v)
( C) isopropanol-pyridine-water-acetic acid(8:8 4:1 v/v)
4. Procedure
1.Place sufficient solvent into the bottom of the tank.
Cover the led and allow the tank to be saturated with
the solvent.
2.Take a sheet of Whatman 1 chromatography paper
(about 9 x 10 cm) and place it on a piece of clean
paper on a bench.
3. Draw a fine line with a pencil along the width of
the paper and about
1.5cm from the lower edge.
5. 4.Along this line place four equality spaced (about
2cm apart) small circles with a pencil.
5.Label the paper at the top with the name of each of
the sugars and label the last unknown.
6.Use a fine capillary or tooth pick to place the drops
of the solutions of the sugars, glucose, fructose,
maltose, lactose and the mixture .
7.After spotting, dry the paper with hot air dryer for
one minute, repeat this step again.
6. 8.Place the spotted paper in the chromatographic
tank and make the development by using the
ascending technique.
9.Close the tank with lid, allow the solvent to flow for
about 30-45 minutes.
10.Remove the paper and immediately mark the
position of the solvent front with a pencil.
11. After the chromatogram has dried, spray the
paper with the locating reagent.
7. 12.you need to put the paper on the hot plate at low
temperature or expose it to the hot air dryer, until
the colored spots appear. the colors are stable for
some weeks if kept in the dark and away from acid
vapors.
13. Circle the position of each spot with pencil.
8. 14. Calculate the Rf value for each spot and also for the spots the mixture
contained.
9.
10. Results Sheet
1- Draw a sketch of your chromatogram.
2-Calculate Rf values for each spot of the mixture
being separated.
3-By comparing the Rf values of the mixture along
with those for the standards, state what sugars does
this mixture contain?