Downloaded 148 times
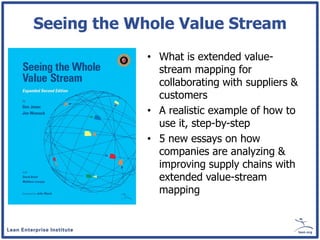
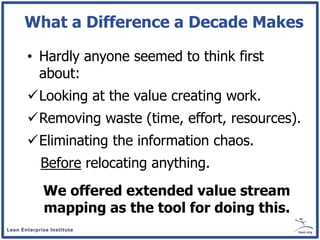
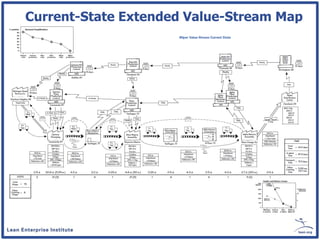
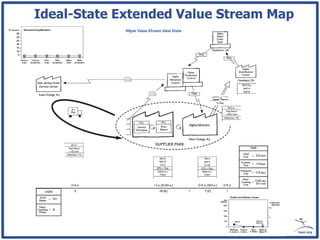
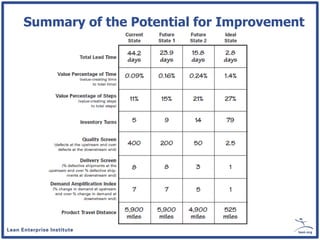
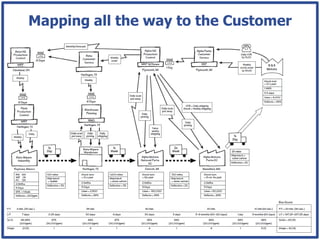
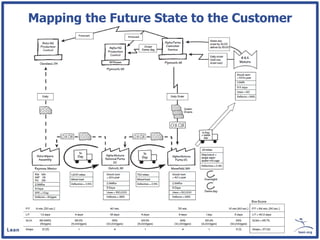
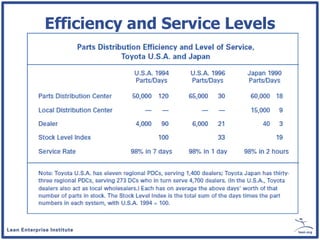
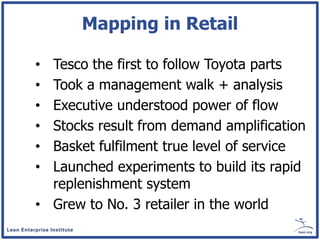
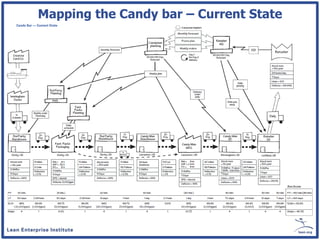
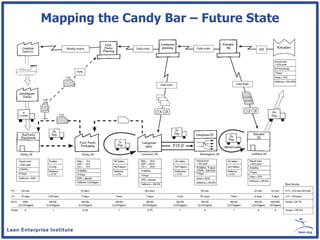
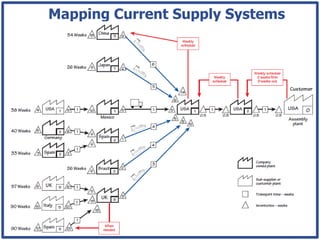
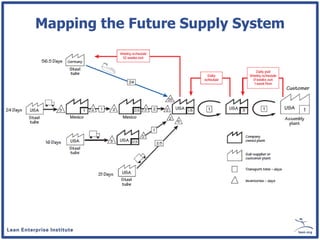
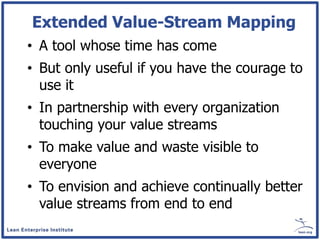
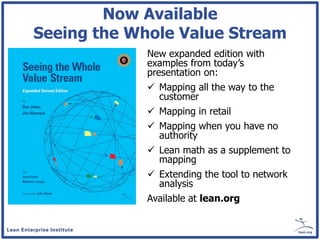

This document discusses using extended value stream mapping as a tool for analyzing and improving supply chains. It provides examples of how companies like Toyota and Tesco have used this approach to map their entire value streams from raw materials to the customer. The document also discusses mapping when you don't have authority over the entire supply chain, using lean math to supplement mapping, and a new book on extending value stream mapping is now available.


![The Toyota Way (Toyota Production System) [Operations Management]](https://cdn.slidesharecdn.com/ss_thumbnails/om-150830140656-lva1-app6892-thumbnail.jpg?width=640&height=640&fit=bounds)


