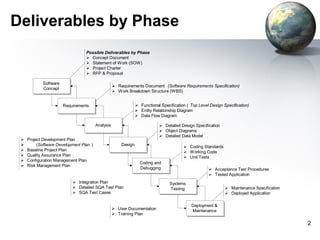
This document outlines deliverables that may be produced at different phases of a software development project. It lists possible deliverables for phases including concept, requirements, analysis, design, coding and debugging, testing, deployment, and maintenance. For each phase, the document provides brief descriptions of the types of documents or work products that could be delivered, such as requirements specifications, design documents, test plans, code, and user documentation.
Track Keynote for the Requirements Definition & Management Track at the IBM Rational Software Conference 2009
Requirements Definition and Management encompasses all of the activities that revolve around eliciting, defining, elaborating, understanding, organizing, reviewing, and communicating business, user, and software requirements, as well as defining solutions based on those business goals and objectives. These activities are done because they help ensure that the applications that are developed solve the real business and customer problems. This track explores the experiences of organizations with tools, techniques, and processes used to effectively define and manage requirements and analyze systems. Analysts, architects, developers, project managers, and others interested in methodology and tools for defining, managing, and analyzing requirements should attend this track.
Yoxel Project Management Portal is an integrated project management portal solution that provides new generation of collaborative tools for adaptive product and project management.
Calen Legaspi, O&B CEO, discusses a quick overview of Agile Software Development for the absolute beginner.
About O&B:
Orange & Bronze is a proponent of Agile Software Development. We believe that software development requires a collaborative environment where the software can start and evolve into a useful and strategic system. A common vision between O&B and the client is essential to have an effective collaborative environment. This, along with constant communication and repeated testing, ensures that the project will be delivered on time, all the time.
Orange & Bronze is an offshore product and software development firm in the Philippines, is one of the first companies in Asia to use and advocate Agile Software Development, and has been using it since our inception in 2005, back when Agile was still an emerging movement. O&B offers training courses for Agile with Scrum and XP - these classes were developed and are taught by some of the Philippines' well-known and respected Agile / Scrum coaches and practitioners, and uses the format trusted by some of the best companies in the Philippines.
الإتحــــــــــــــــــــــاد الوطني للشبــــــــــاب السوداني
المؤسسة الشبابية لتقانة المعلومات
ورشة صناعة البرمجيات في السودان
الورقة الاولى :
مناهج التعليم وصناعة البرمجيات في السودان
أسامة عبدالوهاب ريس
Process Implementation - The Project Begin with the definitional of Process and the organizational framework. In this case, it is possible to provide very concrete instructions, as this project phase allows itself to be extensively standardized. Project Management is the application of skills, knowledge, tools and techniques to meet the needs and expectations of stakeholders for a project.
We had this presentation running on one of the screens in our booth at the April 4, 2013, Innotech Dallas/SharePoint TechFest. We have been excited by the developments in the latest release of Visual Studio and it's ability to work seamlessly with Microsoft's Azure.
We all have good and bad thoughts from time to time and situation to situation. We are bombarded daily with spiraling thoughts(both negative and positive) creating all-consuming feel , making us difficult to manage with associated suffering. Good thoughts are like our Mob Signal (Positive thought) amidst noise(negative thought) in the atmosphere. Negative thoughts like noise outweigh positive thoughts. These thoughts often create unwanted confusion, trouble, stress and frustration in our mind as well as chaos in our physical world. Negative thoughts are also known as “distorted thinking”.
The Indian economy is classified into different sectors to simplify the analysis and understanding of economic activities. For Class 10, it's essential to grasp the sectors of the Indian economy, understand their characteristics, and recognize their importance. This guide will provide detailed notes on the Sectors of the Indian Economy Class 10, using specific long-tail keywords to enhance comprehension.
For more information, visit-www.vavaclasses.com
The French Revolution, which began in 1789, was a period of radical social and political upheaval in France. It marked the decline of absolute monarchies, the rise of secular and democratic republics, and the eventual rise of Napoleon Bonaparte. This revolutionary period is crucial in understanding the transition from feudalism to modernity in Europe.
For more information, visit-www.vavaclasses.com
How to Create Map Views in the Odoo 17 ERPCeline George
The map views are useful for providing a geographical representation of data. They allow users to visualize and analyze the data in a more intuitive manner.
Operation “Blue Star” is the only event in the history of Independent India where the state went into war with its own people. Even after about 40 years it is not clear if it was culmination of states anger over people of the region, a political game of power or start of dictatorial chapter in the democratic setup.
The people of Punjab felt alienated from main stream due to denial of their just demands during a long democratic struggle since independence. As it happen all over the word, it led to militant struggle with great loss of lives of military, police and civilian personnel. Killing of Indira Gandhi and massacre of innocent Sikhs in Delhi and other India cities was also associated with this movement.
The Roman Empire A Historical Colossus.pdfkaushalkr1407
The Roman Empire, a vast and enduring power, stands as one of history's most remarkable civilizations, leaving an indelible imprint on the world. It emerged from the Roman Republic, transitioning into an imperial powerhouse under the leadership of Augustus Caesar in 27 BCE. This transformation marked the beginning of an era defined by unprecedented territorial expansion, architectural marvels, and profound cultural influence.
The empire's roots lie in the city of Rome, founded, according to legend, by Romulus in 753 BCE. Over centuries, Rome evolved from a small settlement to a formidable republic, characterized by a complex political system with elected officials and checks on power. However, internal strife, class conflicts, and military ambitions paved the way for the end of the Republic. Julius Caesar’s dictatorship and subsequent assassination in 44 BCE created a power vacuum, leading to a civil war. Octavian, later Augustus, emerged victorious, heralding the Roman Empire’s birth.
Under Augustus, the empire experienced the Pax Romana, a 200-year period of relative peace and stability. Augustus reformed the military, established efficient administrative systems, and initiated grand construction projects. The empire's borders expanded, encompassing territories from Britain to Egypt and from Spain to the Euphrates. Roman legions, renowned for their discipline and engineering prowess, secured and maintained these vast territories, building roads, fortifications, and cities that facilitated control and integration.
The Roman Empire’s society was hierarchical, with a rigid class system. At the top were the patricians, wealthy elites who held significant political power. Below them were the plebeians, free citizens with limited political influence, and the vast numbers of slaves who formed the backbone of the economy. The family unit was central, governed by the paterfamilias, the male head who held absolute authority.
Culturally, the Romans were eclectic, absorbing and adapting elements from the civilizations they encountered, particularly the Greeks. Roman art, literature, and philosophy reflected this synthesis, creating a rich cultural tapestry. Latin, the Roman language, became the lingua franca of the Western world, influencing numerous modern languages.
Roman architecture and engineering achievements were monumental. They perfected the arch, vault, and dome, constructing enduring structures like the Colosseum, Pantheon, and aqueducts. These engineering marvels not only showcased Roman ingenuity but also served practical purposes, from public entertainment to water supply.
2. Deliverables by Phase
Possible Deliverables by Phase
Concept Document
Statement of Work (SOW)
Project Charter
RFP & Proposal
Software
Requirements Document (Software Requirements Specification)
Concept
Work Breakdown Structure (WBS)
Requirements Functional Specification ( Top Level Design Specification)
Entity Relationship Diagram
Data Flow Diagram
Analysis Detailed Design Specification
Object Diagrams
Detailed Data Model
Project Development Plan
(Software Development Plan ) Design Coding Standards
Baseline Project Plan Working Code
Quality Assurance Plan Unit Tests
Configuration Management Plan
Coding and
Risk Management Plan
Debugging Acceptance Test Procedures
Tested Application
Integration Plan Systems
Detailed SQA Test Plan Testing Maintenance Specification
SQA Test Cases Deployed Application
Deployment &
User Documentation Maintenance
Training Plan
2
3. Risk management
Risk management is concerned with identifying
risks and drawing up plans to minimise their
effect on a project.
A risk is a probability that some adverse
circumstance will occur.
Project risks affect schedule or resources
Product risks affect the quality or performance of the
software being developed
Business risks affect the organisation developing or
procuring the software
4. Software risks
Risk Risk type Description
Staff turnover Project Experienced staff will leave the
project before it is finished.
Management change Project There will be a change of
organisational management with
different priorities.
Hardware unavailability Project Hardware which is essential for the
project will not be delivered on
schedule.
Requirements change Project and There will be a larger number of
product changes to the requirements than
anticipated.
Specification delays Project and Specifications of essential interfaces
product are not available on schedule
Size underestimate Project and The size of the system has been
product underestimated.
CASE tool under- Product CASE tools which support the
performance project do not perform as anticipated
Technology change Business The underlying technology on which
the system is built is superseded by
new technology.
Product competition Business A competitive product is marketed
before the system is completed.
5. The Risk Management Process
• Risk identification
– Identify project, product and business risks
• Risk analysis
– Assess the likelihood and consequences of these
risks
• Risk planning
– Draw up plans to avoid or minimise the effects of
the risk
• Risk monitoring
– Monitor the risks throughout the project
6. The risk management process
Risk Risk analysis Risk planning Risk
identification monitoring
List of potential Risk avoidance Risk
Prioritised risk and contingency
risks list assessment
plans
8. Risks and risk types
Risk type Possible risks
Technology The database used in the system cannot process as many
transactions per second as expected.
Software components which should be reused contain defects
which limit their functionality.
People It is impossible to recruit staff with the skills required.
Key staff are ill and unavailable at critical times.
Required training for staff is not available.
Organisational The organisation is restructured so that different management
are responsible for the project.
Organisational financial problems force reductions in the project
budget.
Tools The code generated by CASE tools is inefficient.
CASE tools cannot be integrated.
Requirements Changes to requirements which require major design rework are
proposed.
Customers fail to understand the impact of requirements
changes.
Estimation The time required to develop the software is underestimated.
The rate of defect repair is underestimated.
The size of the software is underestimated.
9. Risk analysis
• Assess probability and seriousness of each risk
• Probability may be
– very low
– low
– moderate
– high or very high
• Risk effects might be
– catastrophic
– serious
– Tolerable
– insignificant
10. Risk analysis
Risk Probability Effects
Organisational financial problems force reductions Low Catastrophic
in the project budget.
It is impossible to recruit staff with the skills High Catastrophic
required for the project.
Key staff are ill at critical times in the project. Moderate Serious
Software components which should be reused Moderate Serious
contain defects which limit their functionality.
Changes to requirements which require major Moderate Serious
design rework are proposed.
The organisation is restructured so that different High Serious
management are responsible for the project.
The database used in the system cannot process as Moderate Serious
many transactions per second as expected.
The time required to develop the software is High Serious
underestimated.
CASE tools cannot be integrated. High Tolerable
Customers fail to understand the impact of Moderate Tolerable
requirements changes.
Required training for staff is not available. Moderate Tolerable
The rate of defect repair is underestimated. Moderate Tolerable
The size of the software is underestimated. High Tolerable
The code generated by CASE tools is inefficient. Moderate Insignificant
11. Risk planning
Consider each risk and develop a strategy to
manage that risk
Avoidance strategies
The probability that the risk will arise is reduced
Minimisation strategies
The impact of the risk on the project or product will
be reduced
Contingency plans
If the risk arises, contingency plans are plans to
deal with that risk
12. Risk management strategies
Risk Strategy
Organisational Prepare a briefing document for senior management showing
financial problems how the project is making a very important contribution to the
goals of the business.
Recruitment Alert customer of potential difficulties and the possibility of
problems delays, investigate buying-in components.
Staff illness Reorganise team so that there is more overlap of work and
people therefore understand each other’s jobs.
Defective Replace potentially defective components with bought-in
components components of known reliability.
Requirements Derive traceability information to assess requirements change
changes impact, maximise information hiding in the design.
Organisational Prepare a briefing document for senior management showing
restructuring how the project is making a very important contribution to the
goals of the business.
Database Investigate the possibilit y of buying a higher-performance
performance database.
Underestimated Investigate buying in components, investigate use of a program
development time generator.
13. Risk monitoring
• Assess each identified risks regularly to
decide whether or not it is becoming less or
more probable
• Also assess whether the effects of the risk
have changed
• Each key risk should be discussed at
management progress meetings
14. Risk factors
Risk type Potential indicators
Technology Late delivery of hardware or support software, many
reported technology problems
People Poor staff morale, poor relationships amongst team
member, job availability
Organisational organisational gossip, lack of action by senior
management
Tools reluctance by team members to use tools, complaints
about CASE tools, demands for higher-powered
workstations
Requirements many requirements change requests, customer
complaints
Estimation failure to meet agreed schedule, failure to clear
reported defects
16. Software Measurement
Objectives
– Assessing status
• Projects
• Products for a specific project or projects
• Processes
• Resources
– Identifying trends
• Need to be able to differentiate between a healthy project and one
that’s in trouble
– Determine corrective action
• Measurements should indicate the appropriate corrective action, if
any is required.
16
17. Software Measurement Objectives
• Types of information required to understand,
control, and improve projects:
– Managers
• What does the process cost?
• How productive is the staff?
• How good is the code?
• Will the customer/user be satisfied?
• How can we improve?
– Engineers
• Are the requirements testable?
• Have all the faults been found?
• Have the product or process goals been met?
• What will happen in the future?
17
18. The Scope of Software Metrics
– Cost and effort estimation
– Productivity measures and models
– Data collection
– Quality models and measures
– Reliability models
– Performance evaluation and models
– Structural and complexity metrics
– Capability-maturity assessment
– Management by metrics
– Evaluation of methods and tools
18
19. The Scope of Software Metrics
• The Scope of Software Metrics – some
details
– Possible productivity model
Productivity
Cost
Value
Personnel Resources Complexity
Quality Quantity
Time HW Env Problem
Reliability Defects Size Functionality Cnstrst difficulty
Money SW
19
20. The Scope of Software Metrics
• The Scope of Software Metrics – some
details
– Software quality model
Use Factor Criteria
Communicativeness
Usability
Accuracy
Product Reliability
Operatio Consistency
n
Efficiency Device Efficiency
Accessibility
Reusability Metrics
Completeness
Product Maintainability Structuredness
Revisio Conciseness
n Portability
Device Independence
Testability Legibility
Self-descriptiveness
20
Traceability
22. Measurement Basics
• Direct and Indirect Measurement
– Direct measure – relates an attribute to a number or
symbol without reference to no other object or attribute
(e.g., height).
– Indirect measure
• Used when an attribute must be measured by combining
several of its aspects (e.g., density)
• Requires a model of how measures are related to each
other
22
23. Measurement Basics
• Direct and Indirect Measures for Software – examples
– Direct
• Length or source code (lines of code)
• Duration of testing process
• Number of defects discovered during test
• Time a developer spends on a project
– Indirect
• Programmer productivity (LOC/workmonths of effort)
• Module defect density (number of defects/module size)
• Defect detection efficiency (# defects detected/total defects)
• Requirements stability (initial # requirements/total # requirements)
• Test effectiveness ratio (number of items covered/total number of items)
• System spoilage (effort spent fixing faults/total project effort)
23
25. Software product quality metrics
• The quality of a product:
- the “totality of characteristics that bear on its
ability to satisfy stated or implied needs”.
Metrics of the external quality attributes
producer’s perspective: “conformance to
requirements”
customer’s perspective: “fitness for use”
- customer’s expectations
26. Quality metrics
• Two levels of software product quality
metrics:
Intrinsic product quality
Customer oriented metrics
27. Intrinsic product quality metrics:
Reliability: number of hours the software can run
before a failure
Defect density (rate):
number of defects contained in software, relative
to its size.
Customer oriented metrics:
Customer problems
Customer satisfaction
28. Intrinsic product quality metrics
Reliability --- Defect density
• Correlated but different!
• Both are predicted values.
• Estimated using static and dynamic models
Defect: an anomaly in the product (“bug”)
Software failure: an execution whose effect is not conform to
software specification
30. MTBF (Mean Time Between Failures):
the expected time between two successive failures of a system
expressed in hours
a key reliability metric for systems that can be repaired or restored
(repairable systems)
applicable when several system failures are expected.
For a hardware product, MTBF decreases with the its age.
31. MTTF (Man Time To Failure):
the expected time to failure of a system
in reliability engineering metric for non-repairable systems
non-repairable systems can fail only once; example, a satellite is not repairable.
Mean Time To Repair (MTTR): average time to restore a system after a failure
When there are no delays in repair: MTBF = MTTF + MTTR
Software products are repairable systems!
Reliability models neglect the time needed to restore the system after a failure.
with MTTR =0 MTBF = MTTF
Availability = MTTF / MTBF = MTTF / (MTTF + MTTR)
32. 3.1.2. Defect rate (density)
Number of defects per KLOC or per Number of Function Point,
in a given time unit
Example:
“The latent defect rate for this product, during next four years, is 2.0
defects per KLOC”.
Crude metric: a defect may involve one or more lines of code
Lines Of Code
-Different counting tools
-Defect rate metric has to be completed with the counting method for LOC!
-Not recommended to compare defect rates of two products written in
different languages
33. Reliability or Defect Rate ?
Reliability:
often used with safety-critical systems such as: airline traffic control systems,
avionics, weapons.
(usage profile and scenarios are better defined)
Defect density:
in many commercial systems (systems for commercial use)
• there is no typical user profile
• development organizations use defect rate for maintenance cost and
resource estimates
• MTTF is more difficult to implement and may not be representative of all
customers.
34. Customer Oriented Metrics
Customer Problems Metric
Customer problems when using the product:
valid defects, usability problems, unclear documentation, user errors.
Problems per user month (PUM) metric:
PUM = TNP/ TNM
TNP: Total number of problems reported by customers for a time period
TNM: Total number of license-months of the software during the period
= number of install licenses of the software x number of months in the period
35. 3.2.2. Customer satisfaction metrics
Often measured on the five-point scale:
1. Very satisfied
2. Satisfied
3. Neutral
4. Dissatisfied
5. Very dissatisfied
IBM: CUPRIMDSO
(capability/functionality, usability, performance, reliability,
installability, maintainability, documentation /information,
service and overall)
Hewlett-Packard: FURPS
(functionality, usability, reliability, performance and service)
36. Ishikawa’s Seven Basic Tools for
Quality Control
• Checklist (or Check Sheet) – to facilitate gathering data and
to arrange data so it can be easily used later
• Pareto Diagram – a frequency chart of bars in descending
order; the bars are usually associated with types of problems
• Histogram – a graphic representation of frequency counts of
a sample or a population
• Scatter Diagram – portrays the relationship of two interval
variables; can make outliers clear
• Run Chart – tracks the performance of the parameter of
interest over time; used for trend analysis
• Control Chart – an advance form of a run chart for situations
in which the process capability can be defined
• Cause and Effect Diagram (fishbone diagram) – it shows the
relationship between a characteristic and the factors that
affect that relationship
38. Checklists
• Summarize the key points of the software
development process
• More effective than lengthy process documents
• Help ensure that all tasks are complete and the
important factors or quality characteristics of each
task are covered
• Examples of checklists are:
– Design review checklist
– Code inspection checklist
– Moderator (for review and inspection) checklist
– Pre-code-integration checklist
– Entrance and exit criteria for system tests
– Product readiness checklist