Downloaded 32 times

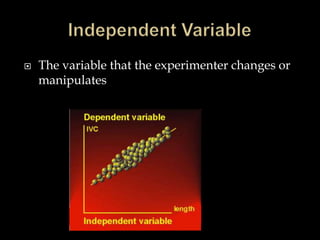
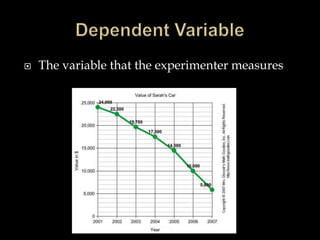
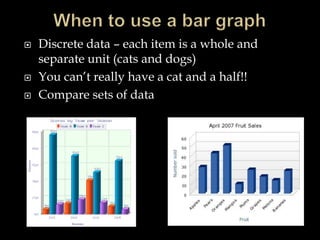
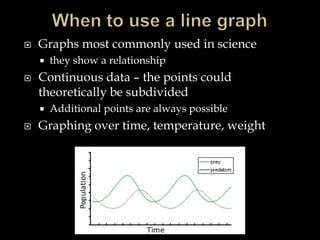
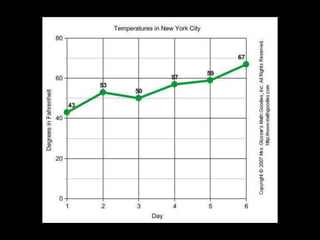
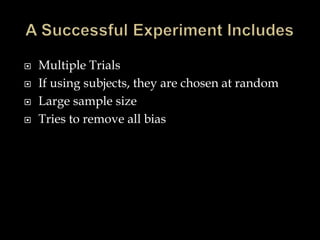
This document defines key scientific concepts like observation, inference, hypotheses, qualitative and quantitative data, independent and dependent variables. It also discusses when to use bar graphs versus line graphs, with bar graphs used for discrete data that can be counted, and line graphs showing relationships over continuous data. Finally, it lists the components of a successful experiment, including running multiple trials with randomly selected subjects and a large sample size to reduce bias.


![5G Explained! A High Level Overview [Introduction]](https://cdn.slidesharecdn.com/ss_thumbnails/5gexplainedahighleveloverview-260119165306-cc137a3e-thumbnail.jpg?width=640&height=640&fit=bounds)


