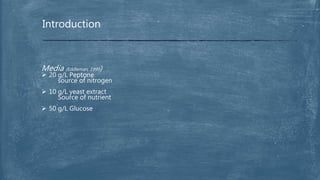
1. This document describes an experiment to study the growth kinetics of baker's yeast (Saccharomyces cerevisiae) through batch culturing in a shake flask.
2. The objectives were to study the yeast's growth curve, familiarize with batch culturing techniques, and practice aseptic techniques.
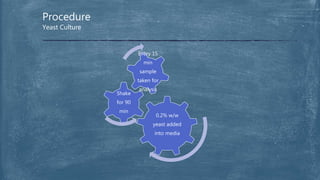
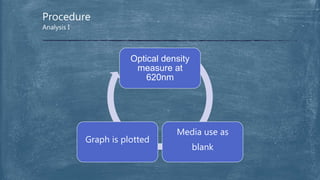
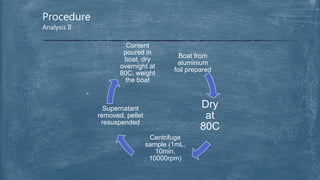
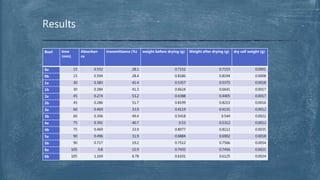
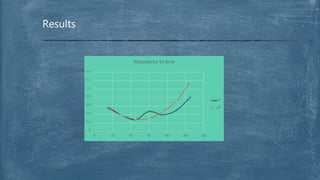
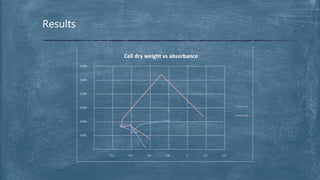
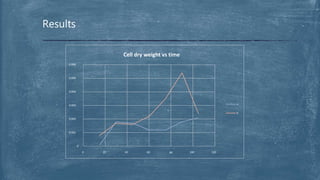
3. Samples were taken every 15 minutes and analyzed for optical density and dry cell weight. The results showed increasing optical density and dry cell weight over time, indicating yeast growth. However, errors were observed which could be addressed in future experiments.


![谷歌留痕技术 [ 𝙩𝙤𝙥 𝟮𝟯𝟯. 𝙘 𝙤𝙢 ]](https://cdn.slidesharecdn.com/ss_thumbnails/top233-260130174328-3833018c-thumbnail.jpg?width=640&height=640&fit=bounds)


