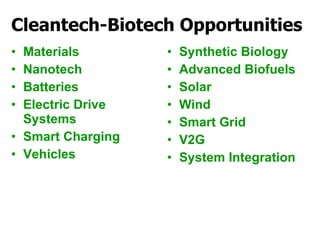
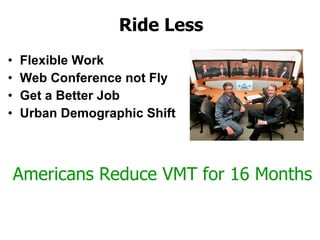
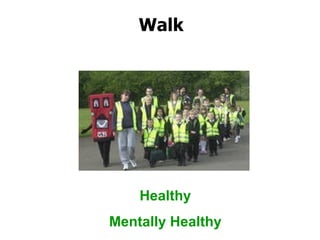
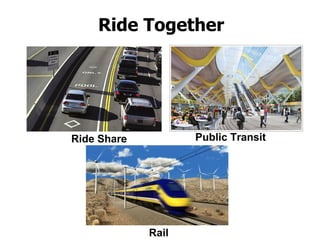
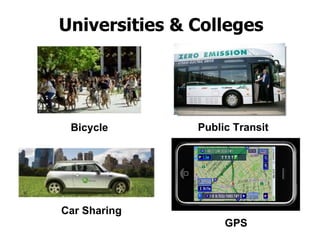
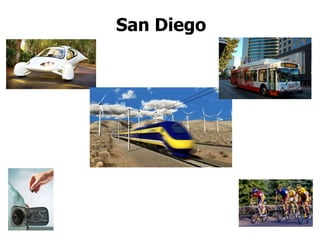
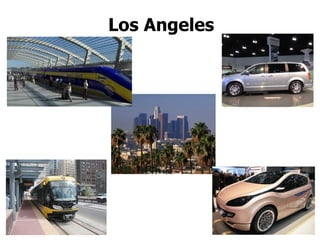
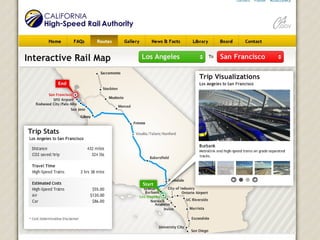
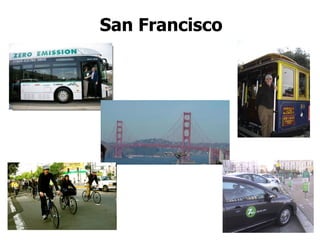
Catalyst for Change Global Warming Cost of Oil National Security Healthy Future
Agenda Ride Clean Ride Less Ride Together Climate & Energy Security Future Multimodal Fun
Ride Cleaner Share the Gas Miser Eco-Driving Electric Vehicles Plug-in Hybrids Riding on Sunlight Biofuels
Share the Gas Miser 4 Tons CO 2 12 Tons CO 2
2009 Vehicles with Lowest GHG Toyota Prius Honda Civic Hybrid Honda Insight Ford Fusion Hybrid smart fortwo Nissan Altima Hybrid Honda Civic CNG Toyota Camry Hybrid Ford Escape Hybrid Mini Cooper and Clubman Report details at www.cleanfleetreport.com
Eco-Driving 24% Solution = $1,000/year 65 mph Vs. 80 mph Tires – inflated and low resistance Tune-up Remove the rack Lighten up
Electric Vehicles 40,000 EV in USA Efficiency 67% EV Vs. 15% ICE 25 miles & 25 mph limits for LEV Tesla Freeway speed & 240 mile range 2010 Freeway-Speed Nissan Chrysler TH!NK BYD More Charge overnight in garage Fast charging alternatives Lack of charging standards and infrastructure
Asian Electric Vehicles 80 Million Battery Electric Vehicles Electric Two Wheelers (ETW) Over 1,000 Light Electric Vehicles 3 and 4 Wheel
China E2W Revolution
THE NISSAN  EV All the feature customers have come to expect: Compact Car Size Space For 5 People 100-Mile Range Advanced Safety Features
Plug-in Hybrids Conversion momentum AQMD Google NY City Delivery Vehicles Heavy Vehicles Automakers 2010 Toyota Prius GM Volt Chrysler Jeep, Town & Country Fisker Aptera Use of existing fueling infrastructure High battery demands
GM October 2007 Presentation
 
 
CLEAN  ENERGY SUPPLY Ability to reduce CO2 emission to almost zero by using solar, wind, and other renewables. CO2 emission of  EV (Considering present gasoline vehicle as 100) 100 80 60 40 20 0 Gasoline Vehicle EV Current Average
Riding on Sunlight High Growth Renewable Energy
Renewable Energy Cost Trends Wind 1980  1990  2000  2010  2020 PV COE cents/kWh 1980  1990  2000  2010  2020 40 30 20 10 0 100 80 60 40 20 0 Biomass Geothermal Solar thermal 1980  1990  2000  2010  2020 1980  1990  2000  2010  2020 1980  1990  2000  2010  2020 COE cents/kWh 10 8 6 4 2 0 70 60 50 40 30 20 10 0 15 12 9 6 3 0 Source: NREL Energy Analysis Office (www.nrel.gov/analysis/docs/cost_curves_2002.ppt) 1 These graphs are reflections of historical cost trends NOT precise annual historical data.
FUTURE  INTELLIGENT GRID (V2G/V2H) Key attributes: compatibility and functionality Efficient Building Systems Utility Communications Dynamic Systems Control Data Management Distribution Operations Distributed Generation & Storage EVs/PHEVs Smart End-Use Devices Advanced Metering Consumer Portal & Building EMS Internet Renewables PV Control Interface
Hydrogen Fuel Cell EV Fuel Cell HICE Trucks Buses
Renewable to Byproduct Hydrogen Solar & REC Electrolysis Onsite CNG Reformation LH2 Delivered Pipelined Byproduct
GM October 2007 Presentation
Ethanol 2000 = 1 billion gallons 2020 = 30 billion gallons E10 Momentum E100 Success in Brazil  Flex-Fuel Vehicle (FFV) = easy compliance EPAC & other “green” requirements Corn prices jump 60% in 2 years Future:  Fuel from wood and waste not food and haste
Cost Competitive Challenge:  scalability from lab to 100,000,000 gallons/year plant Cost reduction: water, land, fertilizer, nitrogen Integration with existing wood & paper plants Process breakthroughs: purification, conversion, gasification, efficiency CO2 sequestration: poplar, grasses, algae 10X biomass/acre (e.g. energy cane) 100X yield/acre (e.g. algae) No new infrastructure – biodiesel, biogasoline, biocrude Pipeline delivery
Pyrolisis Mixalco Process Glycerin Natural Oils BioDiesel (FAME or FAEE) Methanol/Ethanol Gasification Syngas Fermentation Ethanol/Butanol BTL Diesel Mixed Higher Alcohol Methane Microbial cultures Dimethylfuran Gasoline, Diesel, Hydrocarbons Ethanol, Butanol, Renewable Petroleum FermDiesel Sugars/ Starch Fermentation Biogasoline ETG via catalysis Biomass Cellulose/ Hemicellulose Acid or Enzyme Hydrolysis Saccharification Ethanol Algae + Sunlight – CO2  Cell Mass Hydrocracking Waste Fischer-Tropspch catalysis BioDiesel (FAME or FAEE) Catalytic Conversion Butanol Diesel Transesterification Catalysis and Aqueous phase Reforming Fermentation Catalytic Conversion Ethanol Feedstock Supply Volume Increasing  Technological Difficulty Biooil Khosla Ventures:  scalability Feed Cost
Cellulosic Ethanol DuPont Danisco  Tenn 20  Switchgrass Gulf Coast Energy Florida   25  Woody biomass Mascoma  Michigan  40  Woody biomass Poet  Iowa   25  Corn cobs Range Fuels  Georgia   20  Wood waste Verenium-BP  Florida   36  Energy cane, sorghum Enerkem Miss 20  Municipal waste
GHG Source-to-Wheels Debate California Global Warming Intensity at Wheel (g CO2e/MJ) 30 Midwest Soy Biodiesel 114 Corn with Coal Electricity Ethanol -12 Cellulosic from Poplar Trees Ethanol 27 California Average Electricity 22 Biomass & Pipeline Delivery Hydrogen 48 Onsite CH4 Reformed Hydrogen 79 North American Pipelined CNG 167 Coal-to-Liquid Diesel 71 ULSD Refined Diesel 92 Oil Refined Gasoline GREET Production Fuel
USMC Camp Pendleton Fleet 300+ Solar Charged EV Hydrogen Future 5 Million Gallons B20 JP8 Tactical
Cleantech-Biotech Opportunities Materials Nanotech Batteries Electric Drive Systems Smart Charging Vehicles Synthetic Biology Advanced Biofuels Solar Wind Smart Grid V2G System Integration
Ride Less Flexible Work Web Conference not Fly Get a Better Job Urban Demographic Shift Americans Reduce VMT for 16 Months
Walk Healthy Mentally Healthy
Ride Together Public Transit Ride Share Rail
98% of U.S. Commuters Favor Public Transportation for Others - headline in the  Onion
 
Last Miles To-From Commuter Express Google Maps Rideshare to Bus Stop Walk Bicycle Bicycle Share E-Bike EV Shuttles Guaranteed Ride Home
Car-light and Carefree Walk More Bike More Sharing One Car Car-Free and Carefree
Universities & Colleges Bicycle Public Transit Car Sharing GPS
 
Save the Planet Build on Existing Success Renewable Energy Hybrids to Electric Vehicles 4 Million Govt Vehicles MPG & EV Invest in Public Transportation High-Speed Rail Connected Cities Multimodal Fast & Cheap Sustainable Communities 5,000,000 Green Jobs U.S. Leadership in Global Climate Agreement
 
San Diego
Los Angeles
 
San Francisco
Our Hope, Our Legacy, Our Future cleanfleetreport.com
 

Save Gas Save The Planet 1 Hour

  • 1.
  • 2.
    Catalyst for ChangeGlobal Warming Cost of Oil National Security Healthy Future
  • 3.
    Agenda Ride CleanRide Less Ride Together Climate & Energy Security Future Multimodal Fun
  • 4.
    Ride Cleaner Sharethe Gas Miser Eco-Driving Electric Vehicles Plug-in Hybrids Riding on Sunlight Biofuels
  • 5.
    Share the GasMiser 4 Tons CO 2 12 Tons CO 2
  • 6.
    2009 Vehicles withLowest GHG Toyota Prius Honda Civic Hybrid Honda Insight Ford Fusion Hybrid smart fortwo Nissan Altima Hybrid Honda Civic CNG Toyota Camry Hybrid Ford Escape Hybrid Mini Cooper and Clubman Report details at www.cleanfleetreport.com
  • 7.
    Eco-Driving 24% Solution= $1,000/year 65 mph Vs. 80 mph Tires – inflated and low resistance Tune-up Remove the rack Lighten up
  • 8.
    Electric Vehicles 40,000EV in USA Efficiency 67% EV Vs. 15% ICE 25 miles & 25 mph limits for LEV Tesla Freeway speed & 240 mile range 2010 Freeway-Speed Nissan Chrysler TH!NK BYD More Charge overnight in garage Fast charging alternatives Lack of charging standards and infrastructure
  • 9.
    Asian Electric Vehicles80 Million Battery Electric Vehicles Electric Two Wheelers (ETW) Over 1,000 Light Electric Vehicles 3 and 4 Wheel
  • 10.
  • 11.
    THE NISSAN EV All the feature customers have come to expect: Compact Car Size Space For 5 People 100-Mile Range Advanced Safety Features
  • 12.
    Plug-in Hybrids Conversionmomentum AQMD Google NY City Delivery Vehicles Heavy Vehicles Automakers 2010 Toyota Prius GM Volt Chrysler Jeep, Town & Country Fisker Aptera Use of existing fueling infrastructure High battery demands
  • 13.
    GM October 2007Presentation
  • 14.
  • 15.
  • 16.
    CLEAN ENERGYSUPPLY Ability to reduce CO2 emission to almost zero by using solar, wind, and other renewables. CO2 emission of EV (Considering present gasoline vehicle as 100) 100 80 60 40 20 0 Gasoline Vehicle EV Current Average
  • 17.
    Riding on SunlightHigh Growth Renewable Energy
  • 18.
    Renewable Energy CostTrends Wind 1980 1990 2000 2010 2020 PV COE cents/kWh 1980 1990 2000 2010 2020 40 30 20 10 0 100 80 60 40 20 0 Biomass Geothermal Solar thermal 1980 1990 2000 2010 2020 1980 1990 2000 2010 2020 1980 1990 2000 2010 2020 COE cents/kWh 10 8 6 4 2 0 70 60 50 40 30 20 10 0 15 12 9 6 3 0 Source: NREL Energy Analysis Office (www.nrel.gov/analysis/docs/cost_curves_2002.ppt) 1 These graphs are reflections of historical cost trends NOT precise annual historical data.
  • 19.
    FUTURE INTELLIGENTGRID (V2G/V2H) Key attributes: compatibility and functionality Efficient Building Systems Utility Communications Dynamic Systems Control Data Management Distribution Operations Distributed Generation & Storage EVs/PHEVs Smart End-Use Devices Advanced Metering Consumer Portal & Building EMS Internet Renewables PV Control Interface
  • 20.
    Hydrogen Fuel CellEV Fuel Cell HICE Trucks Buses
  • 21.
    Renewable to ByproductHydrogen Solar & REC Electrolysis Onsite CNG Reformation LH2 Delivered Pipelined Byproduct
  • 22.
    GM October 2007Presentation
  • 23.
    Ethanol 2000 =1 billion gallons 2020 = 30 billion gallons E10 Momentum E100 Success in Brazil Flex-Fuel Vehicle (FFV) = easy compliance EPAC & other “green” requirements Corn prices jump 60% in 2 years Future: Fuel from wood and waste not food and haste
  • 24.
    Cost Competitive Challenge: scalability from lab to 100,000,000 gallons/year plant Cost reduction: water, land, fertilizer, nitrogen Integration with existing wood & paper plants Process breakthroughs: purification, conversion, gasification, efficiency CO2 sequestration: poplar, grasses, algae 10X biomass/acre (e.g. energy cane) 100X yield/acre (e.g. algae) No new infrastructure – biodiesel, biogasoline, biocrude Pipeline delivery
  • 25.
    Pyrolisis Mixalco ProcessGlycerin Natural Oils BioDiesel (FAME or FAEE) Methanol/Ethanol Gasification Syngas Fermentation Ethanol/Butanol BTL Diesel Mixed Higher Alcohol Methane Microbial cultures Dimethylfuran Gasoline, Diesel, Hydrocarbons Ethanol, Butanol, Renewable Petroleum FermDiesel Sugars/ Starch Fermentation Biogasoline ETG via catalysis Biomass Cellulose/ Hemicellulose Acid or Enzyme Hydrolysis Saccharification Ethanol Algae + Sunlight – CO2 Cell Mass Hydrocracking Waste Fischer-Tropspch catalysis BioDiesel (FAME or FAEE) Catalytic Conversion Butanol Diesel Transesterification Catalysis and Aqueous phase Reforming Fermentation Catalytic Conversion Ethanol Feedstock Supply Volume Increasing Technological Difficulty Biooil Khosla Ventures: scalability Feed Cost
  • 26.
    Cellulosic Ethanol DuPontDanisco Tenn 20 Switchgrass Gulf Coast Energy Florida 25 Woody biomass Mascoma Michigan 40 Woody biomass Poet Iowa 25 Corn cobs Range Fuels Georgia 20 Wood waste Verenium-BP Florida 36 Energy cane, sorghum Enerkem Miss 20 Municipal waste
  • 27.
    GHG Source-to-Wheels DebateCalifornia Global Warming Intensity at Wheel (g CO2e/MJ) 30 Midwest Soy Biodiesel 114 Corn with Coal Electricity Ethanol -12 Cellulosic from Poplar Trees Ethanol 27 California Average Electricity 22 Biomass & Pipeline Delivery Hydrogen 48 Onsite CH4 Reformed Hydrogen 79 North American Pipelined CNG 167 Coal-to-Liquid Diesel 71 ULSD Refined Diesel 92 Oil Refined Gasoline GREET Production Fuel
  • 28.
    USMC Camp PendletonFleet 300+ Solar Charged EV Hydrogen Future 5 Million Gallons B20 JP8 Tactical
  • 29.
    Cleantech-Biotech Opportunities MaterialsNanotech Batteries Electric Drive Systems Smart Charging Vehicles Synthetic Biology Advanced Biofuels Solar Wind Smart Grid V2G System Integration
  • 30.
    Ride Less FlexibleWork Web Conference not Fly Get a Better Job Urban Demographic Shift Americans Reduce VMT for 16 Months
  • 31.
  • 32.
    Ride Together PublicTransit Ride Share Rail
  • 33.
    98% of U.S.Commuters Favor Public Transportation for Others - headline in the Onion
  • 34.
  • 35.
    Last Miles To-FromCommuter Express Google Maps Rideshare to Bus Stop Walk Bicycle Bicycle Share E-Bike EV Shuttles Guaranteed Ride Home
  • 36.
    Car-light and CarefreeWalk More Bike More Sharing One Car Car-Free and Carefree
  • 37.
    Universities & CollegesBicycle Public Transit Car Sharing GPS
  • 38.
  • 39.
    Save the PlanetBuild on Existing Success Renewable Energy Hybrids to Electric Vehicles 4 Million Govt Vehicles MPG & EV Invest in Public Transportation High-Speed Rail Connected Cities Multimodal Fast & Cheap Sustainable Communities 5,000,000 Green Jobs U.S. Leadership in Global Climate Agreement
  • 40.
  • 41.
  • 42.
  • 43.
  • 44.
  • 45.
    Our Hope, OurLegacy, Our Future cleanfleetreport.com
  • 46.