Portland, Oregon's sustainability commitment
•Download as PPT, PDF•
2 likes•498 views

Portland, Oregon has a long history of pursuing sustainability policies and goals dating back to 1979. Some key policies and accomplishments include adopting carbon dioxide reduction strategies in 1993 and local action plans on global warming in 2001 and 2008. The city achieved its 2010 goal of reducing CO2 levels 10% below 1990 levels. Portland also significantly increased use of public transit, biking, green buildings, and recycling while decreasing vehicle miles traveled, gasoline sales, and household energy use per capita.

Recommended
More Related Content
What's hot
What's hot (17)
Viewers also liked
Viewers also liked (18)
Similar to Portland, Oregon's sustainability commitment
Similar to Portland, Oregon's sustainability commitment (20)
Portland, Oregon's sustainability commitment
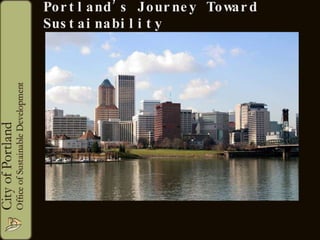
- 1. Portland’s Journey Toward Sustainability
- 14. Transit (Photo courtesy of Portland Development Commission)
- 15. Biking
- 16. Bike Commuting in Portland
- 18. Accomplishments
- 19. Accomplishments Portland 2010 Goal: 10% below 1990 levels Emissions level required to stabilize the climate
- 20. Michele Crim, 503-823-5638, mcrim@ci.portland.or.us
Editor's Notes
- Want to thank you for inviting me to speak with you today. The title of my presentation is “Portland’s Journey Toward Sustainability”, and I think that is appropriate because we are working toward becoming more sustainable…and that while Portland has a great reputation nationally for being “sustainable”, we certainly aren’t there yet.
- Portland has been working on sustainability for some time. Almost 30-years ago, as an extension of the statewide planning requires, Portland adopted its 1979 Local Energy Plan, making Portland the first local government to have an energy plan in the US. In the early 90s, issues like global warming and climate change were on the scene, and in 1993 Portland developed a “Carbon Dioxide Reduction Strategy” As you can see, it was pretty high-tech, complete with a 5 ½ inch floppy disc. This plan was a result of reexamining our energy focused efforts, and integrating housing, land use, transportation and business issues. This was another first as well, as with this plan Portland became the first local government in the US to have a climate change action plan.
- As you can see, we got pretty fancy and added color to the cover! With this update, Multnomah County joined the effort and adopted the plan at the same time. In this plan, we set a goal to reduce our CO2 emissions to 10% below 1990 levels by 2010 – and toward the end of the presentation I will show you the data on how we are doing toward reaching that goal.
- We are currently in the process of updating this plan again, and expect to release it in the late summer of 2008. The updated plan will contain new, more aggressive long-term goals – including an 80% reduction below 1990 levels by 2050, and will create the foundation for the policies and actions that we will need to take to meet those goals. Global warming is becoming a key issue nationally, and it has certainly been on the radar screen internationally for quite some time. 15-years ago Portland formally identified the priority to begin addressing global warming through our local actions. Today, global warming has taken even more of the center stage in Portland, which is being directly translated into our planning and policy efforts. Multnomah County residents spent about $80 million more on gasoline in 2005 than in 2004 Portland businesses and residents spent $36 million more on natural gas in 2005 than in 2004
- In addition to addressing global warming for environmental reasons, Portland is also pursuing these strategies because the solutions tend to: Improve air quality Reduce traffic congestion Create economic development opportunities Reduce rising energy bills for residents and businesses Save governments millions in operating expenses
- But, before we can ask businesses and residents to change their practices, it is important that we get our own house in order and serve as a example. In 1990 we adopted an energy policy, known as the “City Energy Challenge”. The goal of the challenge was to reduce our energy consumption by 10% by 2010. We reached that goal within just a few years. Some examples include building retrofits (saving over $300k / year), and replacing incandescent traffic lights with LED lights (saving $335k / year). We are also making an effort to install onsite renewables, including this work truck that has been outfitted with solar panels so that the field crews can operate their equipment without needing to idle the engine. Another significant energy goal Portland has established is to have all city facilities, including street lights and traffic signals, operating on 100% renewable energy by 2010. For several years the City of Portland has been working to negotiate directly the construction of a wind farm in Eastern Oregon – a strategy that has been challenging, since it has never been done before. Currently, Portland is pursuing other wind energy options directly with Eastern Oregon Farmers.
- Another area where we have been making strides is through the greening of our fleet. Since 2004 we have been using high blends of biodiesel, starting with 20% (B20), through today where our entire diesel fleet is using B50 and the Water Bureau is using B99. We have also been specifying Flexible Fuels vehicles for new gas powered purchases, when available. Through that effort ou have increased the number of FFVs in our fleet to over 80. Gas-electric hybrids are also key, we have 50 Toyota Priuses in the fleet. The picture on the left is one of the WB trucks that runs on 99% biodiesel. The picture on the right is one of the drinking water reservoir security patrols using a Segway. Many bureaus are working to identify ways to move away from the use of vehicles entirely. They have found that they can get places on the Segways they couldn’t get to quickly before, and that they have greatly increased the interaction with the public with folks coming to ask about the Segway, which in turns also helps them to dramatically improve security of the area.
- We also have a green building policy for City owned and operated facilities. It requires “LEED Gold” certification for new construction, with additional requirements to recycle 75% and exceed water, energy and stormwater performance by at least 30% better than code. All existing buildings need to become LEED Silver, as well as remodels. For new roofs and re-roof projects, the roof must be 70% eco-roof and the rest must be high reflectance energy star. The picture is of the 1 year old eco-roof on the Portland Building, the City’s main downtown, 13 story, administration building. It has over 14,000 plants on it.
- One of the newest sustainability policies is around biofuels. Last December (2006), Portland’s City Council adopted a local renewable fuel standard, making it the only local government in the US to do so. The standard requires that all diesel sold inside the city limits contain a minimum of 5% biodiesel, and all gasoline must contain 10% ethanol. In 2010, the biodiesel requirement will increase to a minimum of 10%.
- As you probably know, biofuels are not going to be enough to get us to where we need to go. That is where planning comes in. The City is currently updating our Comprehensive Plan. Two of the key issues have been identified that need to be addressed in this planning effort are GW and Peak Oil. About a year ago a task force was formed by City Council to develop recommendations related to navigating expected oil supply and price volatility. They developed recommendations in a variety of areas, including land use and transportation, food and agriculture, public and social services, and economic change. Two key goals now guiding the City of Portland: Reducing greenhouse gas emissions to 80% below 1990 levels by 2050 (climate change); and Reducing oil and natural gas consumption by 50% in the next 25 years (peak oil)
- In addition to dramatically improving miles per gallon efficiency of vehicles, there are other important that will help us achieve our global warming and peak oil goals. As you probably know, Portland has a robust mass-transit system, including light rail trains, street cars, and a large bus fleet. The rail systems continue to expand, and Trimet, our mass transit agency, continues to make significant improvements in the fuel efficiency of their fleet.
- Bike commuters also play a key role. Busses have bike racks and light rail trains have bike hooks – which means that an increasing number of folks are now able to commute through a combination of using bikes and transit. Bike commuting has become so popular that the lack of bike parking has become an issue. Many businesses are working with the City to turn street car parking spots into on street bike parking, as you can seen in the picture on the upper left, outside of a local coffee shop.
- So, why have we seen this success? In many ways it is a classic case of “If you build it, they will come”….or in this case, “if you build it, they will ride”. The blue bars are the number of miles of bikepath and bike lanes, the red line is the number of riders crossing the bridges. You can see that bikeway development has plateaued, but ridership has continued to skyrocket. Reached a critical mass with the system infrastructure that has enabled bike commuting to become a truly viable option, and ridership has soared.
- So, I have talked a lot about a variety of policies, programs and incentives Portland has put in place to move us further down the road toward sustainability. But, what type of results are we seeing? Compared to 1990…. Portland has the most green buildings in the US. We also have the highest hybrid ownership in the US, per capita. Transit ridership has risen by 85%, in fact, compared to the average metropolitan resident in the US, Portlanders are twice as likely to use transit … .and seven times more likely to commute by bike. Bike commutes have quadrupled. Vehicle miles traveled have decreased 7% per capita. A recent Dept. of Labor’s Consumer Expenditure Survey shows that Portlanders have the second lowest rate of spending on transportation costs of the 28 largest metro areas in the US. Residents spend about 4% less than their total household budgets on transportation than other Americans (source: Joe Cortright, CEOs for Cities, “Portland’s Green Dividend” whitepaper, July 2007). Gasoline sales have dropped 13% per capita and household energy has decreased by 5% per capita. As I mentioned before, City facilities are saving over $2.6 M per year from energy efficiency projects. And Portland’s recycling rate has more than tripled.
- But, what does that mean in terms of our progress toward some of the initial goals I talked about related to global warming? As a reminder, Portland established a goal to reduce greenhouse gas emissions to 10% below 1990, by 2010. So, how are we doing…. This graph depicts how we are doing. Years are across the bottom, beginning with 1990, and the % emissions compared to 1990 levels is along the side axis. The red line shows the emissions trends for the US as a whole, and the green line shows the emissions trends for Multnomah County, which is where Portland is. As you can see from the graph, our CO2 emissions back down to 1990 levels = these are total emissions, so we have achieved this impressive result, even with a lot more people living in Portland today compared to 1990. In fact, emissions have declined in each of the past 4 years. Per Capita Emissions are down 14%, accomplishment likely unequaled in any other major US city. In rest of US, per capita emissions have increased by 16% during same period. So this is great news, right! Well, there is good news and bad news to this story. The good news is that we are seeing a downward trend, and with dedicated and hard work, we may be able to stay on track to meet our 2010 goal. The bad news…. Residential 1.8 metric tons (20%) Commercial1.8 metric tons (21%) Industrial1.5 metric tons (17%) Transportation3.4 metric tons (39% )Waste Disposal0.2 metric tons (3%) Total8.9 metric tons
- … is that we have a long way to go. The red and green lines show the trends we looked at on the previous page, again, red line is the US, green line is Multnomah County. The first pink star marks our 2010 goal of 10% below 1990 levels. The second pink star, however, shows the type of emissions reductions we need to achieve by 2050 in order to be able to stabilize the climate. Need to set new, more aggressive goals, and the policies, programs, incentives and planning efforts to reach them. BOTTOM LINE: it takes a whole community, a public-private partnership, creativity, and luck to make things happen
- With that, I thank you for your time and attention and I am happy to answer any questions you might have.