Download to read offline


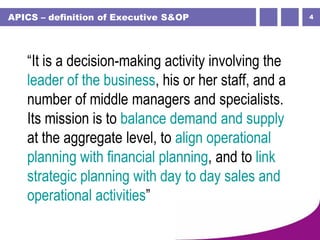
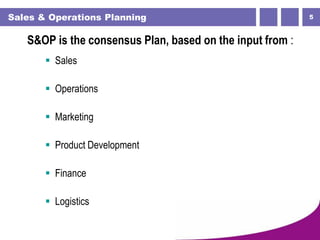
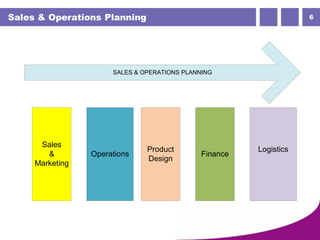
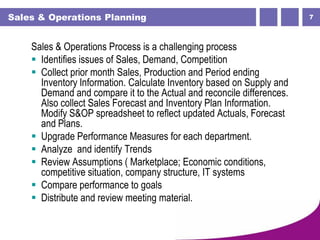
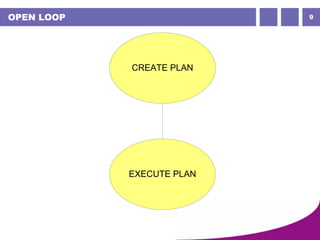
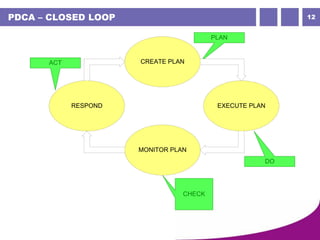
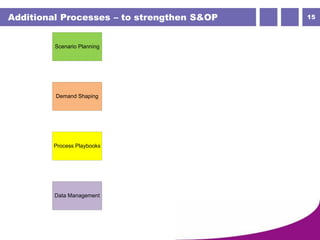


This document discusses strengthening sales and operations planning (S&OP) processes. It describes S&OP as a consensus planning process that balances demand and supply while aligning operational, financial, and strategic planning. The document advocates adopting a closed-loop "plan-do-check-act" approach using scenario analysis, process playbooks, demand shaping, and data management to continuously monitor and respond to plan deviations. This helps companies improve supply chain resilience through scenario simulations and predefined responses to issues stored in a knowledge base.