Downloaded 126 times

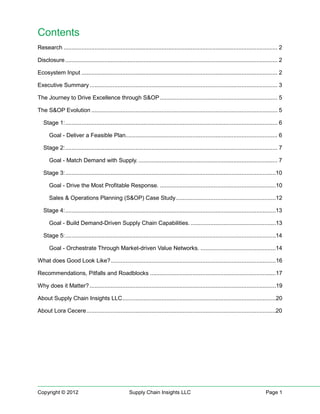
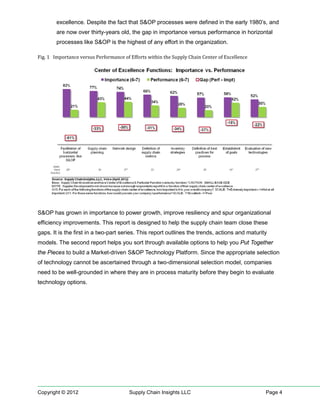
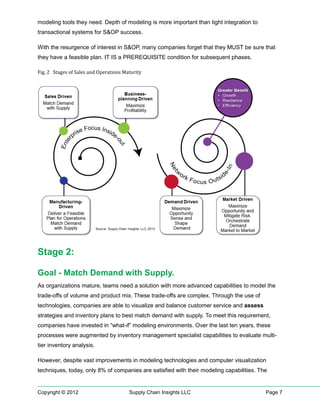
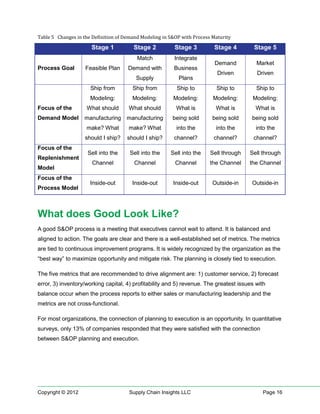

This document outlines the evolution of Sales and Operations Planning (S&OP) processes through five stages of maturity: 1. Develop a feasible plan 2. Match demand with supply 3. Drive the most profitable response 4. Become demand-driven 5. Orchestrate through market-driven value networks It discusses how the goal and technology needs change at each stage. Most companies are not clear on their S&OP goal or supply chain strategy, undermining their success. Moving to later stages requires redefining data models and inputs to enable more advanced modeling and optimization of demand, supply, inventory, and financial trade-offs. Building an effective S&OP process faces barriers including executive


