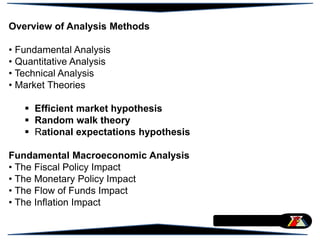
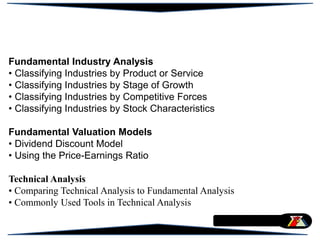
This document provides an overview of various analysis methods used to evaluate investments, including fundamental analysis, quantitative analysis, and technical analysis. It also discusses relevant market theories like the efficient market hypothesis. Fundamental analysis examines macroeconomic factors, industry conditions, and individual company financials. Quantitative analysis uses computers and statistics to identify patterns for investment opportunities. Technical analysis studies historical stock price movements and trading volumes to predict future price changes. The efficient market hypothesis posits that stock prices instantly reflect all available information.
This document provides an overview of security analysis, which involves analyzing tradeable financial instruments like stocks, bonds, and derivatives. It discusses the main approaches to security analysis: fundamental analysis and technical analysis. Fundamental analysis examines underlying business and economic factors, while technical analysis focuses on price trends and momentum. The document then goes into more detail about fundamental analysis and the three steps involved: economic analysis, industry analysis, and company analysis. It provides examples of key variables to consider in each type of analysis.
Fundamental analysis and technical analysisMohammed Umair
This document discusses fundamental analysis techniques for evaluating securities. It defines fundamental analysis as focusing on underlying business factors like financials, management, and prospects to determine a security's value. The document outlines different levels of analysis, including analyzing the overall economy, individual industries, and specific companies. It provides examples of analyzing economic indicators, using Porter's Five Forces for industry analysis, evaluating competitors, and assessing profitability metrics. The goal of fundamental analysis is to answer questions about a company's growth, profits, competitive positioning, debt repayment ability, and accounting practices.
Fundamental analysis is a method of evaluating securities that involves performing an analysis of the underlying company and industry. It examines factors like the overall economy, industry conditions, and the financial condition and management of companies to determine a company's intrinsic value. The analysis involves evaluating economic, industry, and company-specific factors to estimate future earnings and stock prices. Some key aspects of fundamental analysis include analyzing the economy, industry life cycles, and individual company financials and operations.
The Markowitz Model assists investors in selecting efficient portfolios by analyzing possible combinations of securities. It helps reduce risk through diversification by choosing securities whose price movements are not perfectly correlated. The model determines the efficient set of portfolios and allows investors to select the optimal portfolio based on their preferred risk-return tradeoff. Markowitz introduced diversification and showed holding multiple lower-risk securities can reduce overall portfolio risk compared to a single higher-risk security. The model calculates expected returns, variances, and correlations between securities to determine the minimum risk portfolio for a given level of return.
This document discusses different types of fundamental analysis used to evaluate investments including economic analysis, industry analysis, and company analysis. It outlines factors considered in each type of analysis such as macroeconomic factors for economic analysis, the industry life cycle and competitive conditions for industry analysis, and financial and non-financial internal and external factors for company analysis. The goal of fundamental analysis is to evaluate the past and expected future performance of economies, industries, and companies to inform investment decisions.
The document discusses the random walk theory, which states that stock price movements cannot be predicted because they follow a random path rather than any predictable patterns. It originated in the 1900s and was popularized in a 1973 book. The random walk theory says past stock performance does not indicate future performance and prices reflect all available information. However, some studies have found evidence of predictability based on factors like earnings. The implications are that market timing is difficult and outperforming the market through analysis alone may involve some luck.
The document discusses the efficient market hypothesis (EMH) which argues that stock prices reflect all available information. It defines three forms of market efficiency - weak, semi-strong, and strong - based on the types of information reflected in stock prices. The weak form states that prices reflect all historical price data, while the semi-strong form argues that prices immediately incorporate publicly available information. Empirical tests provide mixed support for the different forms of the EMH. The document also discusses potential market inefficiencies and anomalies that appear to contradict the EMH, such as the size effect and January effect.
factors including economic and industrial analysisvishnu1204
This document discusses factors to consider when analyzing the economy and industries for investment purposes. It outlines key economic indicators like GNP, inflation, interest rates, and government spending that influence corporate performance. The economic cycle of depression, recovery, boom and recession is also noted. Industry analysis involves examining the lifecycle, characteristics, and profit potential of industries. Specific industries mentioned include agriculture and how economic stability, infrastructure development, exchange rates and other macroeconomic variables impact business conditions. The overall aim is to evaluate how macroeconomic and industry trends may affect future company earnings and dividends.
- The document discusses technical analysis, which uses patterns in stock prices and trading volume to predict future stock performance, rather than analyzing companies' financials.
- It outlines various technical analysis techniques like charting patterns, indicators like RSI and Bollinger Bands, and identifying support and resistance levels.
- Technical analysis is believed to be one of the oldest forms of security analysis and is still widely used today, though it also faces challenges from theories like the efficient market hypothesis.
Fundamental analysis involves examining qualitative and quantitative factors related to a security to determine its intrinsic value. This includes analyzing macroeconomic factors like the overall economy and industry conditions, as well as company-specific factors like financial statements and management. There are two approaches to fundamental analysis: economy analysis which focuses on outputs like GDP, unemployment, and inflation; and industry analysis which evaluates demand, supply, and competitiveness. Company analysis delves into the balance sheet, financial position, products/services, and uses financial ratios to evaluate profitability, liquidity, activity, debt, market performance, and capital budgeting. Fundamental analysis provides valuable insights but should be approached cautiously given potential biases.
This document discusses fundamental analysis, which uses financial and economic analysis to predict stock price movements. It examines both macroeconomic factors like the economy and industry-specific factors, as well as individual company performance. Fundamental analysis seeks to determine a stock's intrinsic value based on its current and future earnings capacity. By identifying stocks trading below their intrinsic value, investors can purchase underpriced stocks. The document outlines top-down and bottom-up approaches to analysis, and describes the steps of fundamental analysis as evaluating the economy, industry, and individual companies.
noorulhadi Lecturer at Govt College of Management Sciences, noorulhadi99@yahoo.com
i have prepared these slides and still using in mylectures, Reference: Portfolio management by S kevin and onlin
noorulhadi Lecturer at Govt College of Management Sciences, noorulhadi99@yahoo.com
i have prepared these slides and still using in mylectures, Reference: Portfolio management by S kevin and onlin.
This document discusses fundamental analysis techniques for evaluating stocks. It covers analyzing macroeconomic factors, industries, and individual companies. Fundamental analysis involves forecasting earnings, cash flows, and dividends to determine a stock's intrinsic value. It breaks down as 30-35% economic analysis, 15-20% industry analysis, and 30-35% company analysis. Key aspects covered include Porter's five forces model, industry life cycles, quantitative ratios like P/E, and qualitative factors. The overall aim is to understand factors that affect stock prices and identify undervalued stocks.
Fundamental analysis is a method of evaluating securities by examining related economic, financial, and political factors to measure a security's intrinsic value. Key factors analyzed include the company's earnings growth rate, risk exposure, and the economic environment and industry it operates in. Fundamental analysis involves analyzing the macroeconomic environment, industry characteristics, and individual company metrics like financial performance, management, and competitive position. The goal is to understand these factors' impact on investment returns and stock prices.
This document summarizes a seminar on portfolio analysis presented to a professor. It discusses key concepts related to portfolio analysis including diversification, asset allocation, risk analysis, systematic and unsystematic risk, and risk management. It provides definitions and explanations of these terms. The document also outlines the contents, introduction, advantages and disadvantages of portfolio analysis.
Fundamental analysis involves analyzing a company's financial statements, management, competitive advantages, and markets to determine the intrinsic value of its stock. It focuses on factors like earnings, production, management, and the overall economy for futures and forex. The key aspects of fundamental analysis include examining economic, financial, qualitative and quantitative factors of a company and its industry to predict stock price movements and evaluate business performance and management. Some tools used are earnings per share, price-earnings ratio, dividend yield, and analysis of statements like the balance sheet and income statement.
The document discusses the random walk theory as applied to stock prices. It posits that stock prices follow random walks such that their movements cannot be predicted, making it impossible to outperform the market without taking on additional risk. The theory believes that fundamental analysis and technical analysis are futile for predicting prices. It implies the best investment strategy is to invest in a portfolio that reflects the overall stock market. The key aspects of the random walk theory are that stock price changes are independent and have the same probability distribution. Criticisms argue that prices may follow trends in the short run and the theory's basis is flawed.
1. The document discusses portfolio selection using the Markowitz model.
2. The Markowitz model aims to find the optimal portfolio, which provides the highest return and lowest risk. It does this by analyzing different combinations of securities to identify efficient portfolios.
3. The document provides details on the tools and steps used in the Markowitz model for portfolio selection, including analyzing expected returns, variance, standard deviation, and coefficients of correlation between securities.
35 page the term structure and interest rate dynamicsShahid Jnu
The document discusses theories and models of the term structure of interest rates. It covers spot and forward rates, the swap rate curve, traditional theories like expectations theory and liquidity preference theory, modern term structure models like CIR and Vasicek, yield curve factor models, and measures of sensitivity to shifts in the yield curve like duration.
The document discusses different types of risks that can be associated with holding securities in a portfolio. It defines systematic and unsystematic risks, with unsystematic risks being unique to a specific firm or industry and systematic risks affecting the entire market. It also discusses beta and how it is a measure of the volatility or systematic risk of a security compared to the market as a whole. Beta is used in the capital asset pricing model to calculate expected returns based on risk.
This presentation gives you an overview of technical analysis. Technical Analysis basically suggests us "WHEN" to invest. This presentation will give a brief idea of Dow's Theory and different types of graphs used in share market to demonstrate a specific stock (5 types of graphs).
This document summarizes the efficient market hypothesis (EMH) in three sentences:
The EMH states that market prices fully reflect all available public information and adjust instantly to new information. It has three forms - weak, semi-strong, and strong - with each form incorporating more types of information. Most research supports the weak and semi-strong forms, finding that historical data and public information are reflected in prices, but the strong form is not supported as non-public information can be used to earn excess returns.
This document discusses portfolio analysis and security analysis. It defines portfolio analysis as determining the future risk and return of holding various combinations of individual securities. Portfolio analysis involves diversifying investments across different assets, industries, and companies to reduce non-systematic risk. The document contrasts traditional portfolio analysis, which focuses on lowest risk securities, with modern portfolio theory, which emphasizes combining high and low risk securities to maximize returns at a given level of risk. Key aspects of portfolio analysis include calculating expected returns, variance, and the standard deviation and beta of a portfolio to measure risk. Diversification is presented as an important tool to reduce unsystematic risk.
The document provides an overview of various analysis methods used to evaluate investments, including fundamental analysis, quantitative analysis, technical analysis, and market theories like the efficient market hypothesis. It then discusses several types of fundamental analysis, including macroeconomic analysis and how fiscal and monetary policy can impact industries. Different market theories are also examined, suggesting markets are generally efficient but may not perfectly reflect all available information at once. Both technical and fundamental analysis are seen as valid approaches to help understand how markets move in response to different factors.
This document discusses fundamental analysis for investment purposes. It defines fundamental analysis as evaluating a security's intrinsic value based on external factors that could influence future price. The document outlines factors to consider in fundamental analysis including quantitative company financials, qualitative company/industry attributes, and macroeconomic, industry, and company specifics. It also describes different types of fundamental analysis and tools used for economic analysis in fundamental evaluation.
In this power point presentation i am discussing about the fundamental and technical analysis done by an investor before making investment in any company.
Demand forecasting involves using statistical data and analysis to predict future demand for a product. There are different types of forecasts including short term (less than 1 year), long term, and passive vs active. Short term forecasts help with sales, pricing, and target policies while long term helps with planning. Demand can be forecast at the macro, industry, or firm level. Statistical methods include time series analysis, regression analysis, and smoothing techniques like moving averages and exponential smoothing. Accurate demand forecasting is important for production, inventory, investment, and economic planning.
An energy firm would manage profits downwards after raising prices to avoid political scrutiny, according to the political cost hypothesis. This theory holds that large firms use accounting methods to reduce reported profits to lower political attention and potential arguments they are exploiting customers. Reporting higher profits could draw unwanted attention from politicians and groups looking to criticize profitable companies.
The document discusses the transmission mechanism of monetary policy through four key points:
1. It introduces the transmission mechanism and defines it as the series of links between monetary policy changes and their impacts on output, employment, and inflation.
2. It outlines the session, which will cover the impact of interest rate changes on other interest rates, consumption, and investment.
3. It provides brief definitions and discussions of consumption and investment, and how monetary policy influences them through several channels like interest rates, asset prices, and exchange rates.
4. It notes that monetary policy is likely to influence aggregate demand in various ways and that the relationship between interest rates and aggregate demand is complex, being influenced by expectations and time
Demand Forecasting in the restaurant managementErichViray
Demand forecasting predicts future sales trends based on current demand determinants. It is important for business planning purposes. There are several key steps to demand forecasting including determining the objective, nature of goods, appropriate forecasting method, and interpreting results. The period, level, purpose, product type, and other factors must be defined. Demand forecasts help businesses fulfill objectives, prepare budgets, stabilize production and employment, expand, make decisions, and evaluate performance. They are significant for both short and long-term business planning.
Introduction toDemand Forecasting part oneErichViray
This document discusses demand forecasting, including its meaning, purpose, scope, methods, and significance. Demand forecasting predicts future sales trends based on current demand determinants. It is used for both short-term and long-term planning purposes. Determining the appropriate scope involves factors like the forecast period, level, purpose, product type, and relevant demand factors. The forecasting process involves identifying objectives, evaluating the product type, selecting a forecasting method, and interpreting results. Accurate demand forecasts are important for fulfilling objectives, budgeting, production planning, expansion decisions, and performance evaluation.
The document discusses macroeconomic analysis and its relationship to security markets. It examines key macroeconomic variables like economic activity, inflation, interest rates, and how they impact markets. Several approaches to macroeconomic forecasting are described, including using cyclical indicators and monetary variables to analyze the economy and predict stock prices. The phases of the business cycle - expansion, peak, recession, and trough - are also summarized.
Management involves working with people and resources to achieve organizational goals efficiently. Economics studies how limited resources are allocated given unlimited wants. Managerial economics applies economic concepts to business problems to make rational decisions. It analyzes market structures like perfect competition and monopoly. Inflation and unemployment affect businesses through impacts on costs, demand, and labor markets. Fiscal and monetary policies influence macroeconomic variables.
Managerial economics applies microeconomic theory to solve practical business problems. It helps managers make optimal decisions regarding pricing, production, costs, profits, and resource allocation. A managerial economist studies both macroeconomic trends and a firm's internal environment to advise on issues like investment, pricing, market analysis, and policy impacts. Their goal is to help businesses operate efficiently and maximize profits within the economic conditions.
The document discusses the model-building process for a market-timing model. It describes including various types of indicators such as internal/price-based, external/macroeconomic, sentiment, valuation, monetary, and momentum. These indicators are tested individually and combined to form a composite reading. The composite reading can then be used to guide asset allocation decisions in a disciplined and objective manner. The goal is to create a stable, predictable model that avoids emotional decisions and captures risk and reward signals.
This document provides an overview of business economics. It begins by defining economics and introducing some basic concepts. It then discusses the nature of business economics, noting that it is based on microeconomics but also incorporates elements of macroeconomic analysis. It is both a science and an art. The document outlines the scope of business economics, including demand analysis, production/cost analysis, inventory management, market structure/pricing, and more. It also discusses objectives, roles, related disciplines like micro/macroeconomics, economic systems, and applications of economics concepts.
Fundamental analysis attempts to predict a security's intrinsic value by analyzing factors like the economy, industry, and company. This document discusses economic analysis, which is one part of fundamental analysis. It involves studying macroeconomic factors like GDP, fiscal policy, monetary policy, saving rates, trade deficits, and exchange rates to understand how changes in the economy could impact companies and stock prices. Understanding economic analysis provides valuable insight into future business performance and the direction of capital markets.
Fundamental analysis attempts to predict a security's intrinsic value by analyzing external factors that influence a company. This document discusses economic analysis, which is one part of fundamental analysis. Economic analysis studies macroeconomic factors like GDP, fiscal policy, monetary policy, trade balances, and exchange rates to understand their impact on companies and market prices. A strong economy with growing GDP, supportive fiscal/monetary policies, and stable currency rates is generally beneficial for companies and stock prices.
This document provides information about demand forecasting and estimation techniques. It begins with an overview of why forecasting is important for strategic planning, finance, marketing, and production. It then discusses different forecasting techniques like using historical data, test markets, and statistical methods. It covers how forecasting impacts inventory management and considerations like accuracy over long time periods and unforeseen factors. Overall, the document outlines the purpose and importance of demand forecasting for business decision making, as well as various techniques and their pros and cons.
The document provides an overview of fundamental analysis with a focus on economy analysis. It discusses [1] analyzing key macroeconomic indicators like GDP, inflation, interest rates to evaluate the overall economic environment; [2] assessing specific industries based on factors like demand, competition and government policy; and [3] examining individual companies considering internal issues like management and operations. It also outlines several techniques for economic forecasting, including anticipatory surveys, indicator approaches, econometric modeling and opportunistic modeling.
The document discusses the efficient market hypothesis (EMH), which states that current stock prices fully reflect all available information. Under EMH, it is impossible for investors to consistently outperform the market because stock prices adjust rapidly to new information. However, some evidence suggests markets are not always efficient, as seen in crashes not explained by economic changes. While published reports may be reflected in prices already, the EMH remains useful as a benchmark for understanding market behavior.
Macroeconomic Trends - Impact on Investment Decision ProcessVeronica Lopez-Lopez
This document discusses the importance of considering macroeconomic trends and projections when making investment decisions. It notes that macroeconomics uses aggregated statistics to measure economy-wide phenomena, but conclusions are not widely accepted due to disagreements among macroeconomists on measurement and predictions. The document advises that investors should study basic economics and macroeconomic indicators to better understand market movements, but also be careful as macroeconomic analysis has limitations and the data requires contextualization before being used to inform decisions. Overall, the document emphasizes that macroeconomic developments provide important context for investors, but microeconomic fundamentals and analysis remain core tools.
The document defines money laundering and describes the process. It involves disguising illegally obtained money to make it appear legitimate. There are three stages: placement, layering, and integration. Money laundering has significant negative effects, including increased organized crime, corruption, and economic distortions. It undermines legitimate businesses and financial stability. The document then outlines the various financial institutions and businesses that may be involved in money laundering, such as banks, money services businesses, casinos, and professional gatekeepers like lawyers and accountants.
The document discusses commodities markets and futures/forwards contracts. There are two main categories of commodities - hard commodities like gold and oil that must be mined/extracted, and soft commodities like agricultural products. Most commodity trading involves futures contracts, which are exchange-traded forward contracts. A futures contract establishes the price today for buying or selling an asset in the future. While delivery occurs if a contract is held to expiration, most parties offset their positions before expiration to avoid delivery.
Communication involves a sender encoding a message and transmitting it through a channel to a recipient who decodes the message. Effective communication requires the recipient to understand the message similarly to how the sender intended. There can be barriers at each stage of the communication process that cause misunderstandings. Some key parts of communication include the sender, message, and recipient. Nonverbal cues and active listening are also important for fully understanding messages.
Individual financial advisory with respect to individual clients has occupied center stage especially due to the attendant effects of the global COVID-19 pandemic. Clients as well as advisors have had to react to these changes.
This is the first part of a two part presentation that will assist advisors/ individual wealth managers anticipate and react/address client management in a customised manner.
This document outlines the key components of organizational customer relationship management (CRM), including verbal communication, internet, email, advertising, telephone, marketing, data classification, data entry into organizational databases, data collection and analysis, and information dissemination across an organization to support sales and marketing management.
The document discusses various ratios used for risk analysis and valuation of companies. It defines ratios that measure asset coverage, capital structure, profitability, debt levels, cash flows, earnings, market values and preferred share quality. Specific ratios covered include asset coverage, debt-to-equity, interest coverage, preferred dividend coverage, return on equity, price-earnings and book value per share. The purpose, calculation and interpretation of these ratios are explained.
1) Buying call options provides the right to purchase the underlying asset at a specified strike price within a specified time period. Call buyers pay a premium to the option writer for this right.
2) Strategy #1 involves buying calls to speculate on a rise in the underlying asset's price, allowing the option to be sold at a profit. Strategy #2 involves buying calls to manage risk by establishing a maximum purchase price when buying the underlying asset.
3) Both strategies rely on the underlying asset rising above the strike price for the call to have value. If it remains below the strike price, the calls can expire worthless.
1) Buying call options allows investors to speculate on a rise in the price of the underlying stock or manage risk. The buyer pays a premium for the right to purchase the stock at a set strike price.
2) Strategy #1 involves buying calls to speculate, paying $1,000 in premiums for calls with a $55 strike price hoping to sell them at a profit if the stock rises above $55 before expiration.
3) Strategy #2 involves buying calls to manage risk, protecting a fund manager's planned stock purchase from increases above the $55 strike price before receiving funds in December.
Describes what derivatives are and explains the differences between over-the-counter and exchange traded derivatives, Identifies types of underlying assets on which derivatives are based, describes participants in and uses of derivative trading, describe what options are and how they are traded, evaluates call and put option strategies for
individual and in-stitutional investors and corporations, describes what forwards are, distinguishing futures contracts from forward agreements, evaluate futures strategies for investors and corporations, Define and describe rights and warrants, explain why they are issued, and calculate the value of rights and warrants
Understanding for Incorporation, client bias diagnoses into the enhanced marketing and sales of investment products whilst, building mutual and beneficial long-term relationships.
This document discusses asset allocation strategies and investment philosophies for clients. It describes strategic asset allocation (SAA) as establishing a long-term benchmark portfolio based on a client's objectives and risk tolerance. SAA involves specifying asset classes, expected returns, and deriving an efficient portfolio. Tactical asset allocation allows short-term adjustments within SAA limits. Asset allocation is also discussed in the context of a client's accumulation stage in life. The document also contrasts passive indexing strategies with active investment strategies using bottom-up or top-down approaches.
Fortuna Favi Et Fortus Ltd provides custom training and skills upgrades to clients to enhance business growth. Benefits include knowledge additions that improve job performance and prepare staff for increased responsibilities. Understanding client biases, personalities, and investment objectives is key to managing relationships and achieving goals. A thorough investment policy statement that incorporates a client's unique situation and needs allows for customized portfolio allocation and management. Considering a client's stage in life cycle planning provides strategic guidance for asset accumulation tailored to their goals.
World economy charts case study presented by a Big 4
World economy charts case
World economy charts case study presented by a Big 4
World economy charts case study presented by a Big 4World economy charts case study presented by a Big 4
World economy charts case study presented by a Big 4
World economy charts case study presented by a Big 4World economy charts case study presented by a Big 4World economy charts case study presented by a Big 4World economy charts case study presented by a Big 4World economy charts case study presented by a Big 4World economy charts case study presented by a Big 4World economy charts case study presented by a Big 4World economy charts case study presented by a Big 4World economy charts case study presented by a Big 4World economy charts case study presented by a Big 4World economy charts case study presented by a Big 4World economy charts case study presented by a Big 4World economy charts case study presented by a Big 4World economy charts case study presented by a Big 4study presented by a Big 4
MUTUAL FUNDS (ICICI Prudential Mutual Fund) BY JAMES RODRIGUESWilliamRodrigues148
Mutual funds are investment vehicles that pool money from multiple investors to purchase a diversified portfolio of stocks, bonds, or other securities. They are managed by professional portfolio managers or investment companies who make investment decisions on behalf of the fund's investors.
The E-Way Bill revolutionizes logistics by digitizing the documentation of goods transport, ensuring transparency, tax compliance, and streamlined processes. This mandatory, electronic system reduces delays, enhances accountability, and combats tax evasion, benefiting businesses and authorities alike. Embrace the E-Way Bill for efficient, reliable transportation operations.
Cleades Robinson, a respected leader in Philadelphia's police force, is known for his diplomatic and tactful approach, fostering a strong community rapport.
ZKsync airdrop of 3.6 billion ZK tokens is scheduled by ZKsync for next week.pdfSOFTTECHHUB
The world of blockchain and decentralized technologies is about to witness a groundbreaking event. ZKsync, the pioneering Ethereum Layer 2 network, has announced the highly anticipated airdrop of its native token, ZK. This move marks a significant milestone in the protocol's journey, empowering the community to take the reins and shape the future of this revolutionary ecosystem.
Methanex is the world's largest producer and supplier of methanol. We create value through our leadership in the global production, marketing and delivery of methanol to customers. View our latest Investor Presentation for more details.
2. Overview of Analysis Methods
• Fundamental Analysis
• Quantitative Analysis
• Technical Analysis
• Market Theories
Efficient market hypothesis
Random walk theory
Rational expectations hypothesis
Fundamental Macroeconomic Analysis
• The Fiscal Policy Impact
• The Monetary Policy Impact
• The Flow of Funds Impact
• The Inflation Impact
3. Fundamental Industry Analysis
• Classifying Industries by Product or Service
• Classifying Industries by Stage of Growth
• Classifying Industries by Competitive Forces
• Classifying Industries by Stock Characteristics
Fundamental Valuation Models
• Dividend Discount Model
• Using the Price-Earnings Ratio
Technical Analysis
• Comparing Technical Analysis to Fundamental Analysis
• Commonly Used Tools in Technical Analysis
4. Analysis Methods
• A great deal of information is available when making an
investment decision. There is market and economic, data,
stock charts, industry and company characteristics, and a
wealth of financial statistical data. there are different
branches of analysis which helps to organize the
information.
• Fundamental analysis
• Quantitative analysis
• Technical analysis
There is a need for a clear understanding of what the
techniques measure, how they are determined, and how
they are interpreted.
5. This involves a study of everything, other than the trading
on the securities markets, which can have an affect on a
security’s value: macroeconomic factors, industry
conditions, individual company financial conditions, and
qualitative factors such as management performance.
Fundamental analysis pays attention to a company’s
debt/equity ratio, profit margins, dividend payout, earnings
per share, sales penetration, market share, interest, asset and
dividend coverages, product or marketing innovation, and
the quality of its management.
Fundamental Analysis
6. The most important single factor affecting the price of a
corporate security is the actual or expected profitability of
the issuer.
E.g., are profits sufficient to service debt, to pay current
dividends, or to pay larger dividends?
Fundamental Analysis
7. The study of interest rates, economic variables, and industry
or stock valuation using computers, databases, statistics and
an objective, mathematical approach to valuation.
There is a search for patterns and the reasons behind these
patterns in order to identify and profit from anomalies in
valuation.
Quantitative techniques often use statistics to determine the
likelihood of a particular investment outcome.
Quantitative Analysis
8. Studies historical stock prices and stock market behaviour
to identify recurring patterns in the data. The process
requires large amounts of information, can be time
consuming and cumbersome.
Technical analysts study price movements, trading
volumes, and data on the number of rising and falling
stock issues over time looking for recurring patterns that
will allow them to predict future stock price movements.
Technical Analysis
9. It is believed that by studying the “price action” of the
market, analysts can have better insights into the emotions
and psychology of investors. The contention is - because
most investors fail to learn from their mistakes, identifiable
patterns exist. Factors such as mass investor psychology
and the influence of program trading affects market prices.
E.g., Greed can force prices to rise to a level far higher than
warranted by anticipated earnings. Also, uncertainty can
cause investors to overreact to news and sell quickly,
causing prices to drop suddenly.
Technical Analysis
10. Market Theories - Financial
Three theories are applicable in providing explanations of
the behavior of stock markets. They are:
• Efficient market hypothesis
• Random walk theory
• Rational expectations hypothesis
11. Efficient Market Hypothesis
Assumes that profit-seeking investors in the marketplace
react quickly to the release of new information.
As new information about a stock appears, investors
reassess the intrinsic value of the stock and adjust their
estimation of its price accordingly.
Therefore, at any given time, a stock’s price fully reflects all
available information and represents the best estimate of
the stock’s true value.
12. Random Walk Theory
Postulation that new information concerning a stock is
disseminated randomly over time. Therefore, price
changes are random and bear no relation to previous price
changes.
If this is true, then past price changes contain no useful
information about future price changes because any
developments affecting the company have already been
reflected in the current price of the stock.
13. Rational Expectations Hypothesis
Assumes that people are rational and make intelligent
economic decisions after weighing all available
information. It also assumes people have access to
necessary information and will use it intelligently in their
own self-interest.
Thus, past mistakes can be avoided by using the
information to anticipate change.
14. Market Theories: Summary
The efficient market hypothesis, the random walk theory
and the rational expectations hypothesis all suggest that
stock markets are efficient.
But studies exist that support these theories but also support
the existence of market in efficiencies. E.g., it is unlikely
that:
• New information is available to everyone at the same time
• All investors react immediately to all information in the
same way
• All investors make accurate forecasts and correct
decisions.
15. E.g., investors do not react in the same way to the similar
information. Some may buy a security at a certain price
hoping to receive income or make a capital gain and
another sell for profit.
Also, not everyone can make accurate forecasts and
correct valuation decisions.
Market Theories: Summary
17. Macro-economic Factors
Investor expectations and the prices of securities can be
influenced by a myriad of factors. This factors can be
grouped under the following:
• Fiscal Policy
• Monetary Policy
• International Factors e.g. war, unexpected election
results, regulatory changes, technological innovation
etc.
• Business Cycles
18. Definitions
Fiscal Policy: The policy pursued by the federal government
to influence economic growth through the use of taxation
and government spending to smooth out/ influence
fluctuations of the business cycle. Or means by which a
government adjusts its spending levels and tax rates to
monitor and influence a nation's economy.
Monetary Policy: Deliberate manipulation/regulation of
the demand and supply of money in order to influence the
economy or Economic policy designed to improve the
performance of the economy by regulating money supply
and credit.
19. • Yield Curve: A graph showing the relationship between
yields of bonds of the same quality but different
maturities.
A normal yield curve is upward sloping depicting the
fact that short-term money usually has a lower yield
than longer-term funds. When short-term funds are
more expensive than longer term funds the yield curve
is said to be inverted.
Definitions
20. Fiscal Policy & Its Impact
The two most important tools of fiscal policy are levels of
government expenditures and taxation because they affect
overall economic performance and influence the
profitability of individual industries.
• Tax Changes: governments can alter the spending power
of individuals and businesses.
An increase in sales or personal income tax leaves
individuals with less disposable income, which curtails
their spending; a reduction in tax levels increases net
personal income and allows them to spend more.
21. Tax Changes (contd)
• Higher taxes on profits, generally speaking, reduce the
amount businesses can pay out in dividends or spend on
expansion. Increases in corporate taxes also limit
companies’ incentive to expand by lowering after-tax
profit levels.
It is noteworthy to mention that several factors limit the
effectiveness of fiscal policy.
E.g., the time-lag between the time fiscal action is taken
and the time taken for the action to affect the economy.
Fiscal Policy & Its Impact
22. • Government Spending: can influence aggregate spending
in the economy by increasing or decreasing government
spending on goods, services and capital programs. - an
increase in government spending stimulates the economy
in the short run, while a cutback in spending has the
opposite effect.
Equally, tax increases lower consumer spending and
business profitability, while tax cuts boost profits and
common share prices and thereby spur the economy.
Also, Import quotas and tariffs have been used to shield
domestic shoe, clothing and automobile producers from
foreign competition.
Fiscal Policy & Its Impact
23. • Government Debt: Fiscal and monetary policy choices
affect the general level of interest rates, the rate of
economic growth and the rate of corporate profit growth,
and all of them affect the valuation of stocks. With high
levels of government and consumer indebtedness, the
government’s ability to reduce taxes or increase
government spending is impaired.
Presently, consumer debt is at record-high levels as
consumers have been spending more and saving less.
This could have the long-term effect of increasing
interest rates and dampening future economic growth.
Fiscal Policy & Its Impact
24. Monetary Policy & Its Impact
The CBN is responsible for maintaining the external value
of the Naira and encouraging real, sustainable economic
growth by keeping inflation low, stable and predictable.
If these goals are threatened, the bank should take
corrective action by influencing the rate of monetary
growth and encourage interest rates to reflect the change.
If, during a period of economic expansion, demand for
credit grows and prices move upwards too quickly, the
Bank of Canada will try to lessen the pressure by
restraining the rate of growth of money and credit.
This usually leads to higher short-term interest rates.
25. On the other hand, if the economy appears to be slowing
down, the CBN may pursue an easier monetary policy that
increases the money supply and the availability of credit,
leading to lower short-term interest rates.
Changes in monetary policy affect interest rates and
corporate profits, the two most important factors affecting
the prices of securities.
Thus, market participants try to gauge the impact of each
piece of economic news
Monetary Policy & Its Impact
26. Monetary Policy And The Bond Market
When economic growth begins to accelerate, bond yields
rise rapidly, thereby tempering higher inflation.
If nothing is done nothing to calm the bond market’s fear of
inflation, then bond yields may soar, possibly leading to a
crisis in debt markets affecting Billions of dollars of debt.
Thus steps must be taken to raise short-term interest rates to
slow economic growth and contain inflationary pressures.
This may lead to a more moderate economic growth rate or
even a growth recession (a temporary slowdown in
economic growth that does not lead to a full recession).
27. If long-term rates now fall while short-term rates rise, then
the bond market might temporarily be signaling its
approval of the degree of economic slowing.
E.g, if short term interest rates is raised to slow down
economic growth and bond yields fall simultaneously,
reflecting the perceived success of this policy, then the
balance between economic growth and the needs of the
bond market would have been maintained.
Monetary Policy And The Bond Market
28. Monetary Policy & The Yield Curve
When long-term bond yields fall while short-term rates rise,
this is called an inverting or a tilting of the yield curve. It
suggests a temporary reprieve from short-term interest rate
pressure and less competition for equities from the level of
bond yields. The general process is:
• Rapidly rising bond yields cause a collapse in bond
prices. (Recall the inverse relationship between bond
prices and yields.)
• As short-term interest rates rise, the rate at which bond
yields increase slows down.
29. • As this rise in short-term rates continues, the economy
usually slows, bonds begin to stabilize and briefly fall
less than equities. This is due to the fact that a slowing of
economic growth benefits bonds at the expense of stocks.
• Suddenly, with each short-term interest rate increase, the
long-term rate begins to fall. This is crucial evidence that
the bond market is satisfied with the slowing of economic
growth.
A decline in long-term rates not only reduces competition
between equities and bonds, it may also result in lower
short-term rates.
Monetary Policy & The Yield Curve
30. On the other hand, higher real bond yields over time
increase the degree of competition between bonds and
equities and slowly undermine equity markets.
A tilting yield curve is, however, very different from
periods in which the whole yield curve is falling, as it
does in the late stages of a recession.
Monetary Policy & The Yield Curve
31. The Flow Of Funds Impact
When the relative valuation of stocks and bonds or stocks
and T-bills changes, capital flows from one asset class to
the other.
These flows are determined largely by shifts in the
demand for stocks and bonds on the part of Nigerian retail
and institutional investors and of foreign investors. These
shifts are caused largely by changes in interest rate levels.
However, understanding why these shifts occur is
important to determining if a rise or fall in stock market
levels is sustainable.
32. • Net Purchases Of Nigerian Equity Mutual Funds: Net
purchases of Canadian equity mutual funds influence the
TSX. Falling interest rates tend to improve the value of
stocks relative to bonds, equity mutual fund purchases
should rise as interest rates fall.
• Non-resident Net Purchases: the direction of the
markets is also influenced by new demand by foreign
investors for Nigerian stocks and bonds. Foreign
investors tend to view an appreciating market and a
strengthening currency as good reasons to buy that
country’s stocks.
The Flow Of Funds Impact
33. The Inflation Impact
Widespread uncertainty and lack of confidence in the future
is what inflationary conditions create. These factors tend to
result in higher interest rates, lower corporate profits, and
lower price-earnings multiples.
Thus, there is an inverse relationship between the rate of
inflation and price-earnings multiples.
Inflation also means higher inventory and labour costs for
manufacturers which is usually passed on to the final
consumer in the form of higher prices. This cannot be done
indefinitely for consumer resistance develops, reducing
corporate profits.
35. Fundamental Industry Analysis
It is believed that industry and company profitability has
more to do with industry structure than with the product
that an industry sells.
Industry structure results from the strategies that companies
pursue relative to their competition. Companies pursue
strategies that they feel will give them a sustainable
competitive advantage and lead to long-term growth.
Pricing strategies and company cost structures affect not
just long-term growth, but the volatility of sales and
earnings.
36. Therefore, industry structure affects a company’s stock
valuation. It is a framework that can easily be applied to
virtually every industry.
This framework can be applied to virtually every industry.
Investors and investment analysts rely on research
departments and other sources of information on industry
structure.
Thus, industries can be classified by Product or Service,
Stage Of Growth, Competitive Forces and Stock
Characteristics,
Fundamental Industry Analysis
37. Industry Classification by Product or Service
Most industries are identified by the product or service they
provide. E.g., U.S. market has about 90 different industry
groups.
However, an astute investor can understand the competitive
forces within an industry by classifying industries based on
their prospects for growth and their degree of risk.
These two factors help determine stock values.
38. • Estimating Growth: involves the study of an industry’s
reported revenues and unit volume sales over the last
several years, preferably over more than one business
cycle. Three key questions should be asked:
How does the growth in sales compare with the rate of
growth in nominal Gross Domestic Product (GDP)?
How does the rate of change in real GDP compare with
the industry’s rate of change in unit volumes?
How does the industry’s price index compare with the
overall rate of inflation?
Industry Classification by Product or Service
39. • Estimating Growth contd
An extension of this approach to all companies in the same
industry should enable an assessment of how effectively any
one company is competing.
E.g., For example, is the company acquiring a growing share
of a growing industry, a growing share of a stable industry, a
growing share of a declining industry or a declining share of
a declining industry?
Also, a company’s revenues result from a combination of
the prices they charge and the volume of unit sales. Revenue
growth may result from higher prices or increased sales
volume.
Industry Classification by Product or Service
40. • Estimating Growth contd
Is recent revenue growth improving? How stable are prices
or volume?
The degree of stability is also important in understanding the
degree of investment risk and the possible timing of the
investment during a business cycle.
Industry Classification by Product or Service
41. • Laws Of Survivorship: All industries exhibit a life-cycle
characterized by Initial or Emerging Growth, Rapid
Growth, Maturity and Decline. But length of each stage
varies from industry to industry and from company to
company.
Each stage in the industry life cycle affects the
relationship between a firm’s pricing strategies and its
unit cost structure, as sales volume grows or declines.
Often, as the size of a market increases, a decline in unit
costs occurs due to economies of scale. These may result
from experience gained in production or volume price
discounts for raw materials used in production.
Industry Classification by Product or Service
42. Companies constantly strive to establish sustainable
competitive advantage, and firm usually become either:
• A low-cost producer capable of withstanding price
competition and otherwise generating the highest
possible profit margins; or
• A producer of a product that has real or perceived
differences from existing products. These differences
may make it possible to achieve higher profit margins
while avoiding intense price competition.
Industry Classification by Product or Service
43. Smaller market segments or niches are left un-serviced by
firms who focus on either of these strategies are usually
filled by smaller, specialized companies, known as niche
players.
Industry Classification by Product or Service
44. Classifying Industries By Stage Of Growth
• Emerging Growth Industries: New products or services
are being developed at all times to meet evolving needs
and demands- e.g., rapid innovation is particularly
evident in software and hardware development in the
computer industry.
Emerging growth industries may not always be directly
accessible to equity investors if privately owned
companies dominate the industry, or if the new product or
service is only one activity of a diversified corporation.
They maybe unprofitable at first, although future
prospects may appear promising. Large start-up
investments may even lead to negative cash flows.
45. • A growth industry - one in which sales and earnings are
consistently expanding at a faster rate than most other
industries. - these industries are referred to as growth
companies and their common shares as growth stocks.
They should have an above-average rate of earnings on
invested capital over a period of several years. It should
also be possible for the company to continue to achieve
similar or better earnings on additional invested capital,
showing increasing sales in terms of both Naira and units,
with a firm control of costs. Usually they have able,
aggressive managements willing to take risks with use of
capital.
Classifying Industries By Stage Of Growth
46. • There might be substantial spending on research to
develop new products. During the rapid growth period,
companies that survive lower their prices as their cost of
production declines and competition intensifies. Much of
their expansion is with the use of retained earnings – not
paying out large dividends. Investors are usually willing
to pay more for securities that promise growth of capital
i.e. growth securities are characterized by relatively high
price-earnings ratios and low dividend yields. They have
an above average risk of a sharp price decline if, the
marketplace comes to believe that future growth will not
meet expectations.
Classifying Industries By Stage Of Growth
47. • Mature Industries: characterized by a dramatic slowing
of growth to a rate that more closely matches the overall
rate of economic growth. Both earnings and cash flow
tend to be positive, but within the same industry, it is
more difficult to identify differences in products between
companies.
Price competition increases, profit margins usually fall,
and companies may expand into new businesses with
better prospects for growth.
Usually they experience slower, more stable growth rates
in sales and earnings.
Classifying Industries By Stage Of Growth
48. Mature Industries contd:
Though their share prices are not immune to decline, during
recessions, stable growth companies usually demonstrate a
decline in earnings that is less than that of the average
company.
Classifying Industries By Stage Of Growth
49. • Declining Industries: As industries move from the stable
to the declining stage, they tend to grow at rates
comparable to overall economic growth rate, or they stop
growing and begin to decline.
They produce products for which demand has declined
due to changes in technology, an inability to compete on
price, or changes in consumer tastes.
Cash flow may be large, because there is no need to invest
in new plant and equipment.
At the same time, profits may be low.
Classifying Industries By Stage Of Growth
50. According to M. Porter, there are five basic competitive
forces determine the attractiveness of an industry and the
changes that can drastically alter the future growth and
valuation of companies within the industry. These are:
• Ease of entry for new competitors to that industry
• Degree of competition between existing firms
• Potential for pressure from substitute products
• Extent to which buyers of the product or service can put
pressure on the company to lower prices:
Classifying Industries By Competitive Forces
51. • The extent to which suppliers of raw materials or inputs
can put pressure on the company to pay more for these
resources; these costs affect profit margins or product
quality.
Thus, companies can thrive only if they meet customers’
needs. Therefore, profit margins can be large only if
customers receive enough perceived value.
Classifying Industries By Competitive Forces
52. Classifying Industries By Stock Characteristics
Industries can be broadly classified as either Cyclical or
Defensive.
Few, if any, industries are immune from the adverse effects
of an overall downturn in the business cycle, but the term
cyclical applies to industries in which the effect on earnings
is most pronounced.
• Cyclical Industries: They usually are sensitive to global
economic conditions, swings in the prices of international
commodities markets, and changes in the level of foreign
exchange. When business conditions are improving,
earnings tend to rise dramatically.
53. Cyclical Industries contd
Interest expenses on the debt of cyclical industries can
accentuate these swings in earnings. Cyclical industries fall
into three main groups:
• Commodity basic cyclical, such as forest products, mining,
and chemicals
• Industrial cyclical, such as transportation, capital goods,
and basic industries (steel, building materials)
• Consumer cyclical, such as merchandising companies and
automobiles
Classifying Industries By Stock Characteristics
54. Cyclical Industries contd
• Most cyclical industries benefit from a declining Naira
value, since this makes their exportable products
cheaper for international buyers.
Classifying Industries By Stock Characteristics
55. • Defensive Industries: they have relatively stable return
on equity (ROE) and tend to do well during recessions.
this category includes blue-chip and income stocks.
These are actually overlapping categories.
For example, the term blue-chip denotes shares of top
investment quality companies, which maintain earnings
and dividends through good times and bad. This record
usually reflects a dominant market position, strong
internal financing and effective management.
Classifying Industries By Stock Characteristics
56. • Speculative Industries: Though all investment in
common shares involves some degree of risk because of
ever-changing stock market values, the word speculative
is usually applied to industries (or share) in which the risk
and uncertainty are unusually high due to a lack of
definitive information - Emerging industries are often
considered speculative.
Profit potential of a new product or service attracts many
new companies and initial growth may be rapid. But a
shakeout occurs and many of the original participants are
forced out of business as the industry consolidates and a
few companies emerge as the leaders.
Classifying Industries By Stock Characteristics
57. Speculative Industries contd
The term speculative can also be used to describe any
company, even a large one, if its shares are treated as
speculative.
E.g, shares of growth companies can be bid up to high
multiples of estimated earnings per share as investors
anticipate continuing exceptional growth. Should investors
begin to doubt expectations, the price of the stock will fall.
Thus, investors are “speculating” on the likelihood of
continued future growth which ‘may’, not materialize
Classifying Industries By Stock Characteristics
58. • Return On Equity (Roe): This ratio is important to
shareholders because it reflects the profitability of their
capital in the business. It is key to understanding/
comparing defensive to cyclical industries. It is calculated
as:
During economic downturns, defensive industries also
demonstrate falling ROE, but their ROE falls less
dramatically than those of cyclical industries.
Classifying Industries By Stock Characteristics
(Net Earnings before extraordinary Items) X 100
Total Equity
59. During economic upturns and periods of prolonged
economic growth, the ROE of defensive industries tends not
to rise as much as that of cyclical industries.
Defensive industries tend to outperform cyclical industries
during recessions. Because the ROE of a cyclical industry
falls faster than the ROE of a defensive industry during
recessions, cyclical stock prices also fall faster.
Thus, stocks with a stable ROE demonstrate defensive price
characteristics. But, during periods of sustained economic
growth, the superior growth in the ROE of cyclical
industries tends to produce superior price performance in
those industries.
Classifying Industries By Stock Characteristics
60. Fundamental Valuation Models
• Dividend Discount Model (DDM): it shows how
companies with stable growth are priced (in theory). It
relates a stock’s current price to the present value of all
expected future dividends into the indefinite future. It
assumes:
– there will be an indefinite stream of dividend
payments, whose present values can be calculated.
– that these dividends will grow at a constant rate (g –
the growth rate in the formula).
61. The discount rate used is the market’s required or
expected rate of return for that type of investment i.e. rate
of return as the return that compensates investors for
investing in that stock, given its perceived riskiness.
Fundamental Valuation Models
62. It is represented in a mathematical formular as:
Where:
• Price is calculated as the current intrinsic value of the
stock in question
• Div0 - dividend paid out in the current year
• Div1 - expected dividend paid out by the company in 1yr
• r is the required rate of return on the stock
• g is the assumed constant growth rate for dividends
Price = Div0 (1+g) = Div1
r-g r-g
Fundamental Valuation Models
63. Example: ABC Company is expected to pay a N1 dividend
next year. It has a constant long-term growth rate (g) of 6%
and a required return (r) of 9%. Based on these inputs, the
DDM will price ABC at a value of:
(N1)/(0.09-0.06) = N33.33
Thus ABC stock has an intrinsic value of N33.33.
Interpretation: If ABC is selling for $25 in the market, the
stock is considered undervalued because it is selling below
its intrinsic value. Alternatively, if ABC is selling for $40,
the stock is considered overvalued because it is selling
above its intrinsic value.
Fundamental Valuation Models
64. It is noteworthy to mention that this is an over simplification
and future stock dividends are not predictable.
Also, a stock does not have a defined maturity, like a bond.
Fundamental Valuation Models
65. Price Earnings Ratio (P/E Ratio)
• Price Earnings Ratio (P/E Ratio): this allows
investors compare a companys’ prospects - a high P/E
ratio suggests a company has strong growth potential.
E.g., assume that earnings growth is constant and that the
rate at which dividends are paid out is constant (the
percentage of earnings paid out as dividends is known as
the dividend payout ratio). Then the price of the stock,
divided by next year’s earnings, will be equal to the
payout ratio divided by r – g, which is the same
denominator used in the DDM calculation.
66. For information purposes the formular is represented below
as it is essential to be able to interpret the ratio.
P/E = Payout Ratio/(r-g)
Given two similar companies that pay out a large proportion
of earnings, the company that can maintain these payout
levels has a more dependable earnings stream.
Therefore, all things being equal, a company with more
stable earnings should have a higher P/E ratio than a similar
type of company with less stable earnings.
Also, a growth company will have a higher P/E only if the
long-run growth rate (g) is expected to accelerate.
Price Earnings Ratio (P/E Ratio)
67. it is assumed that when confidence is high, P/E ratios are
also high, and when confidence is low, P/E ratios are low.
However, P/E levels are strongly inversely related to the
prevailing level of inflation and, therefore, to the prevailing
level of interest rates.
P/Es are volatile, because earnings vary. In some cases,
highly cyclical or economically sensitive companies may
have losses or low levels of earnings that produce unrealistic
or unusable P/Es.
To the extent the market is efficient, a low P/E may result
from the market’s ability to correctly anticipate an imminent
decline in earnings.
Price Earnings Ratio (P/E Ratio)
68. Technical Analysis
It is is the process of analyzing historical market action in
an effort to determine probable future price trends.
Technical analysts focus on the market itself, whether it be
the commodity, equity, interest rate or foreign exchange
market.
They study, and plot on charts, past and present
movements of prices, the volume of trading, statistical
indicators – trying to identify recurrent and predictable
patterns that can be used to predict future price moves.
69. Attempts to probe the psychology of investors collectively
or, i.e. the “mood” of the market. Market action is
dependent on 3 primary sources of information – price,
volume and time. It is based on three assumptions:
• That all influences on market action are automatically
accounted for or discounted in price activity – believing
known market influences are fully reflected in market
prices. That there is little advantage to fundamental
analysis. What is required is to study the price action. i.e.
“Letting the market talk,” -that the market will indicate
the direction and the extent of its next price move.
Technical Analysis
70. • Prices move in trends and those trends tend to persist
for relatively long periods of time. Thus, the primary
task of a technical analyst is to identify a trend in its early
stages and carry positions in that direction until the trend
reverses itself. - not as easy as it may sound.
• The future repeats the past. - belief that markets reflect
investor psychology and that the behavior of investors
tends to repeat itself. Investors tend to fluctuate between
pessimism, fear and panic, and optimism, greed and
euphoria. Comparing investor behavior as reflected in
market action with historical market behavior, the analyst
attempts to make predictions
Technical Analysis
71. Technical Analysis vs. Fundamental Analysis
Main difference: the technician studies the effects of supply
and demand (price and volume), while the fundamental
analyst studies the causes of price movements.
E.g. a fundamental analyst might suggest a bull market in
equities will likely come to an end due to rising interest
rates, a technical analyst would say that the appearance of a
head-and-shoulder top formation indicates a major market
top.
72. Studying fundamentals can give an investor a sense of the
long-term price prospects for an asset as this might be, the
first step in investment decision-making.
But, at the point of deciding when and at what level to enter
or leave a market, technical analysis can serve a vital role,
particularly when investing or trading leveraged investment
products such as futures or options.
Technical Analysis vs. Fundamental Analysis
73. Tools of Technical Analysis
Four main methods used by a technical analyst to identify
trends and possible trend turning points are:
• Chart Analysis – graphs, candlestick charts, line charts,
point and figure charts, reversal & continuation patterns
etc.
• Quantitative Analysis - statistical tools i.e. moving
averages and oscillators, Moving Average Convergence-
divergence (MACD)
• Analysis of Sentiment Indicators – used by contrarian
investors in determining what the majority of investors
expect prices to do in the future
74. • Cycle Analysis- Long-term (<2yrs), Seasonal (1yr),
Primary/intermediate (9 to 26 weeks) and Trading cycles
(four weeks), reflected in the Elliot wave theory that that
there are repetitive, predictable sequences of numbers and
cycles found in nature and similar predictable patterns in
the movement of stock prices.
Additional tools used include:
Volume changes: used to confirm other indicators in
bull/bear markets
Breadth of market: monitors the extent or broadness of a
market trend using the cumulative advance-decline line
Tools of Technical Analysis
75. Summary
• Fundamental analysis focuses on assessing the short-,
medium- and long-range prospects of different industries
and companies to determine how the prices of securities
will change.
• Quantitative analysis involves studying interest rates,
economic variables, and industry or stock valuation using
computers, databases, statistics and an objective,
mathematical approach to valuing a company.
• Technical analysis looks at historical stock prices and
stock market behavior to identify recurring and
predictable price patterns that can be used to predict
future price movements.
76. Fortuna Favi et Fortus Ltd.,
:118 Old Ewu Road, Aviation Estate, Lagos,
:07032530965 www.ffavifortus.com info@ffavifortus.com