The document discusses solar resource measurements and satellite data, focusing on the assessment required for concentrating solar power (CSP) plants, including the importance of direct normal irradiation (DNI) and the associated uncertainties in measurements. It outlines the types of sensors used, such as pyrheliometers and rotating shadowband irradiometers, and details the calibration processes necessary for accurate measurement. The overall emphasis is on the impact of measurement accuracy on plant profitability and the need for precise data for successful project realization.
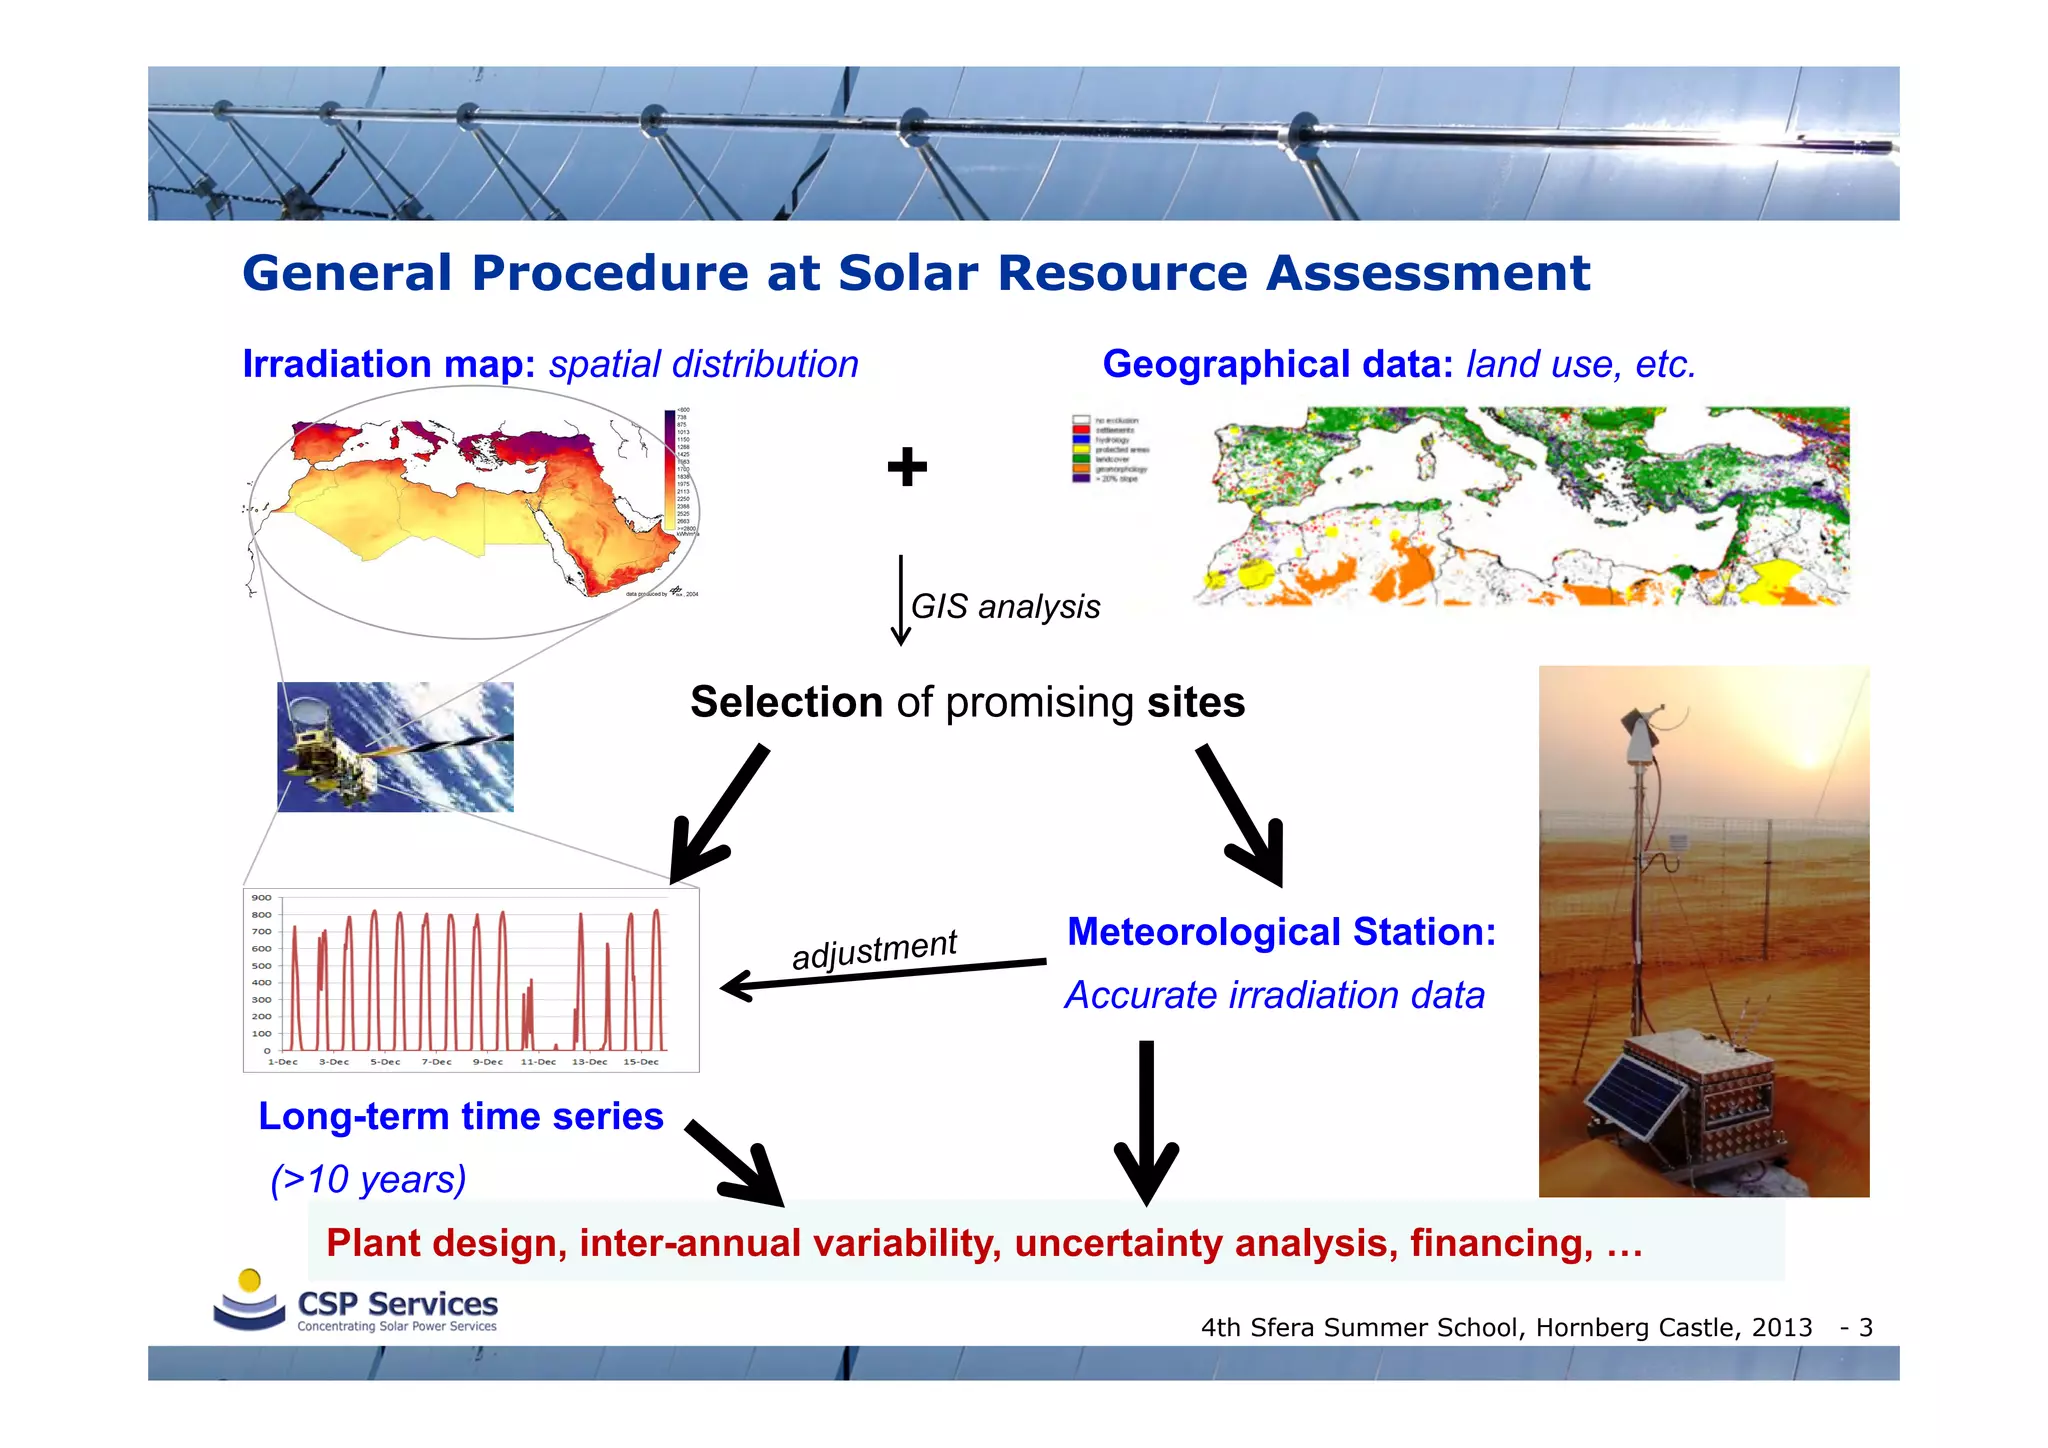
![Results of the satellite-based solar assessment
Time series: for single sites, e.g. hourly, monthly or annual
Hourly DNI [Wh/m²] for one site in Spain
Annual sums of DNI [kWh/m²] for one site in Spain
Monthly sums of DNI [kWh/m²] for one site in Spain
Hourly monthly mean of DNI in Wh/m², Solar Village 2000
hour
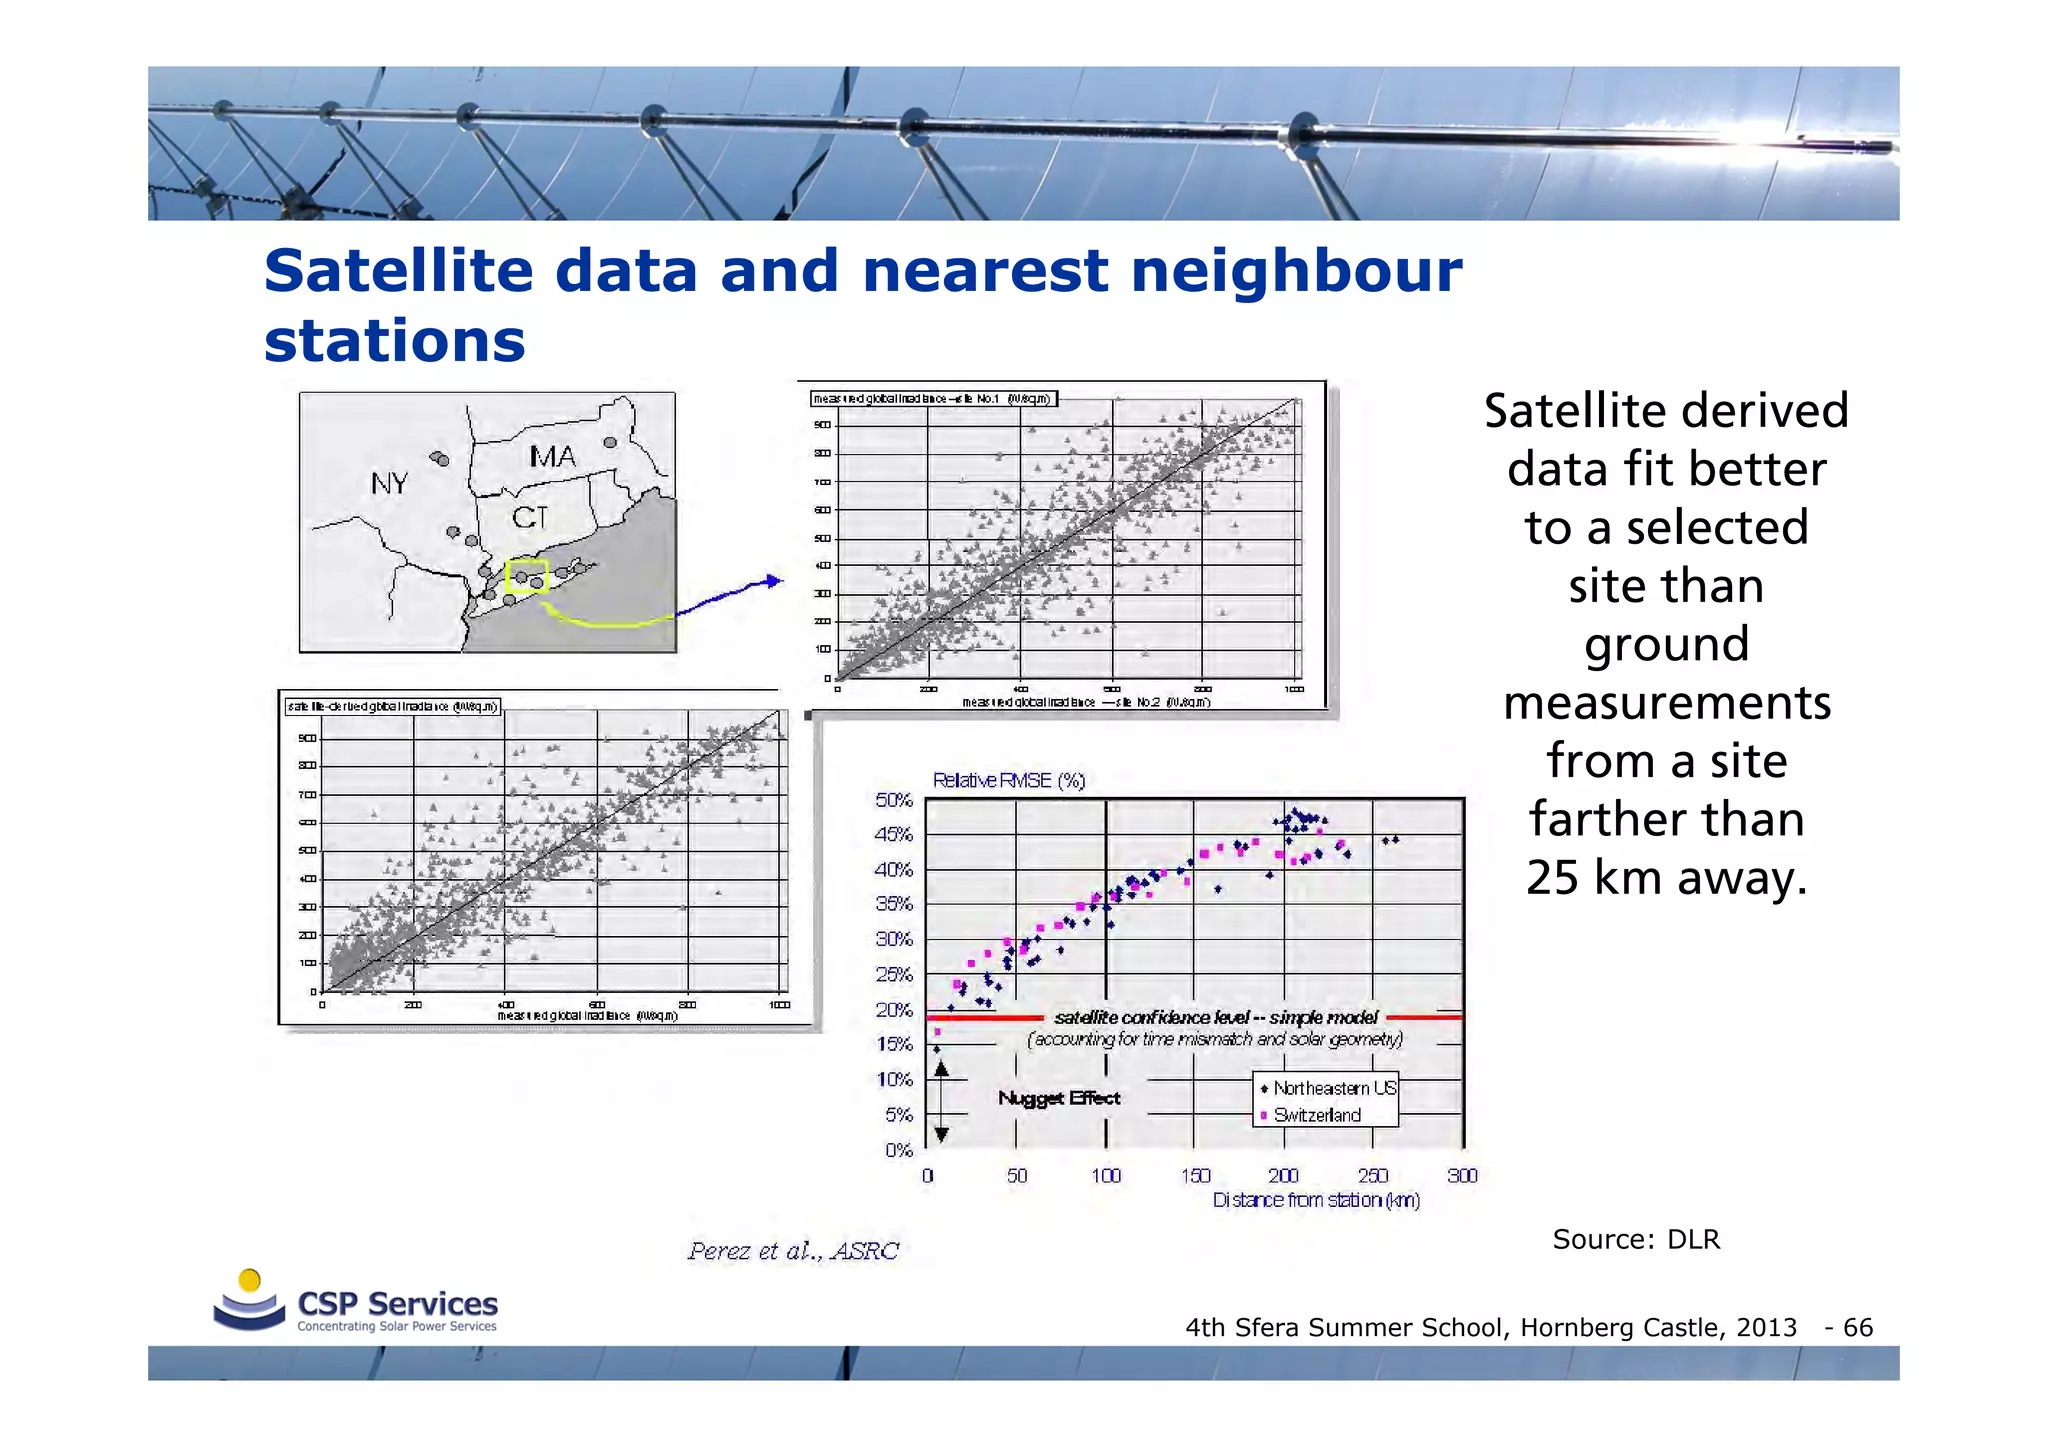
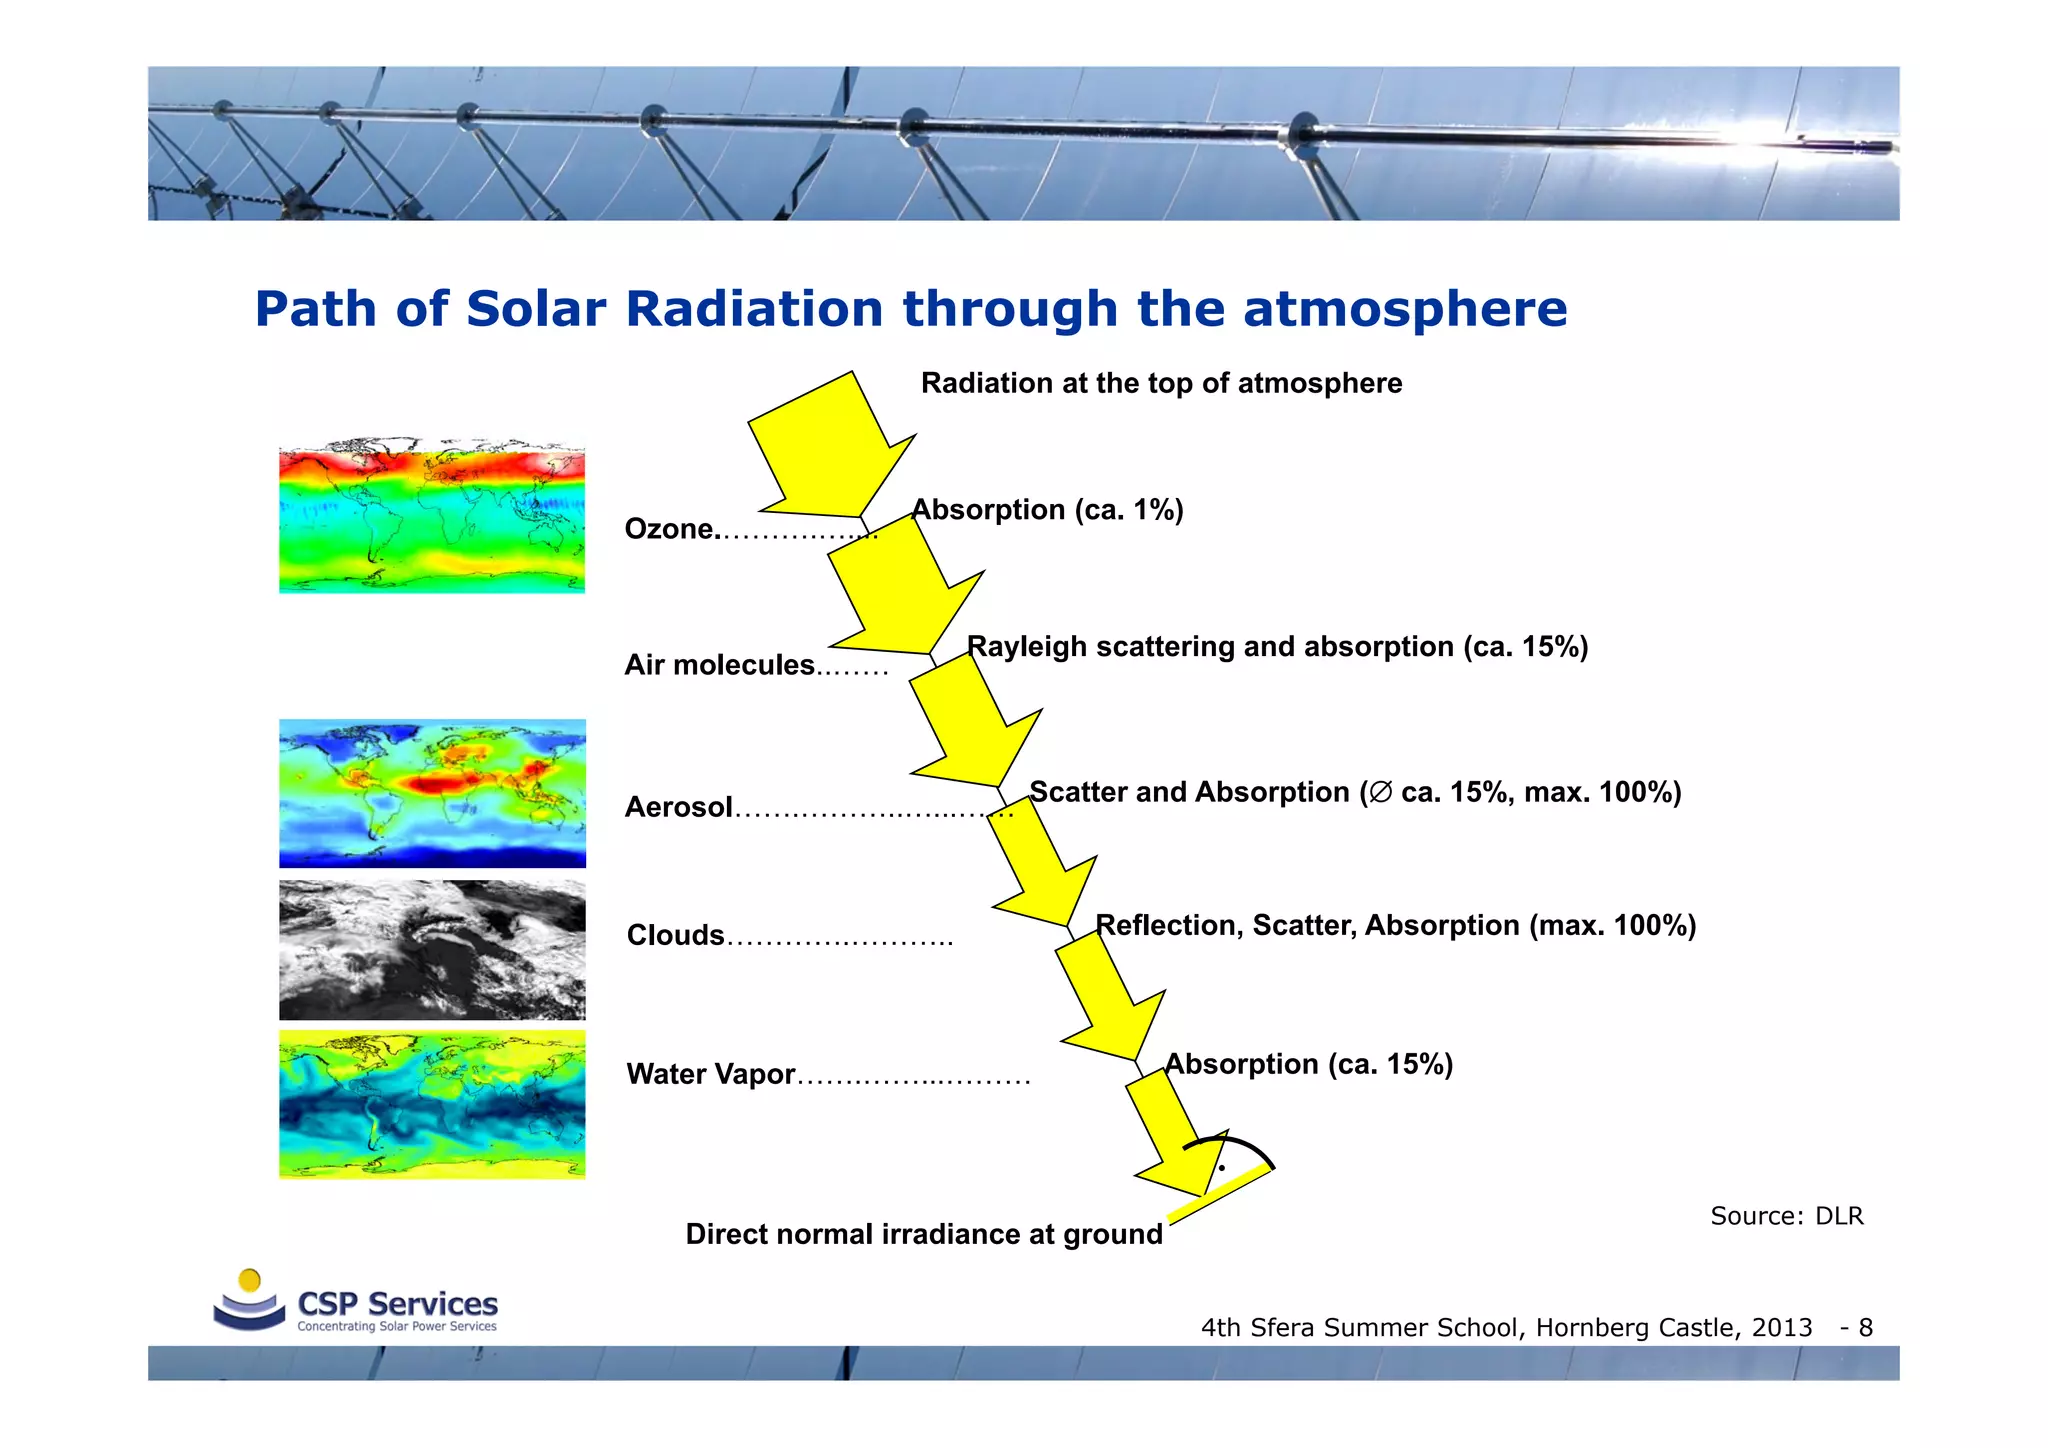
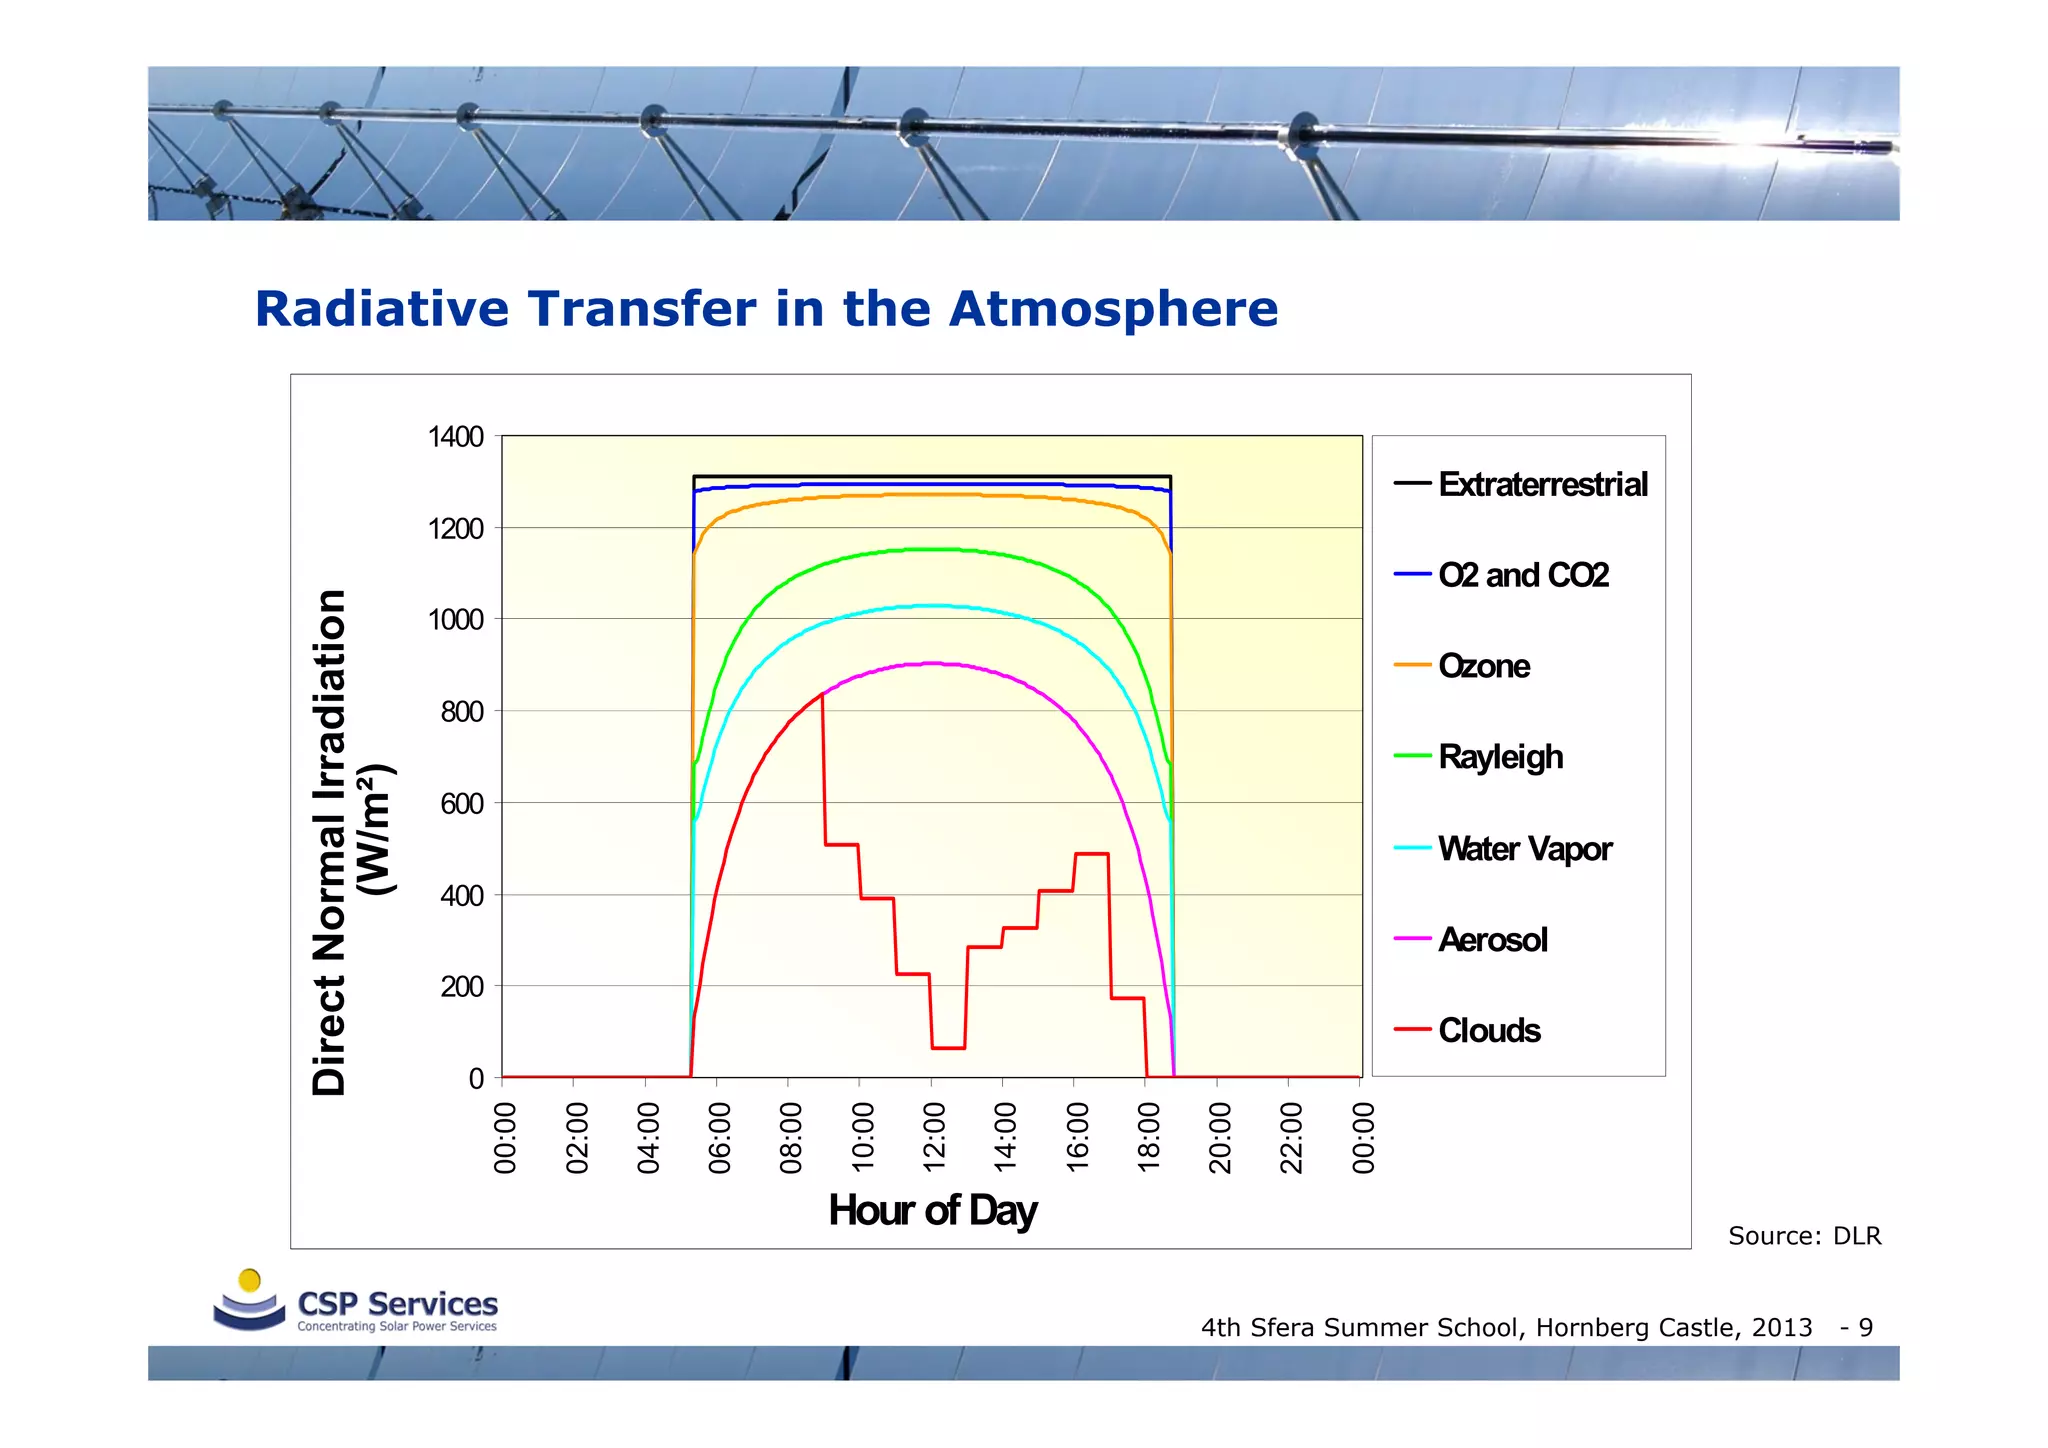
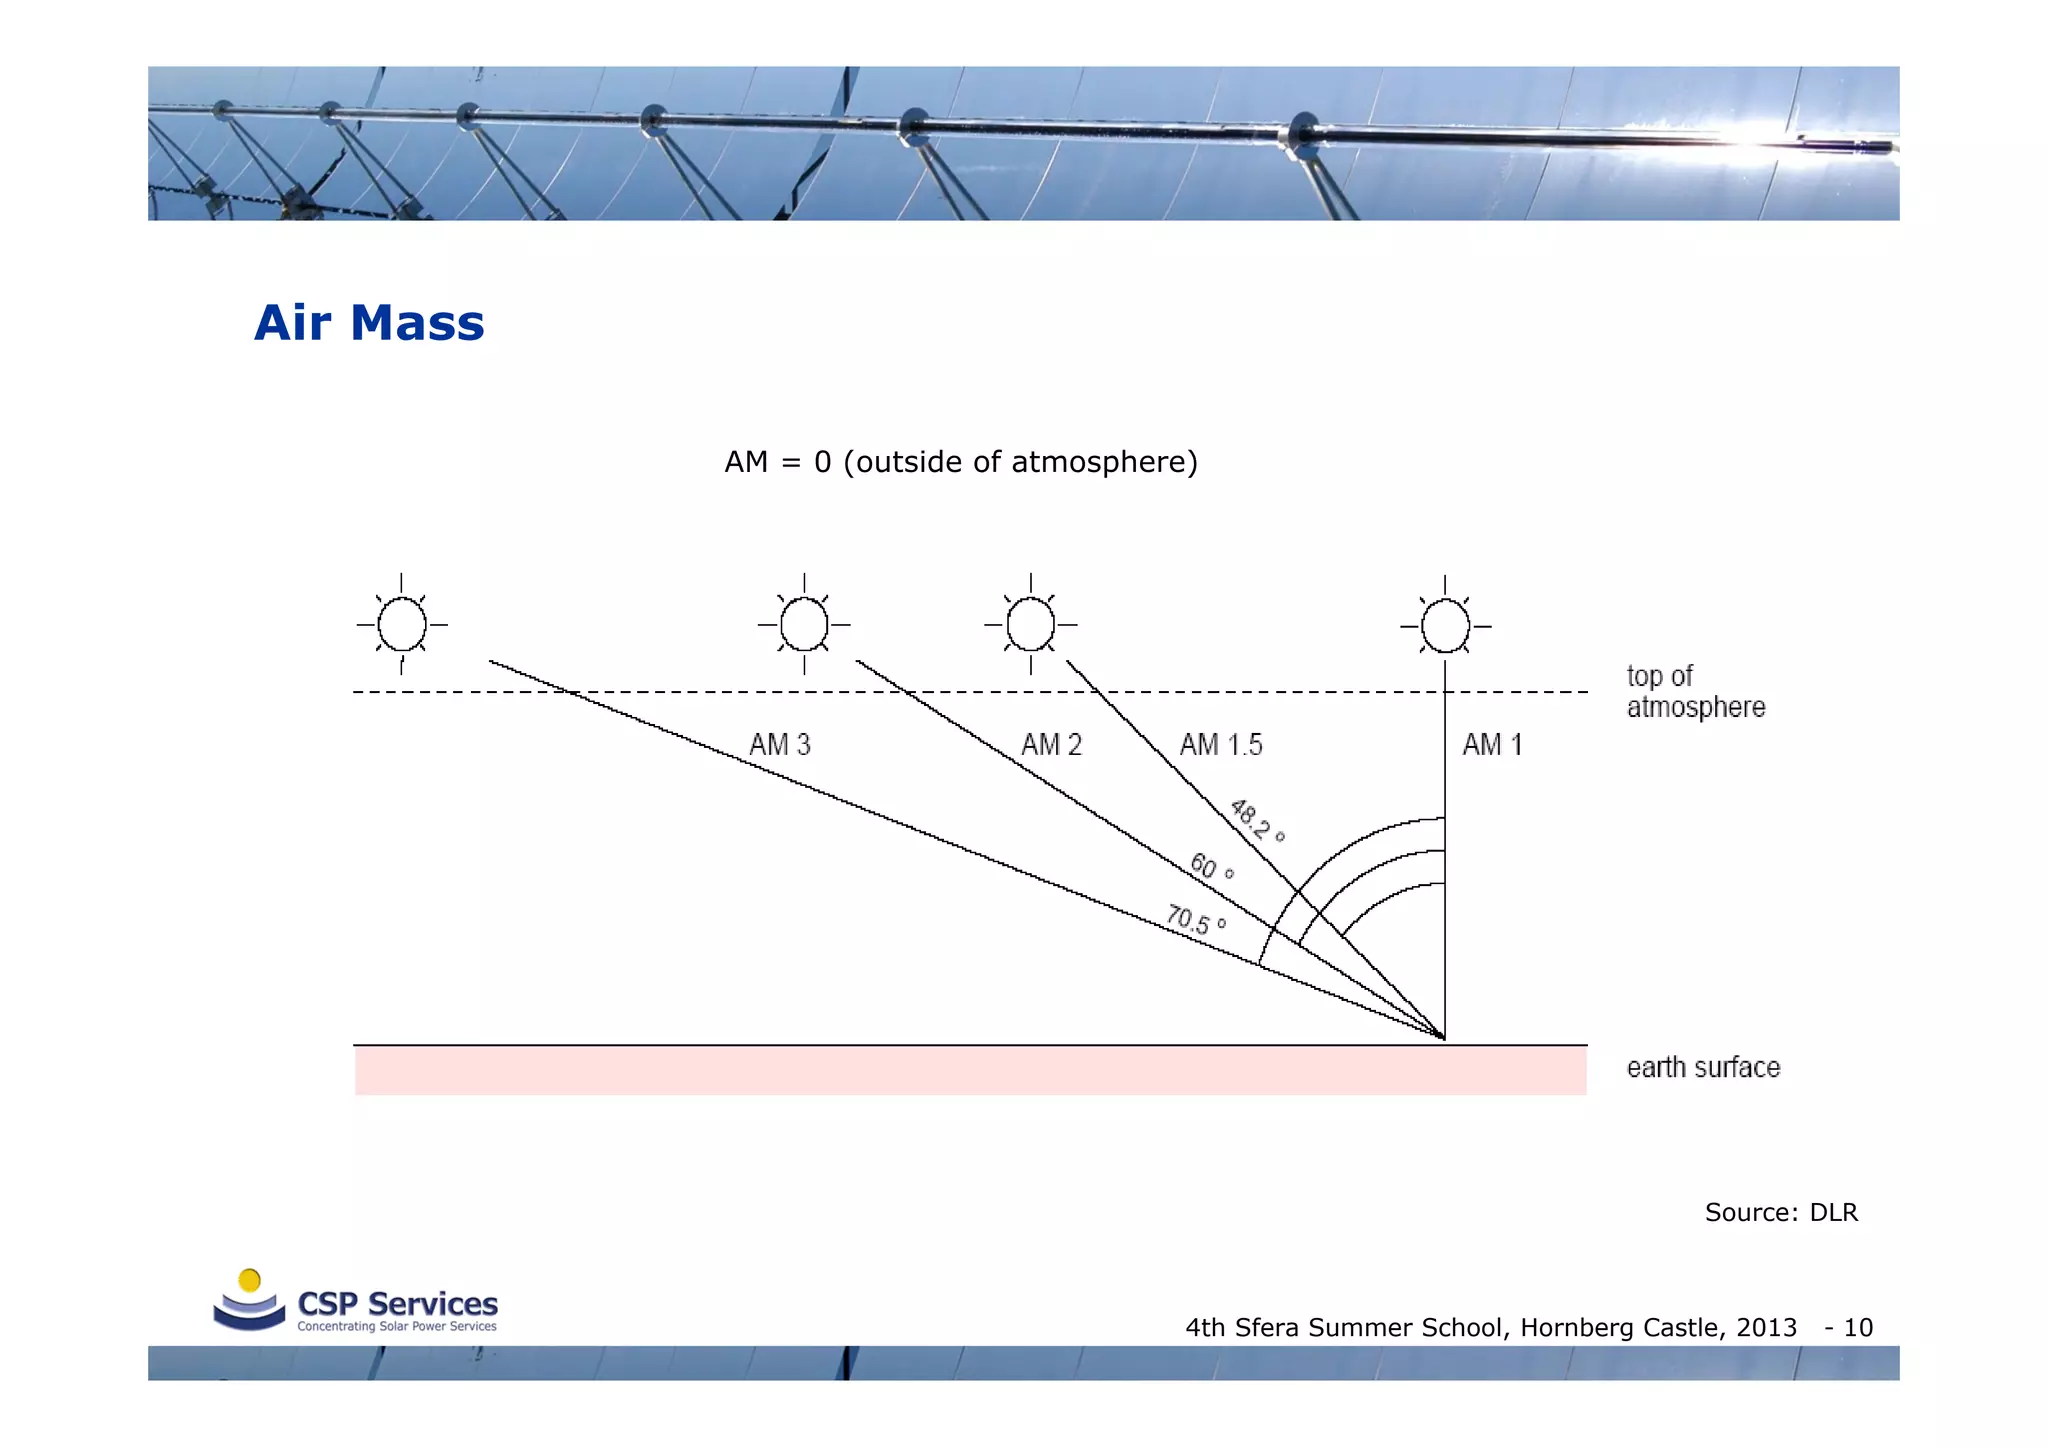
Source: DLR
4th Sfera Summer School, Hornberg Castle, 2013
- 65](https://image.slidesharecdn.com/solar-resource-measurements-norbert-geuder-sfera2013-131024064432-phpapp01/75/Solar-resource-measurements-and-sattelite-data-65-2048.jpg)