The document discusses database normalization and provides examples of normalizing tables to first, second, and third normal forms. It also provides sample SQL queries to create and manipulate tables, such as creating a Customers table, selecting data from tables based on conditions, inserting data into an Orders table, updating the Orders table by adding a column, and joining tables. Students are assigned to complete the tasks of implementing the examples and SQL queries by the given deadline.
NORMALIZATION - BIS 1204: Data and Information Management I Mukalele Rogers
This presentation contains a summary of Database Normalisation concepts:
The purpose of normalization.
How normalization can be used during database design.
The update anomalies associated with data redundancy.
The concept of functional dependencies, which describe the relationship between attributes.
How to undertake the process of normalization.
How to identify the most commonly used normal forms: First Normal Form(1NF), Second Normal Form (2NF), and Third Normal Form (3NF).
Introduction to Advanced Normalisation: The Boyce–Codd Normal Form (BCNF) and higher normal forms.
An introduction to database Normalization. An essential part of logical database design for relational databases. The presentation also has little coverage of related concepts like functional dependency, data anomalies, dependency preservation and lossless decomposition.
Database normalization is the process of structuring a relational database in accordance with a series of so-called normal forms in order to reduce data redundancy and improve data integrity. It was first proposed by Edgar F. Codd as part of his relational model.
Agenda
What Is Normalization?
Why We Use Normalization?
Various Levels Of Normalization
Any Tools For Generate Normalization?
By Harsiddhi Thakkar
If you have any query
Contact me on : harsiddhithakkar94@gmail.com
(INNER) JOIN: , LEFT (OUTER) JOIN: ,RIGHT (OUTER) JOIN: , FULL (OUTER) JOIN: , SQL UNION Operator, SQL GROUP BY HAVING statement, The SQL EXISTS Operator, The SQL ANY and ALL Operators, The SQL SELECT INTO Statement, The SQL INSERT INTO SELECT StatementThe SQL INSERT INTO SELECT Statement
Data and functionality are two primary aspects of systems. Unfortunately, there is a mental gap between these two aspects. Therefore, nowadays many are looking for the corresponding research and development fields as quite distinct with different terminology, tools, problems, processes,methods and best practices. D. Gokila | S. BalaSubramani "Impact of Normalization in Future" Published in International Journal of Trend in Scientific Research and Development (ijtsrd), ISSN: 2456-6470, Volume-3 | Issue-5 , August 2019, URL: https://www.ijtsrd.com/papers/ijtsrd25128.pdfPaper URL: https://www.ijtsrd.com/engineering/computer-engineering/25128/impact-of-normalization-in-future/d-gokila
ACL London User Group - Question Box SessionAlex Psarras
A short presentation developed for the ACL London User Group covering some top user queries:
1) Calculate number of months between dates
2) Identify duplicates over multiple fields
3) Automating SAP Direct Link background query retrieval
EDA of San Francisco Employee Compensation for Fiscal Year 2014-15Sagar Tupkar
An Exploratory Data Analysis of the dataset of San Francisco Employee Compensation for Fiscal Year 2014-15 obtained from (www.data.sfgov.org) was performed as a part of the course curriculum at MS-Business Analytics at University of Cincinnati. After extensive cleaning, filtering and manipulation using R, SAS and Advanced Excel to detect potential outliers, the dataset was reduced to 83946 observations and 18 variables to probe into the statistics and draw insightful information using MS-SQL. The results of analysis are presented graphically for better data-visualization using Tableau
Final ProjectBe sure to follow the instructions for each step as.docxvoversbyobersby
Final Project
Be sure to follow the instructions for each step as you will be graded accordingly. Each report should have a title and appropriate field headings for each column of data. If you list a team or player always list both the number and name. Be sure that your results are sorted as requested, and that your numbers make sense. Make all of your reports stored procedures, I will want a copy of each stored procedure, and your results which will be a query that runs all of them and the output they produce.
1. Produce a list of Teams including how many points they earned (determine this in a function that takes each team as its being read in and brings back the number of points) sort the output in highest to lowest order according to the points they received and create an additional column that designates who came in 1st place, 2nd place, and 3rd place. Include the name of the manager in your list.
2. Produce a list of Players, by Team, with a blank line in between each teams players. Include their starting average, and the average of what they bowled during the league (do this by building a function that you can call from your stored procedure that will take the current player being read by your procedure and determine his average for the league play) the results should be sorted numerically in team and player order. At the bottom of the report list : Which player bowled the highest average during the league, and which was the most improved from his starting average, be sure to label this output appropriately.
3. Produce a list that shows week by week which teams played which, and the points they earned that particular week. Sort the output in week order and then by team number 1 order (you are using the schedule table as your driver for this) make sure to skip a line in between each weeks output.
Make sure all stored procedures and functions use your Team Number as part of their name
Advanced SQL – Week 13
Triggers are SQL statements that are automatically executed when certain events occur. They can be tied to the following statements: DELETE, INSERT, and UPDATE.
For example you might save a copy of a row in an archive table before issuing a DELETE statement. Check that certain fields are formatted correctly before doing an INSERT, or perform calculations such as subtracting the order quantity from the amount on hand when doing an UPDATE
Each of the above examples have in common that something needs to be done automatically whenever a change occurs to a table.
Triggers can be single statements, or groups of statements that are enclosed within a BEGIN and END statement.
You create a trigger by supplying 3 pieces of information: a unique trigger name, the table it is to be associated with, and the event that should trigger it.
CREATE TRIGGER process_scores ON scores AFTER INSERT AS
SELECT ‘Another score has been added’;
Triggers are defined per event per table, and only one trigger per event per table is a ...
Similar to CSC 433 Sample normalization SQL Question (20)
Synthetic Fiber Construction in lab .pptxPavel ( NSTU)
Synthetic fiber production is a fascinating and complex field that blends chemistry, engineering, and environmental science. By understanding these aspects, students can gain a comprehensive view of synthetic fiber production, its impact on society and the environment, and the potential for future innovations. Synthetic fibers play a crucial role in modern society, impacting various aspects of daily life, industry, and the environment. ynthetic fibers are integral to modern life, offering a range of benefits from cost-effectiveness and versatility to innovative applications and performance characteristics. While they pose environmental challenges, ongoing research and development aim to create more sustainable and eco-friendly alternatives. Understanding the importance of synthetic fibers helps in appreciating their role in the economy, industry, and daily life, while also emphasizing the need for sustainable practices and innovation.
We all have good and bad thoughts from time to time and situation to situation. We are bombarded daily with spiraling thoughts(both negative and positive) creating all-consuming feel , making us difficult to manage with associated suffering. Good thoughts are like our Mob Signal (Positive thought) amidst noise(negative thought) in the atmosphere. Negative thoughts like noise outweigh positive thoughts. These thoughts often create unwanted confusion, trouble, stress and frustration in our mind as well as chaos in our physical world. Negative thoughts are also known as “distorted thinking”.
The Indian economy is classified into different sectors to simplify the analysis and understanding of economic activities. For Class 10, it's essential to grasp the sectors of the Indian economy, understand their characteristics, and recognize their importance. This guide will provide detailed notes on the Sectors of the Indian Economy Class 10, using specific long-tail keywords to enhance comprehension.
For more information, visit-www.vavaclasses.com
Model Attribute Check Company Auto PropertyCeline George
In Odoo, the multi-company feature allows you to manage multiple companies within a single Odoo database instance. Each company can have its own configurations while still sharing common resources such as products, customers, and suppliers.
Palestine last event orientationfvgnh .pptxRaedMohamed3
An EFL lesson about the current events in Palestine. It is intended to be for intermediate students who wish to increase their listening skills through a short lesson in power point.
How to Make a Field invisible in Odoo 17Celine George
It is possible to hide or invisible some fields in odoo. Commonly using “invisible” attribute in the field definition to invisible the fields. This slide will show how to make a field invisible in odoo 17.
How to Create Map Views in the Odoo 17 ERPCeline George
The map views are useful for providing a geographical representation of data. They allow users to visualize and analyze the data in a more intuitive manner.
The French Revolution, which began in 1789, was a period of radical social and political upheaval in France. It marked the decline of absolute monarchies, the rise of secular and democratic republics, and the eventual rise of Napoleon Bonaparte. This revolutionary period is crucial in understanding the transition from feudalism to modernity in Europe.
For more information, visit-www.vavaclasses.com
Unit 8 - Information and Communication Technology (Paper I).pdfThiyagu K
This slides describes the basic concepts of ICT, basics of Email, Emerging Technology and Digital Initiatives in Education. This presentations aligns with the UGC Paper I syllabus.
This is a presentation by Dada Robert in a Your Skill Boost masterclass organised by the Excellence Foundation for South Sudan (EFSS) on Saturday, the 25th and Sunday, the 26th of May 2024.
He discussed the concept of quality improvement, emphasizing its applicability to various aspects of life, including personal, project, and program improvements. He defined quality as doing the right thing at the right time in the right way to achieve the best possible results and discussed the concept of the "gap" between what we know and what we do, and how this gap represents the areas we need to improve. He explained the scientific approach to quality improvement, which involves systematic performance analysis, testing and learning, and implementing change ideas. He also highlighted the importance of client focus and a team approach to quality improvement.
Welcome to TechSoup New Member Orientation and Q&A (May 2024).pdfTechSoup
In this webinar you will learn how your organization can access TechSoup's wide variety of product discount and donation programs. From hardware to software, we'll give you a tour of the tools available to help your nonprofit with productivity, collaboration, financial management, donor tracking, security, and more.
The Art Pastor's Guide to Sabbath | Steve ThomasonSteve Thomason
What is the purpose of the Sabbath Law in the Torah. It is interesting to compare how the context of the law shifts from Exodus to Deuteronomy. Who gets to rest, and why?
The Art Pastor's Guide to Sabbath | Steve Thomason
CSC 433 Sample normalization SQL Question
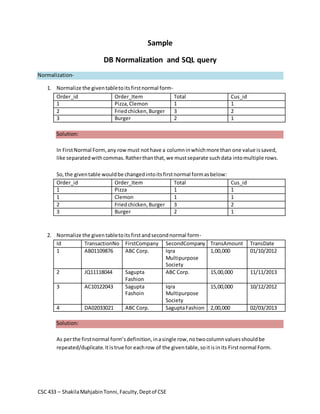
1. Sample
DB Normalization and SQL query
Normalization-
1. Normalize the given table to its first normal form-
Order_id Order_Item Total Cus_id
1 Pizza, Clemon 1 1
2 Fried chicken, Burger 3 2
3 Burger 2 1
Solution:
In First Normal Form, any row must not have a column in which more than one value is saved,
like separated with commas. Rather than that, we must separate such data into multiple rows.
So, the given table would be changed into its first normal form as below:
Order_id Order_Item Total Cus_id
1 Pizza 1 1
1 Clemon 1 1
2 Fried chicken, Burger 3 2
3 Burger 2 1
2. Normalize the given table to its first and second normal form-
Id TransactionNo FirstCompany SecondCompany TransAmount TransDate
1 AB01109876 ABC Corp. Iqra
Multipurpose
Society
CSC 433 – Shakila Mahjabin Tonni, Faculty, Dept of CSE
1,00,000 01/10/2012
2 JQ11118044 Sagupta
Fashion
ABC Corp. 15,00,000 11/11/2013
3 AC10122043 Sagupta
Fashoin
Iqra
Multipurpose
Society
15,00,000 10/12/2012
4 DA02033021 ABC Corp. Sagupta Fashion 2,00,000 02/03/2013
Solution:
As per the first normal form’s definition, in a single row, no two column values should be
repeated/duplicate. It is true for each row of the given table, so it is in its First normal Form.
2. By definition, to transform a table into its second normal form, we have to remove subsets of
data that apply to multiple rows (multiple rows have same data for a column) of a table and
place them in separate tables.
Here, the company names are repeating in both FirstCompany (example, ABC Corp. came twice)
and SecondCompany (Iqra Multipurpose Society came twice) columns.
We can create a totally new table named Company for these names. So, after transforming the
table in its 2NF form, we get:
Table:Company
Id CompanyName
1 ABC Corp.
2 Sagupta Fashion
3 Iqra Multipurpose Society
Id TransactionNo FirstCompanyID SecondCompanyID TransAmount TransDate
1 AB01109876 1 3 1,00,000 01/10/2012
2 JQ11118044 2 1 15,00,000 11/11/2013
3 AC10122043 2 3 15,00,000 10/12/2012
4 DA02033021 1 2 2,00,000 02/03/2013
3. Normalize the given data into 1NF, 2NF and 3NF-Memb
er_Id
Member_
name
Member_p
osition
Member_
access
CSC 433 – Shakila Mahjabin Tonni, Faculty, Dept of CSE
Member_a
ddress
Member_cont
act
Member_expi
re_date
14012 Sadiqul
Islam
General Loan House 56,
Gulshan 2,
Dhaka
01912098234,
8743930
Feb, 2017
14009 Naurin
Alam
Board of
Trustee
Company
Share
House 42,
Niketon,
Dhaka
01729978783,
8797268
June, 2020
12134 Atiquzza
man
Governing
Body
Company
Share,
Managem
ent
House 214,
Niketon,
Dhaka
01819878375,
8524632
Jan, 2015
11067 Kamrunn
ahar
General Loan House
04,DOHS,
Dhaka
01718093014,
7210784
Dec, 2014
Solution:
In first normal form, no column values should contain two values (as in Member_contact
column) separated by comma. So, in 1NF:
3. Membe
r_Id
Member_
name
Member_p
osition
Member_a
ccess
CSC 433 – Shakila Mahjabin Tonni, Faculty, Dept of CSE
Member_a
ddress
Member_c
ontact
Member_expir
e_date
14012 Sadiqul
Islam
General Loan House 56,
Gulshan 2,
Dhaka
019120982
34
Feb, 2017
14012 Sadiqul
Islam
General Loan House 56,
Gulshan 2,
Dhaka
8743930 Feb, 2017
14009 Naurin
Alam
Board of
Trustee
Company
Share
House 42,
Niketon,
Dhaka
017299787
83
June, 2020
14009 Naurin
Alam
Board of
Trustee
Company
Share
House 42,
Niketon,
Dhaka
8797268 June, 2020
12134 Atiquzzam
an
Governing
Body
Company
Share,
Managem
ent
House 214,
Niketon,
Dhaka
018198783
75
Jan, 2015
12134 Atiquzzam
an
Governing
Body
Company
Share,
Managem
ent
House 214,
Niketon,
Dhaka
8524632 Jan, 2015
11067 Kamrunna
har
General Loan House
04,DOHS,
Dhaka
017180930
14
Dec, 2014
11067 Kamrunna
har
General Loan House
04,DOHS,
Dhaka
7210784 Dec, 2014
But in this format, in Member_Id column, column values are repeating. We can’t take this
column as a primary key anymore. Also, in Member_Address has repeating part. So, to convert
into its second normal form we will create a new table from the above table named
MemberContactDetails:
Table: MemberContactDetails
Id Member_contact_1 Member_contact_2 House_No AreaID
1 01912098234 8743930 56
2 01729978783 8797268 42
3 01819878375 8524632 214
4 01718093014 7210784 04
Table: Area
Id Area
1 Gulshan 2, Dhaka
2 DOHS, Dhaka
4. 3 Niketon, Dhaka
Write necessary SQL queries to-
1. Create a table Customers with the following data- (Set Id as the primary key)
Id Cus_Name Age Cus_Address Cus_Mobile Cus_Email
1 Afroza 18 Uttara, Dhaka 01719991112 afroza@hotmail.com
2 Redwan 20 Narsingdi,
Dhaka
CSC 433 – Shakila Mahjabin Tonni, Faculty, Dept of CSE
01616889223 ripon@gmail.com
3 Samsuzzaman 25 Kakrail, Dhaka 01718071083 sahmed@yahoo.com
2. Show customers name and address from the above table.
3. Show customer name from above table where name starts with ‘A’.
4. Show customer name and age for the customers who are more than 18 years old.
5. Create a table order and insert the following data- (Ser Order_id as the primary key)
Order_id Order_Item Total Cus_id
1 Pizza 1 1
2 Clemon 5 1
3 Fried chicken 3 2
4 Burger 2 1
6. Delete rows from the above table where Cus_id is 1.
7. Add a new column named Price in the above table.
8. Show the order_items and total from the above table and change the column names as Items
and Total No.
9. Show the order_item and total where total is between 1 and 4.
10. Show the order_items and total for customer whose cus_id is 2.
>> Complete the above tasks and submit as assignment in group via
email within 07.11.14
>> After 07.11.14, I’ll provide its solution to you.
5. Good Luck
CSC 433 – Shakila Mahjabin Tonni, Faculty, Dept of CSE