Download to read offline


![regulatory tasks it is responsible for the definition of the load-frequency control standard [5].
The main functions of load-frequency control are to maintain a balance between active power
supply and demand as well as maintaining the frequency of the grid within all grid control ar-
eas. This type of control is divided into three main categories, namely primary, secondary and
tertiary control. When a sufficiently large disturbance is detected, primary control is activated
within seconds, secondary control within minutes and tertiary control within tens of minutes,
should the disturbance endure that long. Each successive control category relieves the previous
one of its responsibilities to await the next request. It is the task of the TSO to send the
secondary control (SC) signal to generators requesting either an increase or decrease in active
power output. The problem for CDE’s is the minimum generating capacity required to partake
in this market. This dissertation specifically focuses on the SC market which, in Germany, has
an entry level bid of 10 MW with 1 MW increments [8].
The main motivating factors for this project therefore include:
• enabling CDE’s to overcome the minimum bid trade barrier for the SC market in Germany,
• the need for a fully flexible and modifiable software framework which can easily aggregate
CDE’s in a variety of configurations,
• the desire to easily incorporate algorithms and software from other projects,
• the need to interface with other software and data sources such as Powerfactory, the
German Energy Exchange (EEX), weather forecast data providers etc.
These main points provide the motivation to seek ways to flexibly aggregate CDE’s, making it
both possible and profitable for even the smallest grid connected CDE to trade on the existing
electricity markets.
Various methods have been considered to integrate large numbers of controllable distributed
energy units into the existing grid topology. These include, among other approaches, distributed
energy management systems, micro grids, virtual power plants and cells [2][3][4][6][7][10]. The
principle idea behind all of them is the aggregation of CDE’s in order to behave like conventional
power plants so as to more easily fit into the existing technical and economic models that
constitute the current electricity industry.
The objective of this dissertation was to design and implement a flexible, software based dis-
tributed energy management system (DEMS), based on ideas from the approaches listed above,
for experimenting with aggregation approaches in a laboratory environment.
In section 2 the concept of multi-tiered aggregation will be explored further. With this foun-
dation in place, section 3 will go into detail around the topic of software design. The software
has to be able to control hardware CDE’s so section 4 considers the laboratory equipment,
computing infrastructure and how to control the CDE’s. Section 5 lays out the experimental
procedure that will create the platform to collect the data and finally analyse it in section 6.
6](https://image.slidesharecdn.com/85848e1f-c611-4aa6-a9ae-1842dc3006ca-150223032521-conversion-gate02/75/roy_emmerich-eurec_dissertation-final-7-2048.jpg)
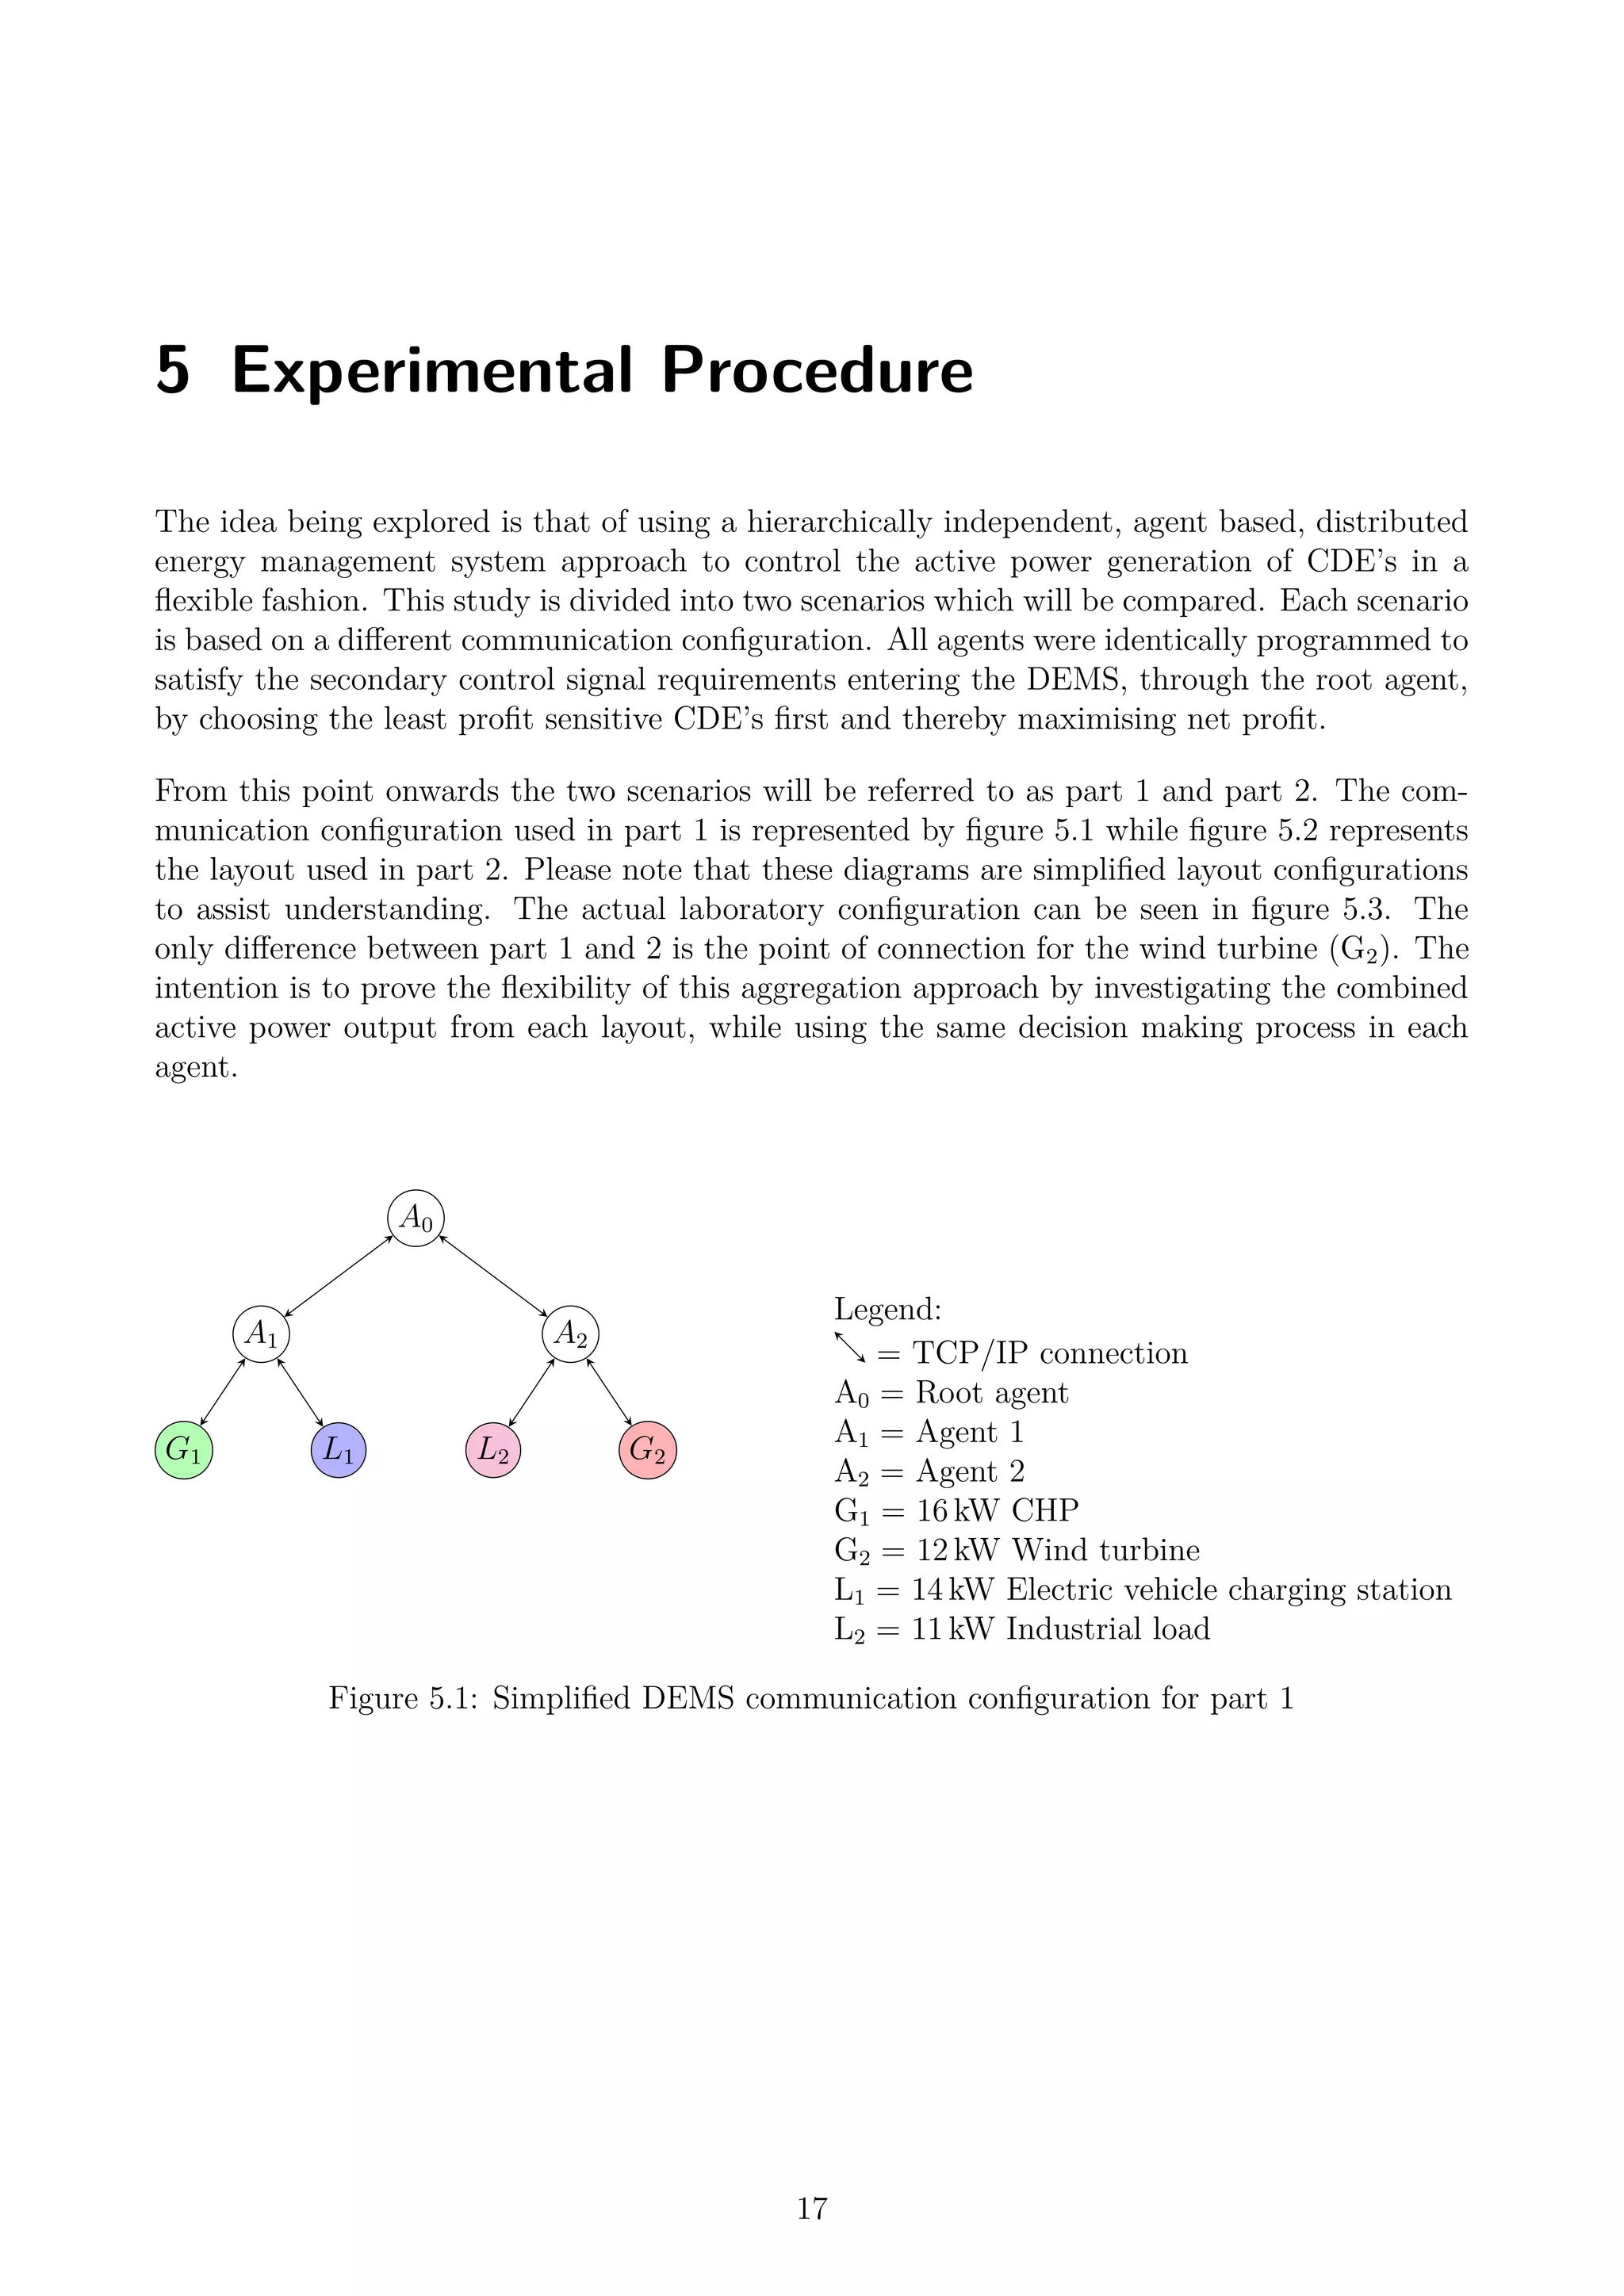
![2 Approach
The FENIX project[7] created the platform on which this dissertation is based.
The main concept which the software had to support was the ability to connect the com-
munication interfaces1
of CDE’s together in a hierarchically independent manner. Practically
this means multiple levels of aggregation as depicted in figure 2.1 and is very similar to the
Powermatcher concept described in [10]. For this study the DEMS software was only required
to control the active power consumption and generation of four existing generators and loads
which simulated real world CDE’s as described in section 4.
The main building block of this approach is known as a software based agent. It acts as an
aggregator for the CDE’s connected directly beneath it and contains logic aimed at control-
ling them. Agents are also able to connect to a single superior agent thereby providing a
communication conduit for receiving control signals from above.
aggregator
... CDE aggregator
... CDE aggregator
... ...
Figure 2.1: An illustration of the multi-tiered aggregation of
CDE’s
Allowing multiple levels of ag-
gregation on the communica-
tion side opens possibilities of
new business models taking
root. For example, a small
group of CDE’s such as a few
electric vehicle charging sta-
tions in a certain area may, as
a collective, still not satisfy the
minimum bid requirement for
the German SC market. It
would then be required to fur-
ther aggregate the already ag-
gregated charging stations by
entering into a contract with a
larger aggregator.
Other examples to substantiate this approach would be to reduce congestion by optimising
power flow or to reduce active power line losses through real time simulation techniques. The
agent, coupled to an electrical simulation software package, could then make the decision on
how best to engage the CDE’s based on the simulation results. Using a multi-tiered approach
the simulations could be tailored for each agent based on unique local conditions.
The electricity legislation was assumed to be sufficiently flexible to allow the operator of the
DEMS to simultaneously benefit from the German Renewable Energy Sources Act (EEG) feed-
in tariff as well as the German secondary control balancing power market. The EEG rewards
CDE’s feeding active power into the grid. Generators taking part in the secondary control
1
as opposed to the electrical interfaces
7](https://image.slidesharecdn.com/85848e1f-c611-4aa6-a9ae-1842dc3006ca-150223032521-conversion-gate02/75/roy_emmerich-eurec_dissertation-final-8-2048.jpg)
![market are paid for being on standby should their services be required by the TSO as well
as for the amount of active power produced [8]. It was assumed that the revenue from active
power generated for the feed-in tariff would be substantially higher.
In order to generate maximum profit, the default operating mode of the generators in this study
must be to generate maximum active power. For the loads the default operating state must be
to consume as much active power as possible. In the context of this study the two loads are an
electric vehicle charging station and an industrial load of some sort. In the case of the charging
station, profit is only generated when charging vehicles. It is therefore in the interests of the
DEMS operator to always aim for maximum active power consumption by the charging station.
In the case of the industrial load it was assumed the owner, namely the DEMS operator, is
contracted to drive a certain industrial process that consumes a constant 11 kW of active power.
The consumer of this power is able to tolerate a certain amount of variation but would prefer
a constant supply. The contract binds the DEMS operator to a service level agreement that
rewards the continuous supply of power.
The role of the DEMS in this study is to control the active power settings of the CDE’s in order
to satisfy the TSO’s secondary control request but limiting the impact on the profit earned from
the feed-in tariff.
It should be noted that the secondary control signal is a request by the TSO for a relative
change in the active power output from a generator or active power consumption by a load.
In the context of this study, every time a secondary control request is received by the DEMS,
it is taken to be a relative change using the combined default operating states of all CDE’s
described above as the reference point.
The strengths of a laboratory based approach such as this are:
• it can be tested using real hardware with actual results obtained.
• having full control over the software platform provides many opportunities to incorporate
new algorithms and perform real time optimisations either by incorporating software
written by others or by interfacing with commercial packages such as Powerfactory.
• allows virtually any CDE communication configuration to be tested.
• the flexibility and ability to incorporate and/or interface with other software allows the
optimisation of each agent to be customised based on aspects such as electrical configu-
ration, the types of CDE’s connected or any other item requiring optimisation.
While the weaknesses are:
• the limited number of available loads and generators which makes it impossible to simulate
a large scale real world situation.
• although real hardware is being used, it is still only simulating actual CDE’s.
8](https://image.slidesharecdn.com/85848e1f-c611-4aa6-a9ae-1842dc3006ca-150223032521-conversion-gate02/75/roy_emmerich-eurec_dissertation-final-9-2048.jpg)
![3 Software Design
The developed distributed energy management system (DEMS) is a software based solution
which was written in the Python programming language [13]. Python is an interpreted, inter-
active, object-oriented programming language. It was chosen for this project for the following
reasons:
• its ability to easily incorporate existing code written in a number of other languages (e.g.
Fortran, C, C++, Java). At the outset it was envisaged that code, written in other
languages, from other IWES projects would be utilised at a later stage.
• it is open source and therefore freely available to anybody with an internet connection.
• it runs on a number of operating systems (e.g. Windows, Linux, Apple Macintosh).
• it is feature rich and easy to learn.
• it has a large user base within the research community in many fields such as physics,
astronomy and bio-informatics.
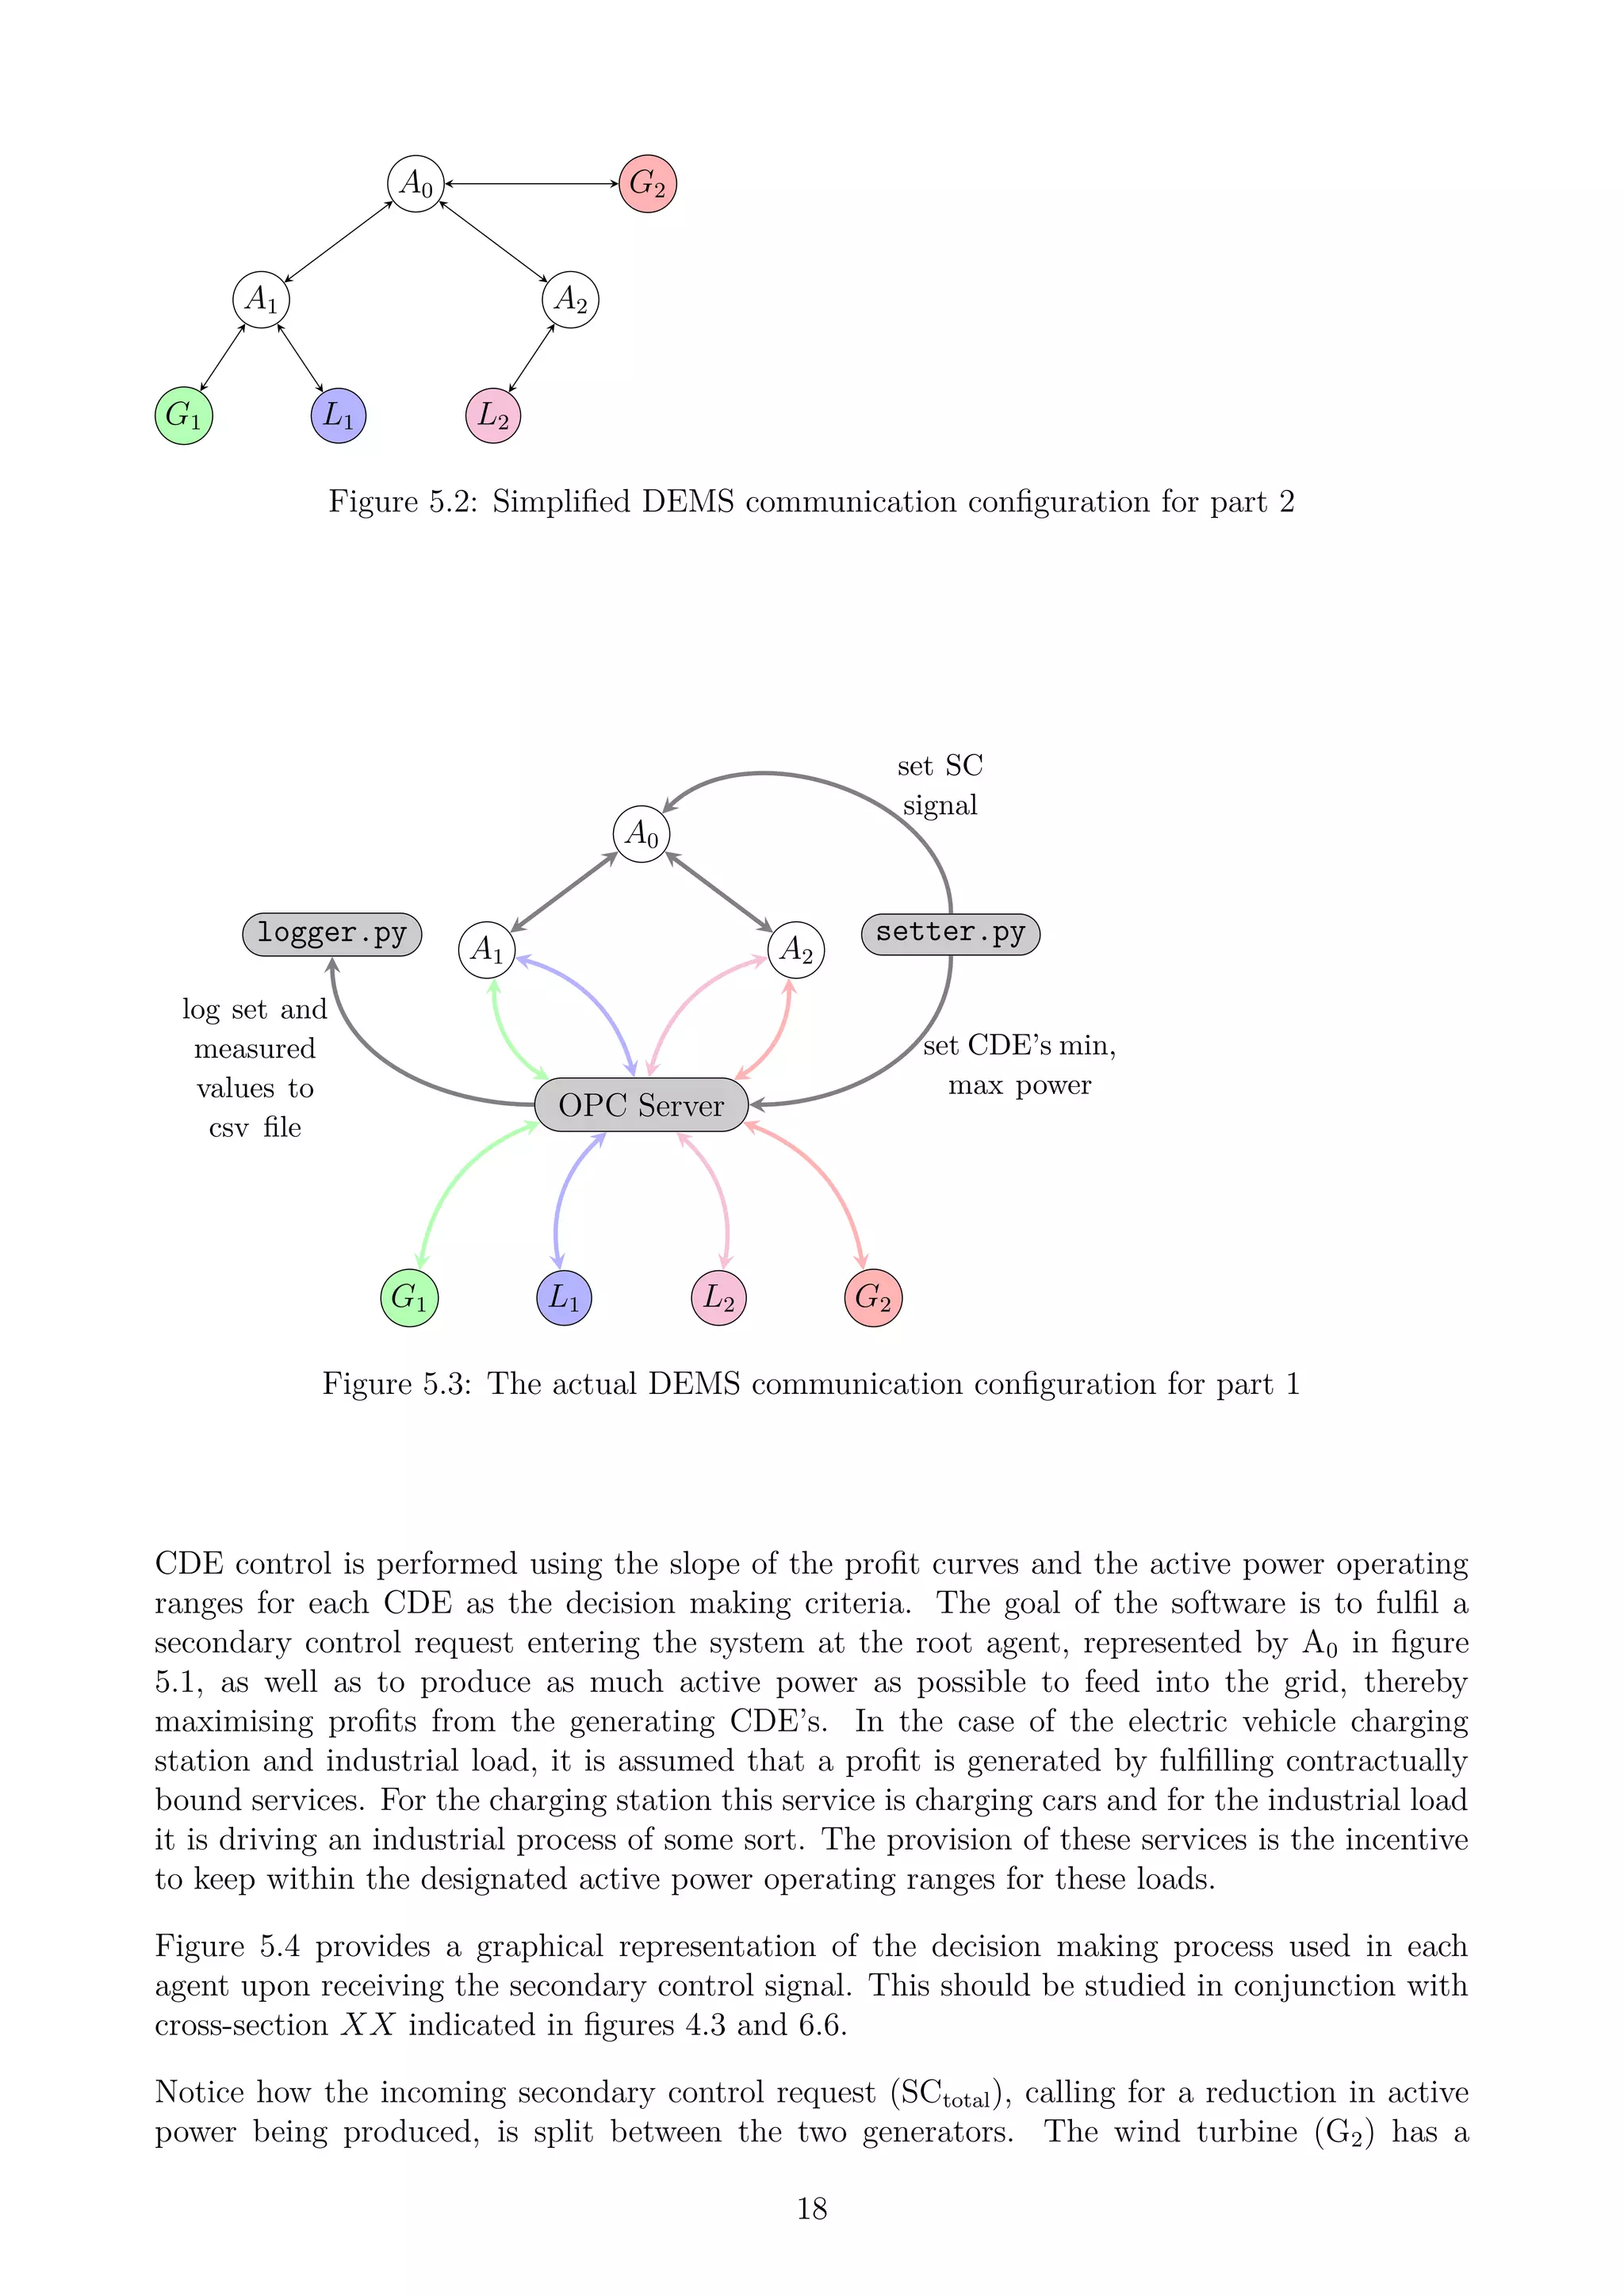
When designing the DEMS, specific emphasis was given to allowing hierarchical flexibility with
respect to the communication connections as well as the interaction with different applications,
systems, hardware and software. The DEMS consists of a number of nodes or agents which
are connected to each other in a hierarchical tree structure as shown in figure 5.1. Each agent
within the DEMS is represented by an instance of a single Python class which is designed to
run on physically separate hardware. Inter-agent communication is via the internet protocol
suite (TCP/IP) using the Python Remote Objects package [12]. Agents are only allowed to
have one superior agent but can theoretically be connected to an infinite number of sub-agents
and CDE’s. Each agent is only aware of sub-agents and CDE’s connected one level below itself.
The OpenOPC package[9] was used to communicate with the CDE’s and other measurement
hardware via various OPC servers in the DeMoTec laboratory.
The use of a standardised application programming interface (API) promotes flexibility by
allowing agents and CDE’s to be connected in virtually any configuration, thereby allowing
many different scenarios to be easily tested.
Using profit as the main decision making criterion, the active power output1
or consumption2
of each CDE was adjusted from its default operating state by the DEMS to fulfil the incoming
secondary control request. Figure 3.1 shows the income, expenditure and resultant profit curves
for each CDE used in this experiment. Note the axis values for the generator plots are positive
while those for the loads are negative. The reason for this was to ensure the slopes of all profit
curves were greater than or equal to zero.
Notice how the expenditure curve always intersects the y axis above or below zero, but never at
zero. Even when CDE’s are not in operation they still incur operational costs such as interest
1
for generators
2
for loads
9](https://image.slidesharecdn.com/85848e1f-c611-4aa6-a9ae-1842dc3006ca-150223032521-conversion-gate02/75/roy_emmerich-eurec_dissertation-final-10-2048.jpg)
![0
2000
4000
6000
8000
10000
12000
14000
16000
Active Power [W]
0
200
400
600
800
1000
1200
1400
1600
Euro/h
slope = 0.069
16 kW CHP Plant (G1 )
Income
Expenditure
Profit
16000
14000
12000
10000
8000
6000
4000
2000
0
Active Power [W]
3000
2500
2000
1500
1000
500
0
Euro/h
slope = 0.01
14 kW Electric Vehicle Charging Station (L1 )
16000
14000
12000
10000
8000
6000
4000
2000
0
Active Power [W]
3000
2500
2000
1500
1000
500
0
Euro/h
slope = 0.022
11 kW Industrial Load (L2 )
0
2000
4000
6000
8000
10000
12000
14000
16000
Active Power [W]
0
200
400
600
800
1000
1200
1400
1600
Euro/h
slope = 0.063
12 kW Wind Turbine (G2 )
Figure 3.1: Income, expenditure and profit curves for all CDE’s
rate repayments on bank loans. This is the reason for this offset. In contrast, the income curve
always intersects the origin. If no active power is produced then no income is generated. The
profit curve is simply the difference between income and expenditure. Notice that the profit
curve always intersects the x axis away from the origin. This means there is an active power
range extending from zero to this intersection point in which it is not financially viable to
operate a CDE as income is less than expenditure. Using the slopes of the profit curves and the
simulated active power working range of each CDE, the DEMS is able to make the decision to
simultaneously meet the secondary control signal and generate active power from the available
CDE’s to maximise profit. The values chosen to represent income and expenditure were only
meant to be indicative and don’t accurately represent actual operating costs of the real world
equivalent units. However, what is important to understand is the concept of using the slope of
the profit curve and the active power operating ranges as the critical decision making criteria.
It must be stated that this profit calculation approach is somewhat static. In reality the
situation varies depending on how much active and reactive power a CDE is required to produce
as well as the associated grid losses [11]. It is however sufficient as a first order approach to
10](https://image.slidesharecdn.com/85848e1f-c611-4aa6-a9ae-1842dc3006ca-150223032521-conversion-gate02/75/roy_emmerich-eurec_dissertation-final-11-2048.jpg)

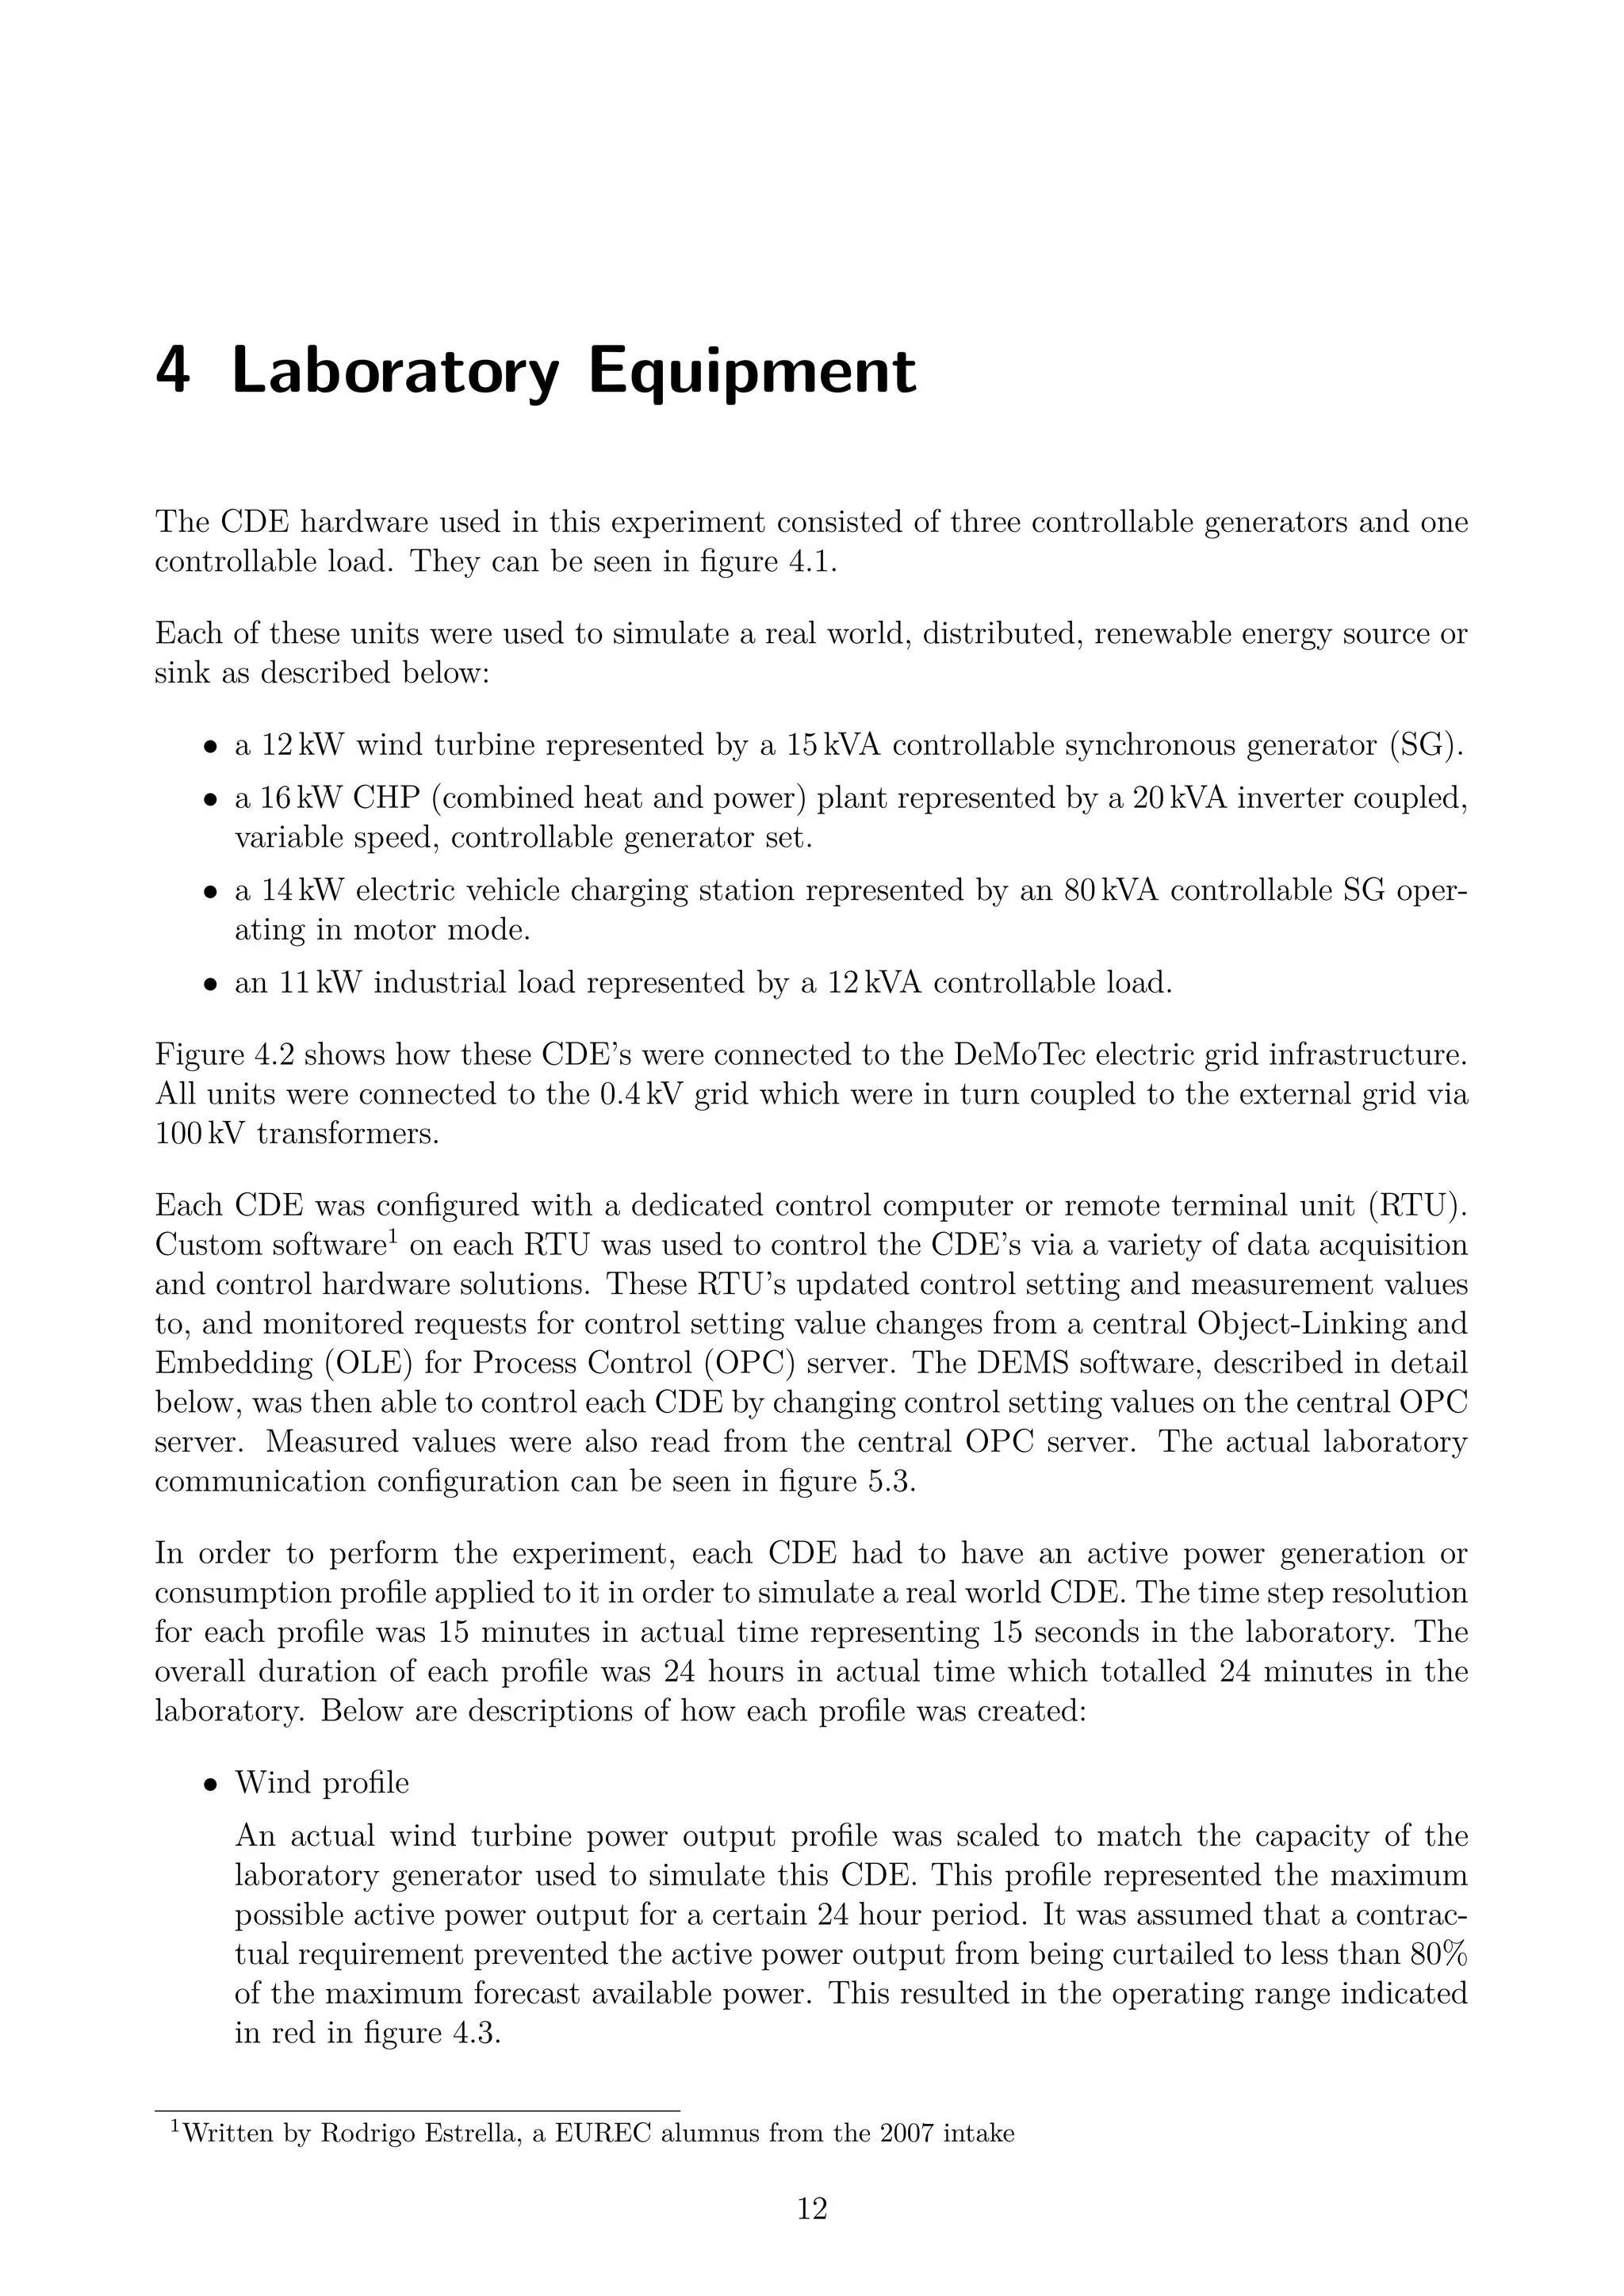
![(a) 15kVA SG (b) 80kVA SG
(c) 20kVA generator set (d) 12kVA load
Figure 4.1: Portfolio of CDE’s used in this study
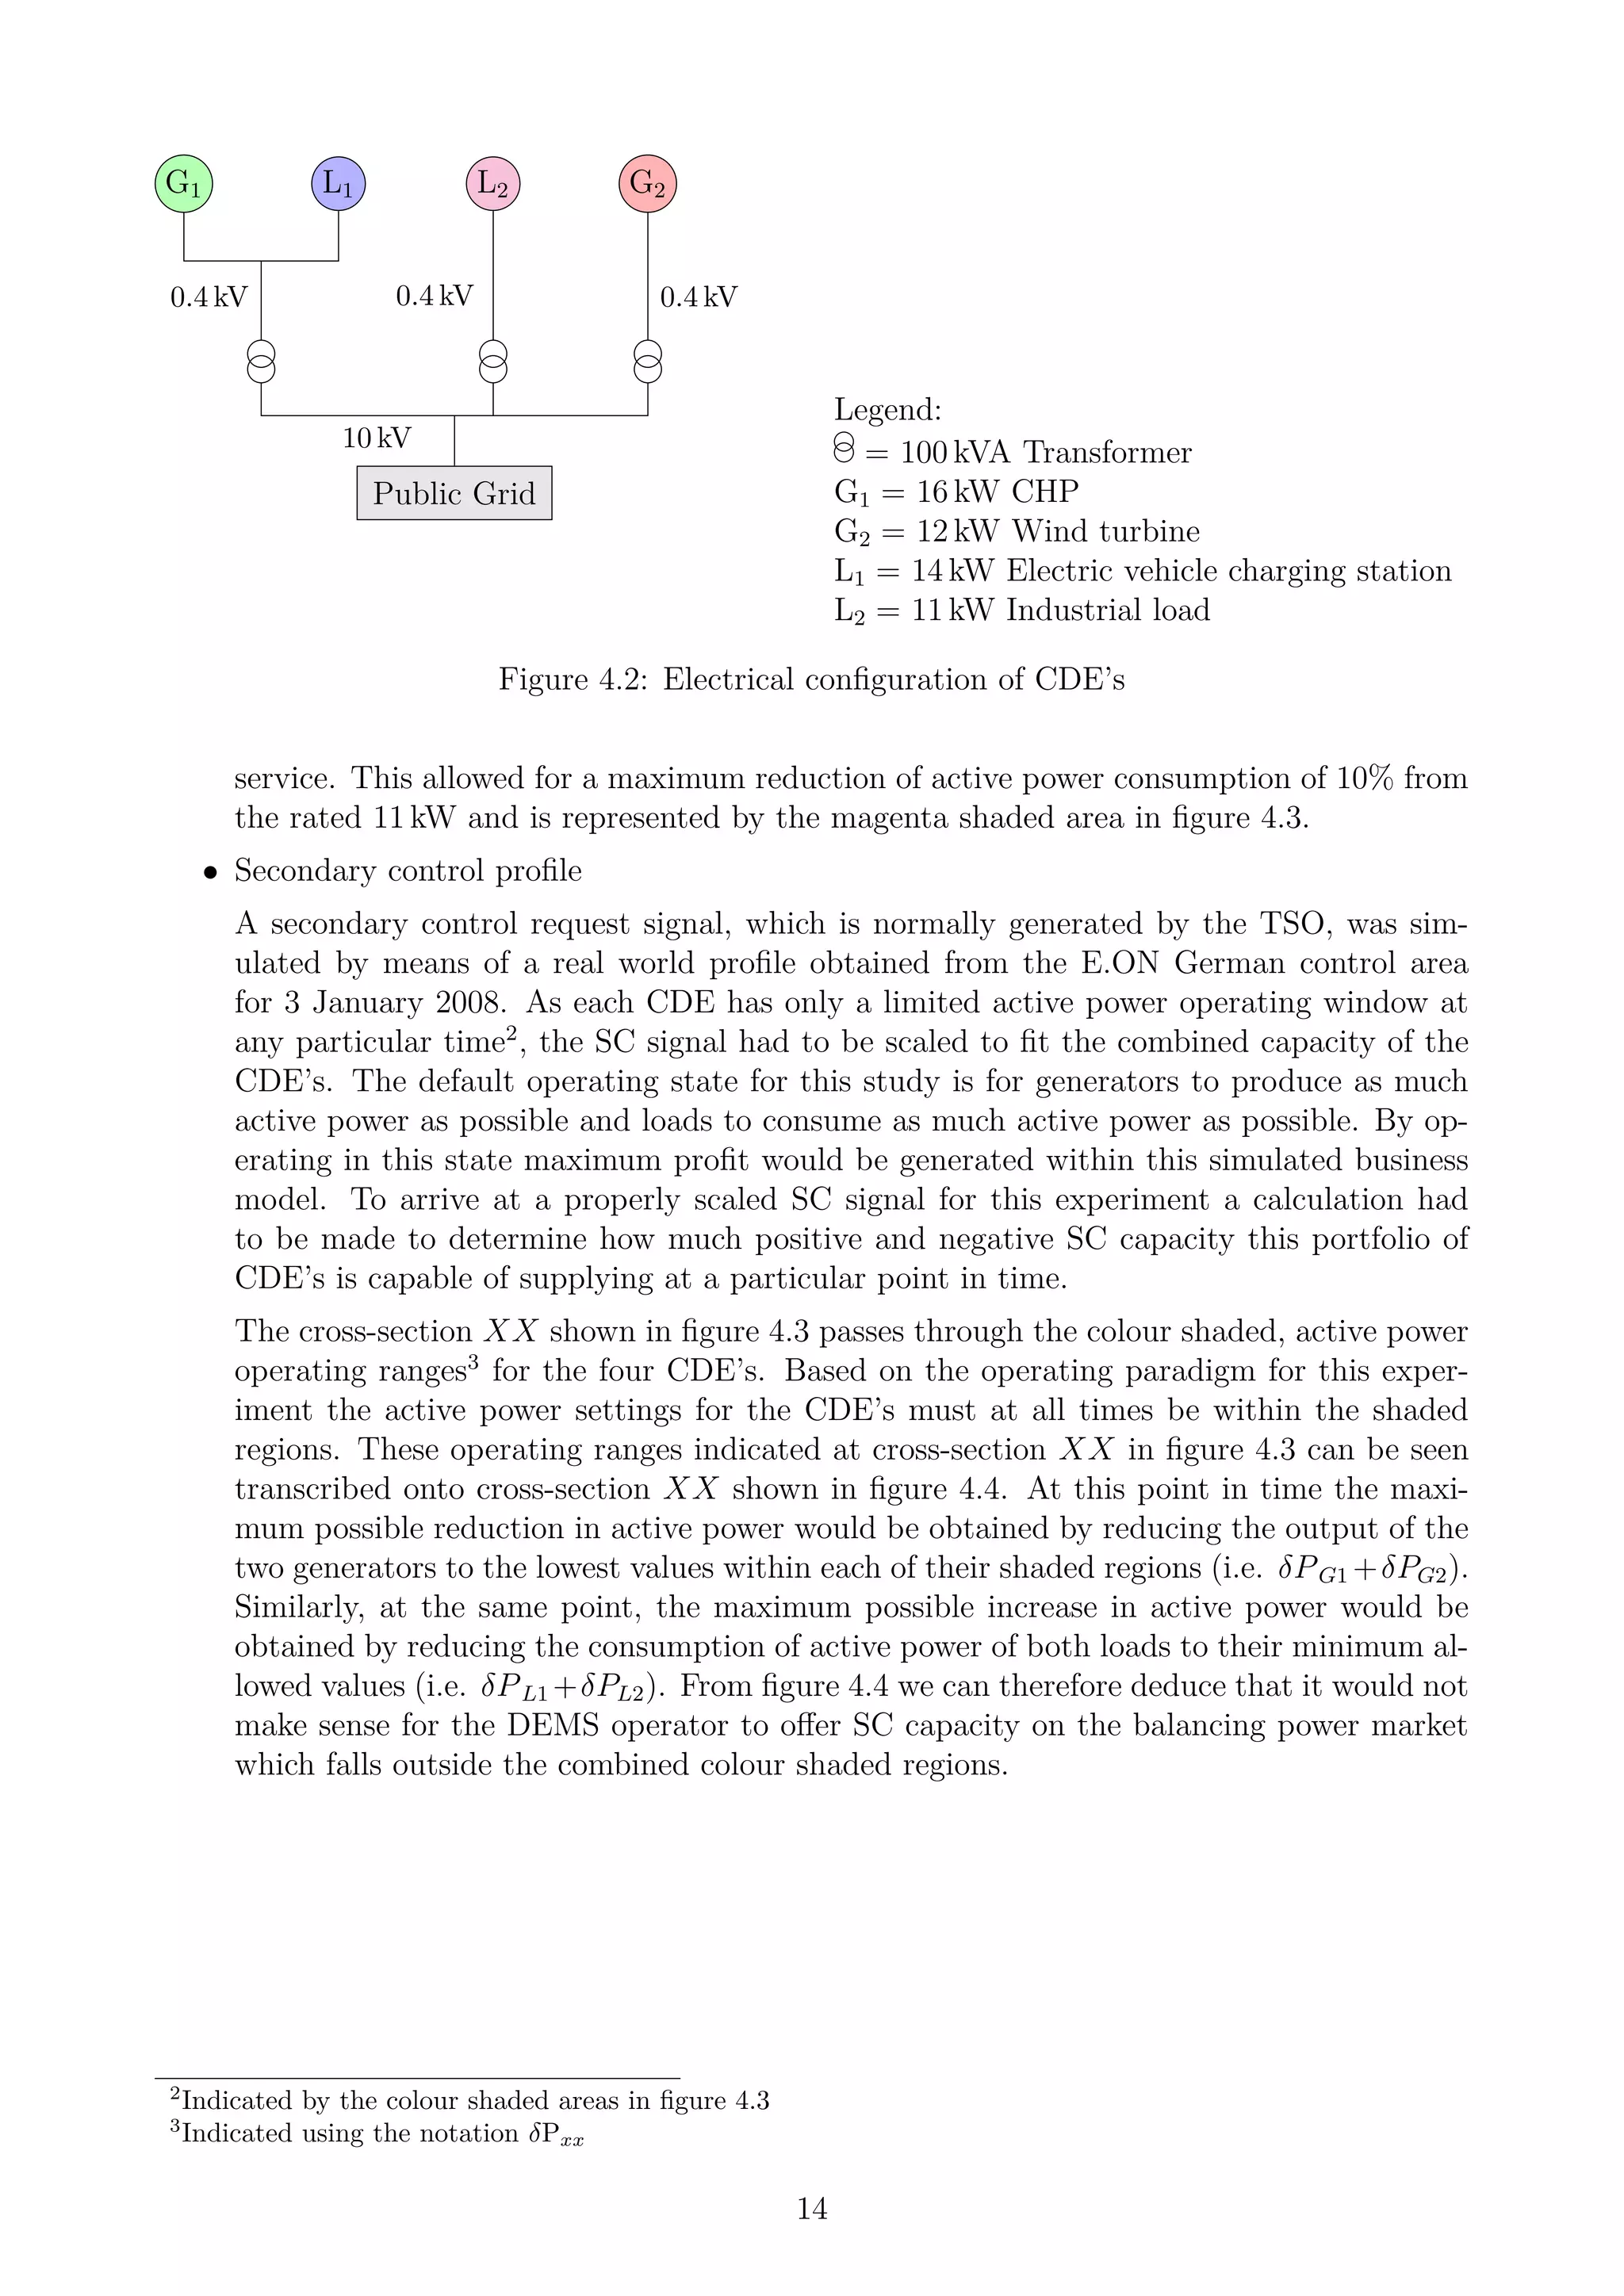
• CHP profile
As combined heat and power (CHP) units are most efficient when running at or near their
rated power output, an operator decision was made to maintain active power output at
or above 80% of the assumed nominal rated power of 16 kW. This operating range is
indicated in green in figure 4.3.
• Electric vehicle charging station profile
Firstly, it is important to note that the active power consumption capacity of an electric
vehicle charging station is proportional to the number of connected vehicles as well as the
state of charge of the batteries within these vehicles. This charging station was assumed
to be located in a parking lot of a large commercial bakery. Employees begin arriving
for work at 06h00. By 09h00 everybody is at work. At 14h00 the early shift leaves work
followed by the rest of the employees at 16h00. At this factory most employees remain
at work all day. Because of this user behaviour it is not critical for the batteries to be
recharged in the early part of the day, hence the wide active power operating range in the
morning, indicated in blue in figure 4.3. It is however imperative to make sure all vehicles
are sufficiently charged for the drive home after work. This results in the progressively
narrower active power operating range towards the end of the day.
The exact hours used in this study are not important, however it is essential to incorporate
the concept of people movement which results in electric vehicle charging stations having
their own unique challenges concerning the provision of electricity services [1]. For this
experiment, feeding power into the grid was not considered.
• Industrial load profile
It was assumed the owner of this industrial load was contracted to provide a certain
13](https://image.slidesharecdn.com/85848e1f-c611-4aa6-a9ae-1842dc3006ca-150223032521-conversion-gate02/75/roy_emmerich-eurec_dissertation-final-14-2048.jpg)
![0123456789101112131415161718192021222324
Timeofday[h]
12000
8000
4000
0
4000
8000
12000
16000
ActivePower[W]
X
X
δPG1
δPG2
δPL1
δPL2
Windmax
Windmin
CHPmax
CHPmin
EV
Chargemax
EV
Chargemin
Ind.Load
max
Ind.Load
min
DEMSConfiguration1
CHP(G1)
WindTurbine(G2)
ElectricVehicle(EV)ChargingStation(L1)
IndustrialLoad(L2)
Figure 4.3: Plot showing the CDE operating ranges resulting from the simulated profiles
15](https://image.slidesharecdn.com/85848e1f-c611-4aa6-a9ae-1842dc3006ca-150223032521-conversion-gate02/75/roy_emmerich-eurec_dissertation-final-16-2048.jpg)
![0123456789101112131415161718192021222324
Timeofday[h]
6000
4000
2000
0
2000
4000
6000
ActivePower[W]
X
X
δPG2
δPG1
δPL1
δPL2
EVCharging
Station
IndustrialLoad
CHP
WindTurbine
SetSC
ScalingtheSCSignal
ElectricVehicle(EV)ChargingStation(L1)
IndustrialLoad(L2)
SecondaryControl(SC)Signal
CHP(G1)
WindTurbine(G2)
Figure 4.4: A graphical description of how the SC signal was scaled to fit the combined
capacity of the CDE’s
16](https://image.slidesharecdn.com/85848e1f-c611-4aa6-a9ae-1842dc3006ca-150223032521-conversion-gate02/75/roy_emmerich-eurec_dissertation-final-17-2048.jpg)
![shallower profit slope than the CHP unit (G1), is therefore less profit sensitive with respect to
a change in active power, and so is chosen first. Based on this criterion, its active power output
is reduced by SCG2. If SCtotal was less than or equal to the available active power operating
range for G2 at this time (δPG2), then it would have been the only generator used to fulfil
the secondary control active power request. However, this is not the case so the more profit
sensitive G1, is employed to make up the shortfall by reducing its active power output by SCG1.
As the decision making process is the same in all three agents, the sub-agents come to the same
conclusion as the root agent concerning the distribution of active power.
A0
A2A1
G1 L1 G2L2
AC
h
δP(W)
SCG1
δPG1
AC
h
δP[W]
δPL1
AC
h
δP[W]
SCG2
δPG2
AC
h
δP[W]
δPL2
AC
h
δP[W]
SCG1
AC
h
δP[W]
SCG2
AC
h
δP[W]
SCtotal
SCG2 SCG1
Figure 5.4: DEMS communication configuration for part 1 showing the distribution of the
incoming secondary control signal across the portfolio of CDE’s. The profit slope graphs shown
in this figure are not drawn to scale. They are merely intended to be indicative. This should
be studied in conjunction with figures 4.3 and 6.6
19](https://image.slidesharecdn.com/85848e1f-c611-4aa6-a9ae-1842dc3006ca-150223032521-conversion-gate02/75/roy_emmerich-eurec_dissertation-final-20-2048.jpg)
![0123456789101112131415161718192021222324
Timeofday[h]
15000
10000
5000
0
5000
10000
15000
ActivePower[W]
Wind
max&set
Wind
min
Ind.Load
max
Ind.Load
min&set
EV
max
EV
min&set
CHPmax&set
CHPmin
TotalPset
DEMSConfiguration1&2
CHP(G1)
WindTurbine(G2)
ElectricVehicle(EV)ChargingStation(L1)
IndustrialLoad(L2)
TotalSetActivePower(P)
Figure 6.1: CDE set values including total P set. Valid for both DEMS configurations
22](https://image.slidesharecdn.com/85848e1f-c611-4aa6-a9ae-1842dc3006ca-150223032521-conversion-gate02/75/roy_emmerich-eurec_dissertation-final-23-2048.jpg)
![0123456789101112131415161718192021222324
Timeofday[h]
15000
10000
5000
0
5000
10000
15000
ActivePower[W]
Wind
max&set
Wind
min
Ind.Load
max
Ind.Load
min&set
EV
max
EV
min&set
CHPmax&set
CHPmin
TotalPset+SCset
SCset
DEMSConfiguration1&2
CHP(G1)
WindTurbine(G2)
ElectricVehicle(EV)ChargingStation(L1)
IndustrialLoad(L2)
TotalSetActivePower(P)+SCset
SecondaryControl(SC)Signal
Figure 6.2: CDE set values including total P set + SC set. Valid for both DEMS configurations
23](https://image.slidesharecdn.com/85848e1f-c611-4aa6-a9ae-1842dc3006ca-150223032521-conversion-gate02/75/roy_emmerich-eurec_dissertation-final-24-2048.jpg)
![0123456789101112131415161718192021222324
Timeofday[h]
15000
10000
5000
0
5000
10000
15000
ActivePower[W]
Wind
max&set
Wind
min
Windmeas
Ind.Load
max
Ind.Load
min&set
EV
max
EVmin
meas&set
CHPmax&set
CHPmin
CHPmeas
TotalPset+SCset
TotalPmeas+SCset
SCset
measurmentsystemfailuremeasurement
system
failures
DEMSConfiguration1
CHP(G1)
WindTurbine(G2)
ElectricVehicle(EV)ChargingStation(L1)
IndustrialLoad(L2)
TotalSet&Meas.ActivePower(P)+SCset
SecondaryControl(SC)Signal
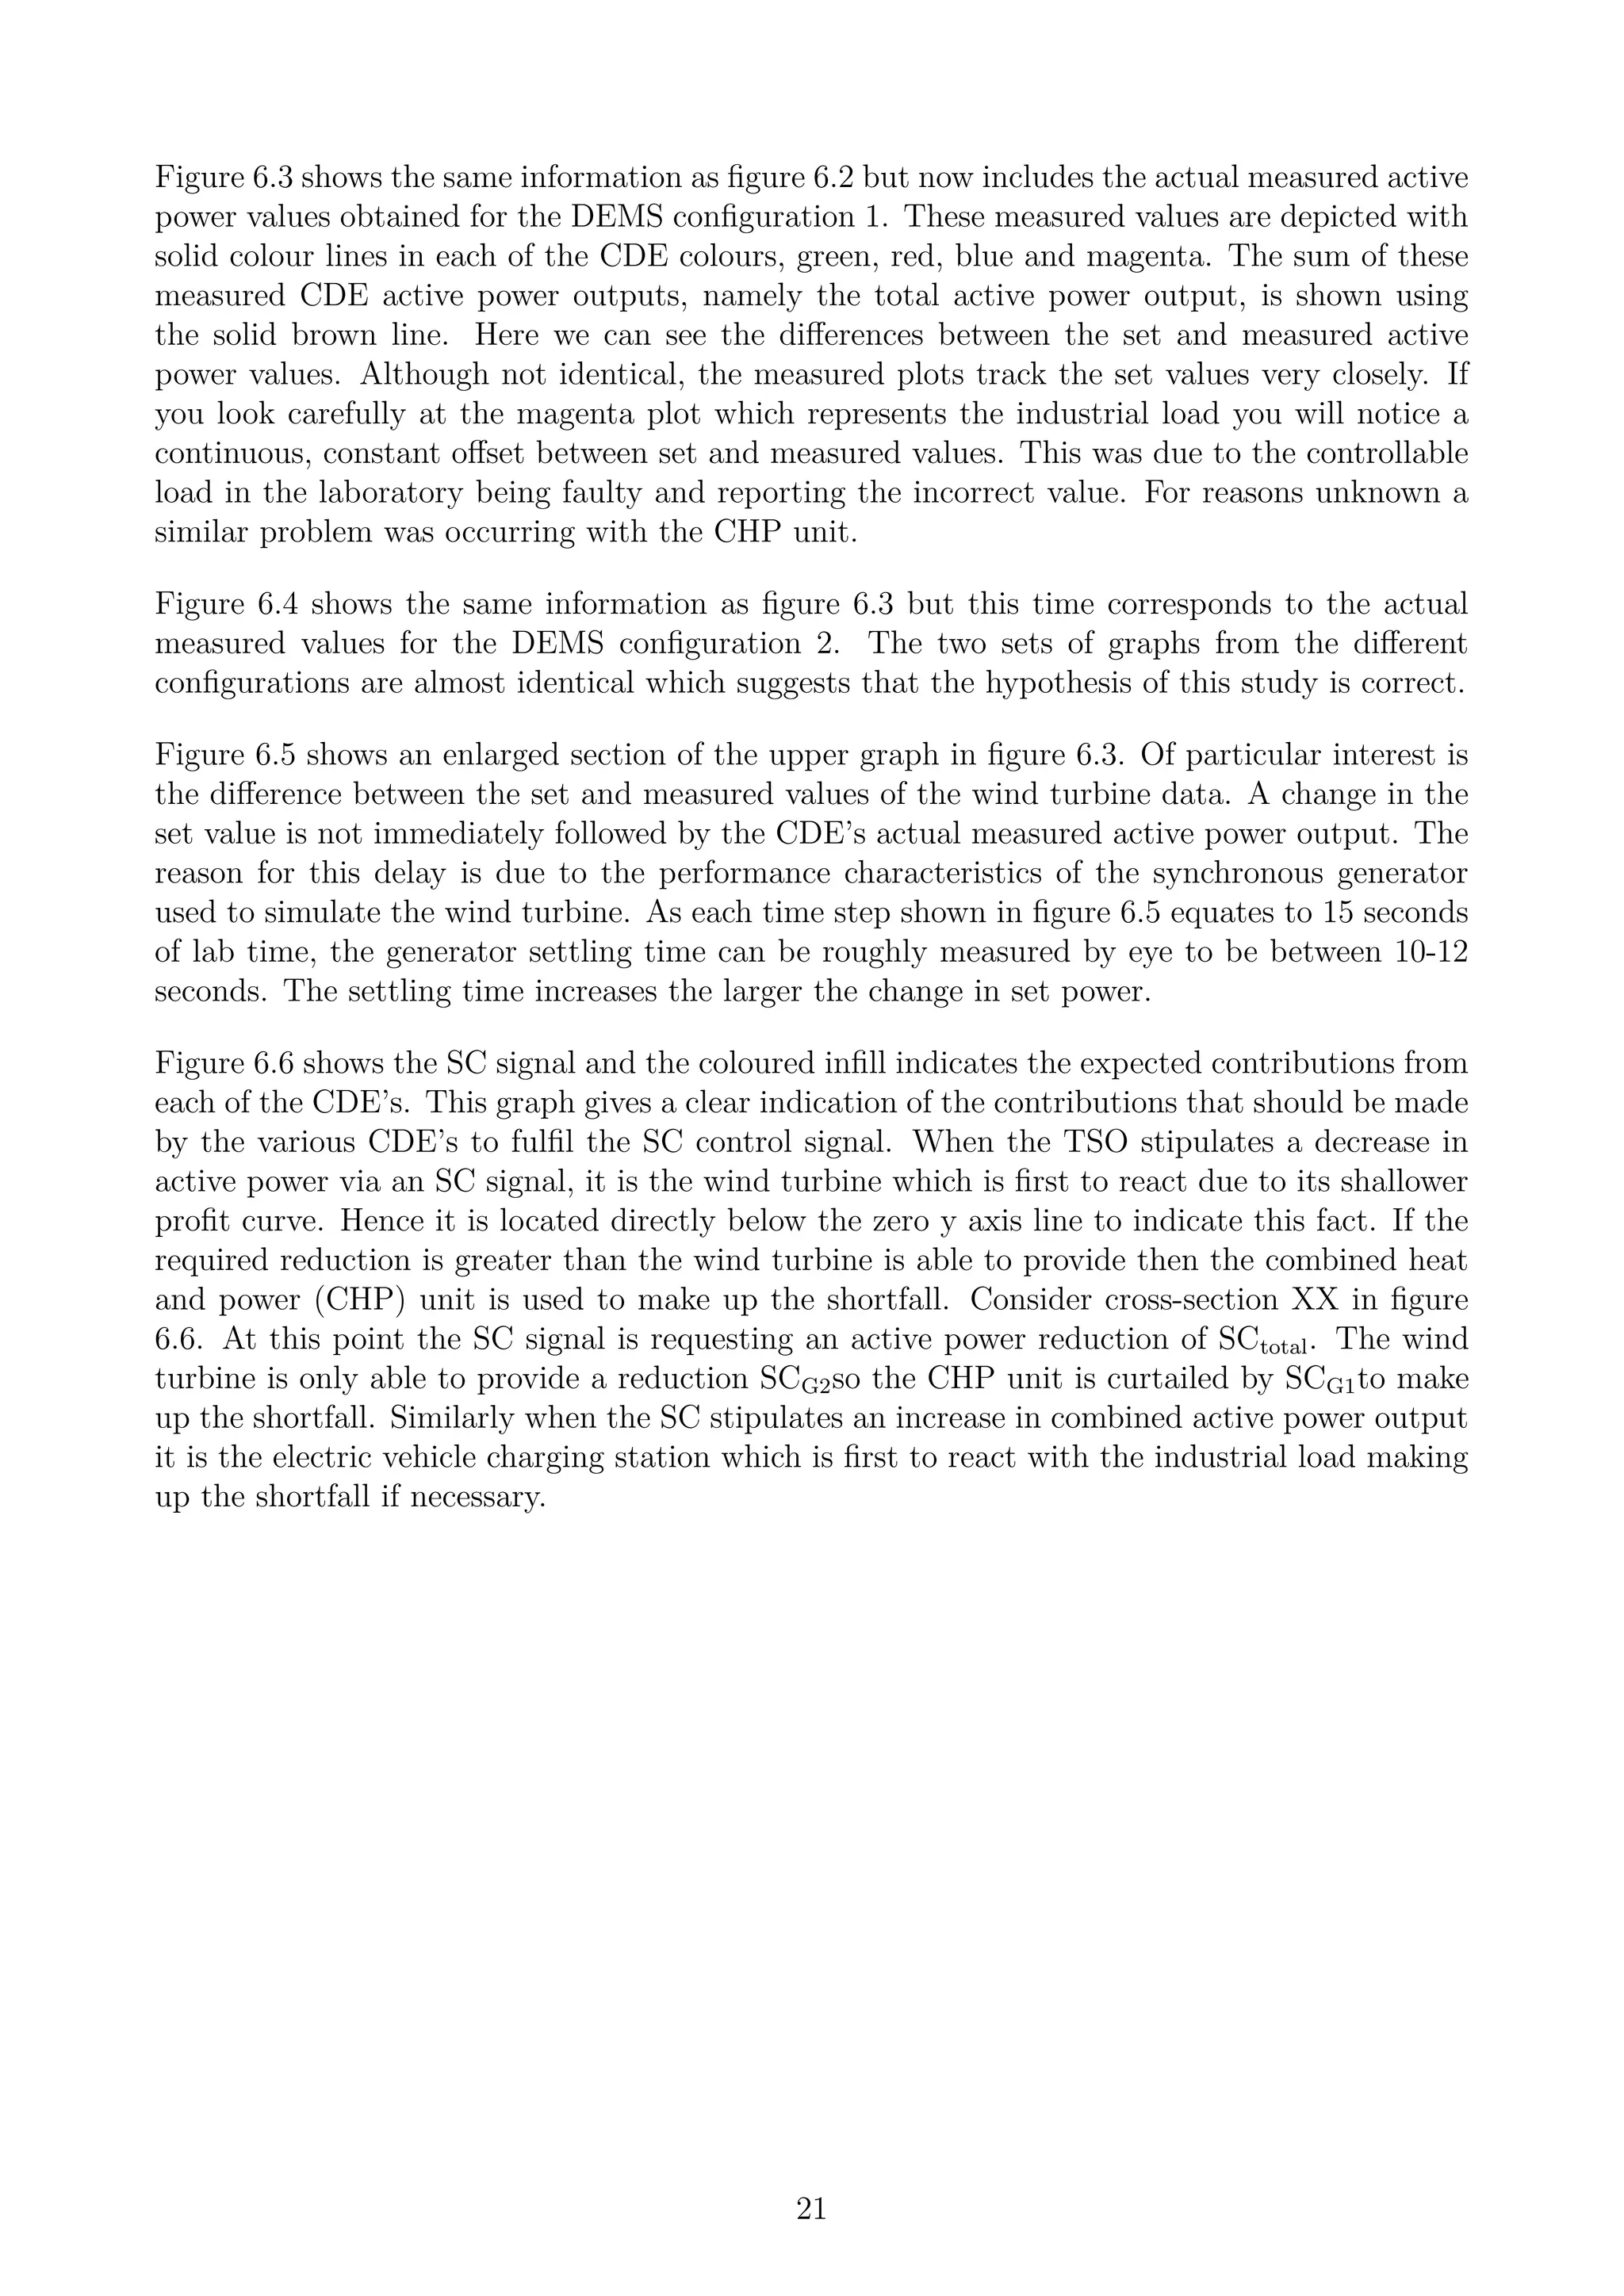
Figure 6.3: Set and measured values from the four CDE’s including the SC signal. Valid for
DEMS configuration 1
24](https://image.slidesharecdn.com/85848e1f-c611-4aa6-a9ae-1842dc3006ca-150223032521-conversion-gate02/75/roy_emmerich-eurec_dissertation-final-25-2048.jpg)
![0123456789101112131415161718192021222324
Timeofday[h]
15000
10000
5000
0
5000
10000
15000
ActivePower[W]
SCset
measurmentsystem
failuresmeasurement
system
failures
DEMSConfiguration2
CHP(G1)
WindTurbine(G2)
ElectricVehicle(EV)ChargingStation(L1)
IndustrialLoad(L2)
TotalSet&Meas.ActivePower(P)+SCset
SecondaryControl(SC)Signal
Figure 6.4: Set and measured values from the four CDE’s including the SC signal. Valid for
DEMS configuration 2
25](https://image.slidesharecdn.com/85848e1f-c611-4aa6-a9ae-1842dc3006ca-150223032521-conversion-gate02/75/roy_emmerich-eurec_dissertation-final-26-2048.jpg)
![10 11 12 13
Time of day [h]
4000
5000
6000
7000
8000
9000
10000
ActivePower[W]
max & set
min
measured
DEMS Configuration 1
Wind Turbine (G2 )
Figure 6.5: Enlarged version of figure 6.3 showing only the wind turbine data. Valid for the
DEMS configuration 1
26](https://image.slidesharecdn.com/85848e1f-c611-4aa6-a9ae-1842dc3006ca-150223032521-conversion-gate02/75/roy_emmerich-eurec_dissertation-final-27-2048.jpg)
![0123456789101112131415161718192021222324
Timeofday[h]
4000
3000
2000
1000
0
1000
2000
3000
4000
ActivePower[W]
X
X
SCtotal
SCG2
SCG1
EVChargingStation
IndustrialLoad
WindTurbineWindTurbine
CHP
CHP
DEMSConfiguration1&2
CHP(G1)
WindTurbine(G2)
SecondaryControl(SC)SetSignal
ElectricVehicle(EV)ChargingStation(L1)
IndustrialLoad(L2)
Figure 6.6: The requested or set secondary control signal showing the expected contribution of
each CDE. Valid for both DEMS configurations
27](https://image.slidesharecdn.com/85848e1f-c611-4aa6-a9ae-1842dc3006ca-150223032521-conversion-gate02/75/roy_emmerich-eurec_dissertation-final-28-2048.jpg)
![A Source Code Extract
This code extract is from the heart of the DEMS. It is the central decision making routine that
is called every time an agent receives a secondary control signal from its superior agent.
def set_delta_p_W(self, delta_p_W):
’’’
delta_p_W - The amount by which you want to change the resultant power
(in Watts) that achieves maximum profit in order to satisfy a secondary
control signal.
’’’
print ’nset_delta_p_W =’, delta_p_W
if delta_p_W == 0:
for client in self.client_list:
client.set_delta_p_W(0)
return
# Get all the available delta P’s with their profit slopes
delta_p_W_list = self.get_delta_p_W()
# Create a list to hold the applicable delta P’s
modified_delta_p_W_list = []
# Sort delta_p_W_list according to the profit slope
delta_p_W_list = sorted(delta_p_W_list, key=operator.itemgetter(1))
if delta_p_W < 0:
# First discard all the clients with a delta >= 0
resultant_client_delta_p_W = {}
for client in delta_p_W_list:
client_delta_p_W = client[0]
client_reference = client[2]
if client_delta_p_W < 0:
modified_delta_p_W_list.append(client)
# Add an item to the dictionary which will be used later.
# Python dictionaries can’t have duplicate client_reference
# keys which is the desired effect.
resultant_client_delta_p_W[client_reference] = 0
# Now work out the delta P for each client
remaining_delta_p_W = delta_p_W
for client in modified_delta_p_W_list:
client_delta_p_W = client[0]
client_reference = client[2]
29](https://image.slidesharecdn.com/85848e1f-c611-4aa6-a9ae-1842dc3006ca-150223032521-conversion-gate02/75/roy_emmerich-eurec_dissertation-final-30-2048.jpg)
![if client_delta_p_W >= remaining_delta_p_W:
resultant_client_delta_p_W[client_reference]+=client_delta_p_W
remaining_delta_p_W -= client_delta_p_W
elif client_delta_p_W < remaining_delta_p_W:
resultant_client_delta_p_W[client_reference]+=remaining_delta_p_W
remaining_delta_p_W = 0
if remaining_delta_p_W == 0:
# Don’t process any more ’cause we’ve got our delta P quota
# Now find the clients which aren’t going to contribute to this
# SC round and set their delta_p_W to zero so they can operate
# at max profit.
# Make a copy of self.client_list
non_sc_contributors = list(self.client_list)
sc_contributors = resultant_client_delta_p_W.keys()
for client in sc_contributors:
non_sc_contributors.remove(client)
for client in non_sc_contributors:
client.set_delta_p_W(0)
# Just set the client delta_p_W by their respective values in
# the resultant_client_delta_p_W dictionary
for sub_client in resultant_client_delta_p_W.items():
sub_client_ref = sub_client[0]
sub_client_delta_p_W = sub_client[1]
sub_client_ref.set_delta_p_W(sub_client_delta_p_W)
return
if delta_p_W > 0:
# First discard all the clients with a delta <= 0
resultant_client_delta_p_W = {}
for client in delta_p_W_list:
client_delta_p_W = client[0]
client_reference = client[2]
if client_delta_p_W > 0:
modified_delta_p_W_list.append(client)
# Add an item to the dictionary which will be used later.
# Python dictionaries can’t have duplicate client_reference
# keys which is the desired effect.
resultant_client_delta_p_W[client_reference] = 0
# Now work out the delta P for each client
remaining_delta_p_W = delta_p_W
for client in modified_delta_p_W_list:
client_delta_p_W = client[0]
client_reference = client[2]
if client_delta_p_W <= remaining_delta_p_W:
resultant_client_delta_p_W[client_reference]+=client_delta_p_W
remaining_delta_p_W -= client_delta_p_W
30](https://image.slidesharecdn.com/85848e1f-c611-4aa6-a9ae-1842dc3006ca-150223032521-conversion-gate02/75/roy_emmerich-eurec_dissertation-final-31-2048.jpg)
![elif client_delta_p_W > remaining_delta_p_W:
resultant_client_delta_p_W[client_reference]+=remaining_delta_p_W
remaining_delta_p_W = 0
if remaining_delta_p_W == 0:
# Don’t process any more ’cause we’ve got our delta P quota
# Now find the clients which aren’t going to contribute to this
# SC round and set their delta_p_W to zero so they can operate
# at max profit.
# Make a copy of self.client_list
non_sc_contributors = list(self.client_list)
sc_contributors = resultant_client_delta_p_W.keys()
for client in sc_contributors:
non_sc_contributors.remove(client)
for client in non_sc_contributors:
client.set_delta_p_W(0)
# Just set the client delta_p_W by their respective values in
# the resultant_client_delta_p_W dictionary
for sub_client in resultant_client_delta_p_W.items():
sub_client_ref = sub_client[0]
sub_client_delta_p_W = sub_client[1]
sub_client_ref.set_delta_p_W(sub_client_delta_p_W)
return
31](https://image.slidesharecdn.com/85848e1f-c611-4aa6-a9ae-1842dc3006ca-150223032521-conversion-gate02/75/roy_emmerich-eurec_dissertation-final-32-2048.jpg)

![C Bibliography
[1] C. Guille and G. Gross, “A conceptual framework for the vehicle-to-grid (V2G) implemen-
tation,” Energy Policy, 2009, doi:10.1016/j.enpol.2009.05.053.
[2] M. Braun and P. Strauss, “A review on aggregation approaches of controllable distributed
energy units in electrical power systems,” International Journal of Distributed Energy
Resources, vol. 4, 2008, pp. 297-319.
[3] G. Schaeffer and H. Akkermand, “CRISP - Distributed Intelligence in Critical Infras-
tructures for Sustainable Power,” Petten, Netherlands: Energy Research Centre of the
Netherlands, 20061
.
[4] T. Degner, J. Schmid, and P. Strauss, “DISPOWER - Distributed Generation with High
Penetration of Renewable Energy Sources,” Kassel, Germany: Institut für Solare Energiev-
ersorgungstechnik e.V., 20062
.
[5] “ENTSO-E Policy 1: Load-Frequency Control and Performance,” Operation Handbook,
04-20093
.
[6] “EUDEEP - The birth of a EUropean Distributed EnErgy Partnership,” Final Reports,
20094
.
[7] “FENIX Project - FENIX Deliverable 4.1.1: Specification of laboratory tests,” Technical
Report, Kassel, Germany: Institut für Solare Energieversorgungstechnik e.V., 20085
.
[8] S. Riedel and H. Weigt, “German Electricity Reserve Markets,” Electricity Markets Work-
ing Papers, 20076
.
[9] ”OpenOPC for Python - OPC for the Python programming language,” Website7
, Accessed
On: 22-11-2009
[10] J. Kok, C. Warmer, and I. Kamphuis, “PowerMatcher: Multiagent Control in the Elec-
tricity Infrastructure,” Utrecht, Netherlands: Energy Research Centre of the Netherlands,
20058
.
[11] M. Braun, “Provision of Ancillary Services by Distributed Generators - Technological and
Economic Perspective,” University of Kassel, Germany, 20089
.
[12] “Pyro - Python Remote Objects,” Website10
, Accessed On: 22-11-2009.
[13] “Python Programming Language – Official Website,” Website, Accessed On: 22-11-200911
.
1
http://crisp.ecn.nl/deliverables/D5.3.pdf
2
http://www.iset.uni-kassel.de/dispower_static/documents/fpr.pdf
3
http://www.entsoe.eu/fileadmin/user_upload/_library/publications/ce/oh/Policy1_final.pdf
4
http://www.eu-deep.org
5
Available soon here:http://www.fenix-project.org
6
http://ssrn.com/abstract=1137282
7
http://openopc.sourceforge.net
8
http://www.powermatcher.net/fileadmin/..../AAMAS_Article_PowerMatcher_DistributionVersion.pdf
9
http://www.upress.uni-kassel.de/publik/978-3-89958-638-1.volltext.frei.pdf
10
http://pyro.sourceforge.net
11
http://www.python.org
34](https://image.slidesharecdn.com/85848e1f-c611-4aa6-a9ae-1842dc3006ca-150223032521-conversion-gate02/75/roy_emmerich-eurec_dissertation-final-35-2048.jpg)

- The document describes a flexible distributed energy management system (DEMS) designed and implemented by Roy Emmerich to investigate grid integration of distributed energy resources. - The DEMS uses a hierarchical, agent-based model to aggregate and control distributed generators, loads, and storage units in a laboratory environment. - The goal is to enable distributed energy resources to provide grid services like secondary frequency control currently provided by large centralized power plants.