Download as PDF, PPTX

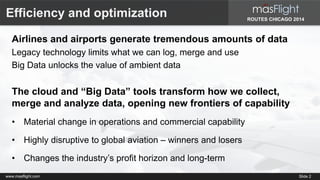
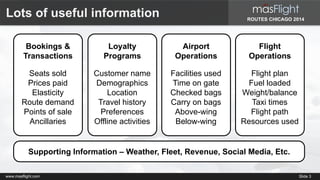
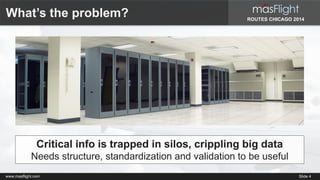
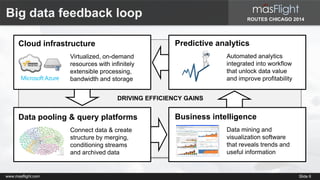
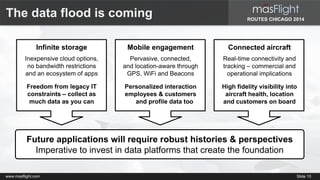
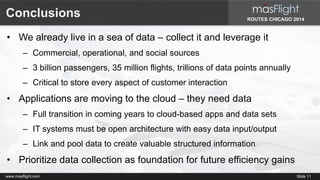


The document discusses how big data can significantly enhance aviation efficiency by enabling better data collection, merging, and analysis. It emphasizes the need for structured and standardized data to unlock insights from various operational metrics, ultimately improving profitability and decision-making in the aviation sector. The presentation highlights the necessity for cloud-based platforms that facilitate data integration and the importance of investing in data infrastructure for future gains.


