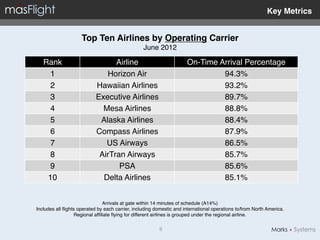
1. CVG had high completion rates above 98% for departures and arrivals for all carriers.
2. Mainline carriers at CVG had the best on-time performance with over 90% of departures within 15 minutes of schedule.
3. Delta flights, which make up the majority at CVG, had the best on-time rates among carriers with over 86% of departures and 87.5% of arrivals on time.
masFlight is a leading analytics platform for aviation, combining global flight information with weather, airport, fleet and economic data. At the World Route Development Forum yesterday, masFlight and OAG, the market leader in airline schedule data, announced a new partnership to jointly develop operations data analysis tools to enable airlines and airports to understand their own and competitors’ operational performance.
masFlight is the leading analytics platform for aviation, combining global flight information with weather, airport, fleet and economic data. masFlight combines powerful cloud databases, an easy-to-use web application, and hosted business intelligence solutions to give airlines, airports and travel industry companies unprecedented visibility into flight and ground operations, market opportunities, and cost efficiencies. For more information on masFlight, please visit www.masflight.com.
masFlight is a leading analytics platform for aviation, combining global flight information with weather, airport, fleet and economic data. At the World Route Development Forum yesterday, masFlight and OAG, the market leader in airline schedule data, announced a new partnership to jointly develop operations data analysis tools to enable airlines and airports to understand their own and competitors’ operational performance.
Monthly Performance Report August 2012Joshua Marks
masFlight is a leading analytics platform for aviation, combining global flight information with weather, airport, fleet and economic data. At the World Route Development Forum yesterday, masFlight and OAG, the market leader in airline schedule data, announced a new partnership to jointly develop operations data analysis tools to enable airlines and airports to understand their own and competitors’ operational performance.
AGIFORS Operations Conference PresentationJoshua Marks
Presentation to the AGIFORS 2012 Operations Conference in Atlanta, Georgia. This presentation illustrates performance trends in the U.S. airline industry and identifies the impact of good weather on flight delays and cancellations during 2012.
Prepared using the masFlight platform. masFlight is a leading analytics platform for aviation, combining global flight information with weather, airport, fleet and economic data. At the World Route Development Forum yesterday, masFlight and OAG, the market leader in airline schedule data, announced a new partnership to jointly develop operations data analysis tools to enable airlines and airports to understand their own and competitors’ operational performance.
Monthly Performance Report February 2012Joshua Marks
masFlight is the leading analytics platform for aviation, combining global flight information with weather, airport, fleet and economic data. masFlight combines powerful cloud databases, an easy-to-use web application, and hosted business intelligence solutions to give airlines, airports and travel industry companies unprecedented visibility into flight and ground operations, market opportunities, and cost efficiencies. For more information on masFlight, please visit www.masflight.com.
masFlight is a leading analytics platform for aviation, combining global flight information with weather, airport, fleet and economic data. At the World Route Development Forum yesterday, masFlight and OAG, the market leader in airline schedule data, announced a new partnership to jointly develop operations data analysis tools to enable airlines and airports to understand their own and competitors’ operational performance.
Monthly Performance Report August 2012Joshua Marks
masFlight is a leading analytics platform for aviation, combining global flight information with weather, airport, fleet and economic data. At the World Route Development Forum yesterday, masFlight and OAG, the market leader in airline schedule data, announced a new partnership to jointly develop operations data analysis tools to enable airlines and airports to understand their own and competitors’ operational performance.
AGIFORS Operations Conference PresentationJoshua Marks
Presentation to the AGIFORS 2012 Operations Conference in Atlanta, Georgia. This presentation illustrates performance trends in the U.S. airline industry and identifies the impact of good weather on flight delays and cancellations during 2012.
Prepared using the masFlight platform. masFlight is a leading analytics platform for aviation, combining global flight information with weather, airport, fleet and economic data. At the World Route Development Forum yesterday, masFlight and OAG, the market leader in airline schedule data, announced a new partnership to jointly develop operations data analysis tools to enable airlines and airports to understand their own and competitors’ operational performance.
Monthly Performance Report February 2012Joshua Marks
masFlight is the leading analytics platform for aviation, combining global flight information with weather, airport, fleet and economic data. masFlight combines powerful cloud databases, an easy-to-use web application, and hosted business intelligence solutions to give airlines, airports and travel industry companies unprecedented visibility into flight and ground operations, market opportunities, and cost efficiencies. For more information on masFlight, please visit www.masflight.com.
Monthly Performance Report January 2012Joshua Marks
masFlight is the leading analytics platform for aviation, combining global flight information with weather, airport, fleet and economic data. masFlight combines powerful cloud databases, an easy-to-use web application, and hosted business intelligence solutions to give airlines, airports and travel industry companies unprecedented visibility into flight and ground operations, market opportunities, and cost efficiencies. For more information on masFlight, please visit www.masflight.com.
Overview of the masFlight platform. masFlight is an analytics platform for aviation. masFlight combines global flight information with weather, airport, fleet and economic data. Airlines, airports and vendors use masFlight to review performance, manage disruption, evaluate opportunities, improve efficiency, and benchmark competitors. For more information, visit: www.masflight.com.
Reading In The Future, it is a series of forecasting presentations, concerning airlines, most of the airlines addressing their performance of current month for current year to the same month of the previous year, i.e is month by month comparison by looking backward, no target setting/ level to achieve. Today the story is different and the approach is unique, airlines can define their seasonality patterned and consequently set their targets in future, and it is your decision to look backward and stick on it, or move onward by setting your targets and try to achieve them..
From FAA Forecast Conference, March 2007. Reviews the future of long-haul LCC (Low-cost carrier) business models in aviation. Presents economic analysis of all-economy cabin services and differentiated premium business models.
Airline and Airport Big Data: Impact and EfficienciesJoshua Marks
Keynote presentation at Routes 2014 in Chicago - how big data changes aviation efficiencies, and what airlines and airports need to know about cloud data warehouses, real-time integration and predictive analytics.
Business intelligence and airline operational improvementJoshua Marks
From SITA IT Conference in Brussels, 19 June 2013. I review how big data analytics can fundamentally improve visibility into operational challenges and change cross-departmental goals. I give specific examples of how business intelligence can change both operational performance and efficiency.
Airline Mergers, Competition and Impact: 2005-2013Joshua Marks
A comprehensive review of the U.S. aviation industry market and seat share in 2013, merger and consolidation history from 2005 to 2013, and competitive dynamics in the post-consolidation airline market. Specific focus on the US Airways - America West deal, followed by Delta-Northwest, United-Continental, Southwest-AirTran and US Airways-American. The presentation captures the highest revenue O&D routes for each consolidated airline as well as the impact of shifting alliance shares in the U.S. and intercontinental markets. As presented to
Incorporating Gate Variability in Airline Block PlanningJoshua Marks
Presentation at AGIFORS SSP May 21, 2013. Reviews variability of gate taxi-out time and how on-time performance improvements can be driven by incorporating taxi variability into block plans.
Presentation given at MRO Americas 2013 in Atlanta (April 16th). Discusses the impact of red-eye flight operations, quick gate turns and utilization targets on airline on-time performance. The presentation illustrates the strong negative correlation between additional aircraft utilization and propagating system delays, with an average seven minute delay penalty for flights after a red-eye versus those after overnight maintenance activity. Provides metrics for application in airline schedule planning.
AAI masFlight Webinar on American and US AirwaysJoshua Marks
On Thursday, March 14, at 10:30 AM EST, Josh Marks and Darryl Jenkins hosted a webinar to examine examine airline consolidation and competition considerations surrounding the recently proposed merger between American Airlines and US Airways.
The webinar presented:
Competition before and after US/AA and WN/FL integration;
AA/US overlap by routes and airports served;
Competition by city, not just specific airport;
Low-cost competition overlap; and
Competitive changes, paying particular attention to smaller markets where US/AA dominate.
AGIFORS Presentation: Assessing U.S. Gate UtilizationJoshua Marks
Presented at AGIFORS Annual Symposium. This presentation analyzes airport gate usage and delays across U.S. carriers during the summer 2012 season. Using the masFlight data warehouse, I demonstrate differences in gate utilization strategies, scheduled and actual aircraft turn times, and how those strategies impact operational robustness and delays. I show how individual gate assignments can make significant differences in on-time performance, opening opportunities for granular block time planning and airport-level coordination.
Routes 2012, 2 October: Presentation on Alliance Coverage and Gulf Carrier Pe...Joshua Marks
Using the masFlight platform, we show that Qatar Airways leads the Middle East’s three super carriers in ontime performance, while Emirates maintains its advantage on network scale and destinations served. This presentation was prepared in partnership with OAG.
Presented on 2 October at the OAG-hosted World Route Development Forum in Abu Dhabi, UAE. According to masFlight’s comparative data analysis, Qatar Airways is currently leading the Gulf’s ‘superconnectors’ in ontime performance. However, when it comes to global network footprint and connectivity, Emirates still enjoys a clear advantage.
However, Emirates, Qatar and Etihad are all still in the infancy of their network expansion and the competition they present to airline alliances is increasing. The key route expansion opportunities for Gulf carriers are with the United States, overflying European hubs. We can therefore expect to see an accelerating ‘land grab’ by Middle East airlines, especially for neutral airports like Boston’s Logan International, and for US hubs with a European focus, such as Detroit Metropolitan Wayne County, Miami International and Philadelphia International.
Regarding the airline alliances, our analysis shows that oneworld needs to add member airlines to compete effectively with Star Alliance and SkyTeam. Star Alliance has by far the greatest network reach, with top coverage across the 1,000 major global markets. In contrast, SkyTeam’s strength is efficiency: its strong, centralised hubs give the alliance great geographic reach through fewer flights that Star. Trailing the pack is oneworld, which while competitive in key cities and market pairs needs new members to increase its coverage globally.
masFlight is a leading analytics platform for aviation, combining global flight information with weather, airport, fleet and economic data. At the World Route Development Forum on 1 October 2012, masFlight and OAG, the market leader in airline schedule data, announced a new partnership to jointly develop operations data analysis tools to enable airlines and airports to understand their own and competitors’ operational performance.
2. masFlight Solutions"
Daily Email Report"
!
We offer masFlight Daily, a free daily email report for
airlines, airports, and aviation-focused professionals.
We summarize weather and operational performance by
carrier, by fleet type, and by hub operation. !
!
Sign up for free daily reports at:!
masflightdaily.com!
masFlight Web Application"
!
Operational data is critical to solid planning. masFlight
centralizes information in an easy-to-use, subscription-based
app for airlines, airports, and industry vendors. Combining
revenue, schedule, operations and weather data, our platform
revolutionizes schedule planning, operations analysis, air
service development, airport operations and new opportunities.
!
For a free trial, contact solutions@masflight.com"
2!
3. Contents"
Monthly Performance Report
U.S. Carriers, June 2012"
Section" Contents" Slide"
Introduction! Methodology! 4!
Glossary of Terms! Explanation of aviation terms used! 5!
Key Metrics! June 2012 By Carrier, Rankings! 6!
Airport Summaries! Top 5 Departures, Arrivals; Delay Programs! 10!
Airport Deep-Dive of the Month! Analysis for Cincinnati/Northern Kentucky ! 12!
Market Profile of the Month! Northeast to Florida ! 14!
Individual Carrier Metrics! Summary & detail for individual carriers! 16!
To receive this report by email each month, please visit masflight.com"
3!
4. Introduction"
Monthly Performance Report: June 2012"
The masFlight Monthly Performance Report summarizes United States airline performance. !
"
Differences from DOT ASQP (“On-Time”) Reports. We collect flight information for most scheduled
carriers, including both “mainline” hub-and-spoke airlines and their regional affiliates. DOT’s on-time
data reports differ from ours because:!
"
(1) Some carriers are excluded from DOT reports. Only airline certificates with 1% or greater
share of scheduled-service domestic passenger revenue report on-time data to DOT. Many low
fare and regional carriers are therefore excluded. Our report captures most of these carriers. !
(2) Our report includes international flights by U.S. carriers. DOT includes only domestic flight
operations in its report, since carriers do not report international flights."
(3) DOT reports on-time performance by operating carrier, not by marketing carrier. For
example, both United and Delta market regional flights that are operated by SkyWest. We report
performance by operating carrier (e.g. SkyWest as a discrete entity) and by marketing carrier. !
(4) DOT reports focus on on-time arrivals only. We focus on three operational statistics.
“D15” performance is the percent of flights that depart the gate within 15 minutes of schedule.
“A14” performance is the percent that arrive at the destination gate within 14 minutes of schedule.
“CF” (or Completion Factor) is the percent of flights scheduled that arrive at their destination,
net of cancellations and non-completed diversions. "
4!
5. Definitions"
Terms Used
Italicized terms are the key definitions used !
Term" Definition"
CF% (Completion Factor)! The percent of flights scheduled that arrive at their destination!
D0%" Flights that depart from their origin by the scheduled departure time!
D15% (On-Time Departures)! Flights that depart from their origin within 15 minutes of the scheduled time!
A0%" Flights that arrive at their destination on or before scheduled arrival time!
A14% (On-Time Arrivals)! Flights that arrive at their destination within 14 minutes of schedule!
Gate Turn Time" The “on-gate” time between gate arrival and gate departure for a given aircraft!
Scheduled Gate Turn" Turn time defined by scheduled arrival to scheduled departure time!
Actual Gate Turn" Turn time defined by actual arrival to actual departure time!
Taxi-Out Time" Time from gate departure to runway takeoff!
Taxi-In Time" Time from runway landing to gate arrival!
Ground Delay Program" FAA delays for flights at departure airport for flights into a specific facility!
5!
6. Key Metrics"
U.S. Airline System Performance Metrics
June 2012!
Departures" Arrivals"
U.S. Airline Tracked
Category" Flights" Completed " On Schedule" On-time" On Schedule" On-time "
CF%! D0%! D15%" A0%! A14%"
All U.S. Airlines" 741,903! 98.7%! 61.9%! 82.2%" 61.4%! 80.8%"
Mainline Airlines! 251,303! 99.0%! 61.5%! 82.9%" 62.4%! 81.2%"
Low Fare Airlines! 160,745! 99.4%! 51.7%! 79.8%" 57.7%! 79.9%"
Regionals ! 329,855! 98.0%! 67.3%! 83.0%" 62.5%! 81.0%"
All U.S. Airlines include all U.S. carriers tracked by masFlight!
Mainline Airlines include American, Alaska, Continental, Delta, Hawaiian, United, and US Airways!
Low Fare Airlines include JetBlue, AirTran, Frontier, Spirit and Southwest!
Regionals include Pinnacle, Colgan, Trans States, CommutAir, Compass, ASA, GoJet, PSA, American Eagle, Comair, SkyWest, Executive,
Piedmont, Horizon, Chautauqua, Shuttle America, ExpressJet, Cape Air (United), Mesaba, Mesa, Republic, Silver, and Air Wisconsin. "
6!
7. Key Metrics"
U.S. Carrier Summaries
June 2012!
All Flights! Mainline Only! Regional Carriers!
Airline" Tracked" CF%" D15%" A14%" Tracked" CF%" D15%" A14%" Tracked" CF%" D15%" A14%"
American" 106,348" 98.2! 84.0! 82.5" 55,699" 98.4! 82.7! 80.9" 50,649" 97.9! 85.4! 84.3"
Alaska" 25,610" 99.2! 91.7! 90.5" 14,284" 99.6! 90.6! 88.4" 11,326" 98.7! 93.0! 93.1"
United" 173,276" 98.1! 75.4! 74.2" 61,783" 98.5! 71.1! 70.4" 111,493" 97.9! 77.8! 76.3"
Delta" 169,551" 98.9! 85.7! 84.1" 74,506" 99.6! 86.2! 85.1" 95,045" 98.3! 85.2! 83.2"
Frontier" 10,110" 99.5! 79.2! 74.3" 7,303" 99.8! 79.5! 75.2" 2,807" 98.9! 78.5! 72.1"
US Airways" 97,031" 98.4! 87.1! 83.5" 38,227" 99.2! 90.1! 86.5" 58,804" 97.9! 85.1! 81.6"
AirTran" 20,454" 99.7! 90.2! 85.7"
JetBlue" 22,422" 98.9! 78.7! 77.9"
Hawaiian" 6,812" 99.9! 96.0! 93.2"
Southwest" 98,766" 99.3! 78.6! 80.4"
Spirit" 6,978" 99.8! 66.7! 64.2"
Virgin America" 4,920" 99.9! 84.8! 83.8"
(a) Mainline flights marketed by Continental and United are operated by United"
Includes flights to, from and within North America only
"
CF% = Completed Flights (not cancelled or diverted)!
D15% = On-time Flight Departures!
A14% = On-time Flight Arrivals!
7!
8. Key Metrics"
Top Ten Airlines by Marketing Carrier
June 2012!
Rank! Airline! On-Time Arrival Percentage!
1! Hawaiian Airlines! 93.2%!
2! Alaska Airlines! 90.5%!
3! AirTran Airways! 85.7%!
4! Delta Airlines! 84.1%!
5! Virgin America! 83.8%!
6! US Airways! 83.5%!
7! American Airlines! 82.5%!
8! Southwest Airlines! 80.4%!
9! JetBlue Airways! 77.9%!
10! Frontier Airlines! 74.3%!
Arrivals at gate within 14 minutes of schedule (A14%)!
Includes all flights marketed by the carrier: domestic, regional affiliate flying, and international operations.!
Excludes codeshare flights operated by other airlines. !
8!
9. Key Metrics"
Top Ten Airlines by Operating Carrier
June 2012!
Rank! Airline! On-Time Arrival Percentage!
1! Horizon Air! 94.3%!
2! Hawaiian Airlines! 93.2%!
3! Executive Airlines! 89.7%!
4! Mesa Airlines! 88.8%!
5! Alaska Airlines! 88.4%!
6! Compass Airlines! 87.9%!
7! US Airways! 86.5%!
8! AirTran Airways! 85.7%!
9! PSA! 85.6%!
10 ! Delta Airlines! 85.1%!
Arrivals at gate within 14 minutes of schedule (A14%)!
Includes all flights operated by each carrier, including domestic and international operations to/from North America.!
Regional affiliate flying for different airlines is grouped under the regional airline.!
9!
10. Best & Worst Airports: Departures"
Best Performing Major Airports by Departure Performance
June 2012 (All Flights)!
Airport" Flights From:" CF%" D0%" D15%"
SLC" Salt Lake City! 99.6%! 74.5%! 90.3%"
SEA" Seattle/Tacoma Int’l! 99.5%! 65.1%! 88.2%"
CLT" Charlotte Douglas! 99.1%! 68.9%! 87.1%"
MSP" Minneapolis/St. Paul! 99.1%! 72.1%! 85.4%"
SAN" San Diego! 99.0%! 60.8%! 85.3%"
Worst Performing Major Airports by Departure Performance"
June 2012 (All Flights)!
Airport" Flights From:" CF%" D0%" D15%"
EWR" Newark Liberty Int’l! 97.7%! 46.9%! 69.8%"
IAH" George Bush Intercontinental! 98.8%! 41.5%! 73.0%"
SFO" San Francisco Int’l! 97.9%! 46.7%! 73.0%"
MDW" Chicago Midway! 99.5%! 42.0%! 74.8%"
DEN" Denver Int’l! 99.2%! 47.3%! 76.1%"
For definitions, see notes at beginning of presentation.!
10!
11. Best & Worst Airports: Arrivals"
Best Performing Major Airports by Arrival Performance
June 2012 (All Flights)!
Airport" Flights To:" A0%" A14%"
SLC" Salt Lake City! 70.3%! 89.0%"
PHX" Phoenix Sky Harbor! 67.6%! 87.9%"
CLT" Charlotte Douglas! 67.5%! 86.9%"
SEA" Seattle/Tacoma Int’l! 64.6%! 85.8%"
MSP" Minneapolis/St. Paul! 70.9%! 85.2%"
Worst Performing Major Airports by Arrival Performance"
June 2012 (All Flights)!
Airport" Flights To:" A0%" A14%"
SFO" San Francisco Int’l! 52.4%! 70.3%"
EWR" Newark Liberty Int’l! 54.8%! 71.5%"
FLL" Ft. Lauderdale/Hollywood! 54.1%! 75.0%"
IAH" George Bush Intercontinental! 55.3%! 75.8%"
LGA" New York LaGuardia! 59.2%! 77.2%"
For definitions, see notes at beginning of presentation.!
11!
12. Airport of the Month: CVG"
Airport Deep-Dive of the Month: Cincinnati/Northern Kentucky (CVG)"
June 2012!
CVG Departures! CVG Arrivals!
By Category!
CF%! D0%! D15%" A0%! A14%"
All Carriers Serving CVG" 98.4%! 71.5%! 85.5%" 68.9%! 84.4%"
Mainline Airlines" 99.5%! 74.2%! 90.0%" 71.9%! 88.5%"
Low Fare Airlines" 100.0%! 71.4%! 100%" 57.1%! 71.4%"
Regional Airlines " 98.2%! 70.9%! 84.5%" 68.3%! 83.5%"
CVG Departures! CVG Arrivals!
By Marketing Carrier!
CF%! D0%! D15%" A0%! A14%"
Delta" 98.7%! 72.4%! 86.4%" 73.8%! 87.5%"
United" 97.1%! 66.8%! 79.4%" 53.8%! 70.5%"
American" 98.8%! 72.7%! 86.8%" 61.6%! 82.2%"
US Airways" 97.4%! 69.5%! 85.7%" 63.3%! 83.9%"
Air Canada" 95.8%! 58.7%! 78.3%" 50.0%! 78.3%"
Frontier" 100.0%! 71.4%! 100.0%" 57.1%! 71.4%"
Marketing Carrier includes mainline and regional flights, excludes code shares! 12!
13. Airport of the Month: CVG"
Cincinnati/Northern Kentucky Airport"
METHODOLOGY FOR GATE TURNS" Scheduled Gate Actual
Terminal "
Turn" Gate Turn"
• Identify valid gate turns by tracking 2" 34.1" 37.0"
3" 54.2" 61.9"
inbound and outbound aircraft and CVG" 51.3 min" 58.3 min"
gate assignments by flight number!
• Exclude remain overnight (RON) and
gates with two or more concurrent
flight operations (e.g. non-jetway)! Scheduled Turn Actual"
Airline"
Time" Turn Time"
American" 35.8! 36.1!
EXAMPLE OF GATE TURN TIMES" Delta" 56.8! 65.3!
Actual Sched. Sched. Actual United" 30.3! 38.9!
Arrival" Arrival! Departure! Departure" US Airways" 34.4! 36.2!
Time" Time! Time! Time"
9:50a! 10:00a! 10:45a! 11:00a!
SCHEDULED GATE TURN (45 min)!
ACTUAL GATE TURN (70 min)"
13!
14. Market Profile: Northeast to Florida"
Market Profile of the Month: Northeast to Florida"
Key Northeast to Florida Market Performance – Southbound!
June 2012!
Route" CF%" D0%" D15%" A0%" A14%"
NYC - Florida" 98.8%! 60.4% ! 79.2% ! 63.3% ! 76.5% !
Boston - Florida " 98.8% ! 60.7% ! 80.2% ! 62.7% ! 79.2% !
DC - Florida " 99.5% ! 52.8% ! 81.0% ! 52.7% ! 77.9% !
Key Northeast to Florida Market Performance – Northbound!
June 2012 !
Route" CF%" D0%" D15%" A0%" A14%"
Florida - NYC 98.7% 60.7% 77.6% 62.6% 77.6%
Florida - Boston 98.9% 60.6% 79.6% 59.5% 78.8%
Florida - DC 99.2% 62.1% 83.0% 57.8% 79.4%
14!
15. Market Profile: Northeast to Florida"
Market Profile of the Month – Northeast to Florida(cont’d)"
A14% Performance from Washington DC and Boston to Florida!
June 2012!
US
WN
UA
NK
FL
B6
AA
WN
NK
FL
DL
B6
AA
82.2%
86.3%
72.5%
36.7%
69.2%
83.3%
DC
-‐
Florida
70.2%
BOS
-‐
Florida
93.3%
83.1%
85.6%
75.8%
83.8%
86.3%
86.5%
80.8%
56.7%
78.2%
83.3%
Florida
-‐
DC
52.4%
Florida
-‐
BOS
83.3%
84.7%
74.9%
80.9%
76.6%
70.2%
0.0%
20.0%
40.0%
60.0%
80.0%
100.0%
0.0%
20.0%
40.0%
60.0%
80.0%
100.0%
On-Time Arrivals (A14%)" On-Time Arrivals (A14%)"
15!
16. Market Profile: Northeast to Florida"
Market Profile of the Month – Northeast to Florida(cont’d)"
A14% Performance from NYC to Florida!
June 2012!
WN
UA
NK
FL
DL
B6
AA
82.4%
70.7%
61.4%
NYC
-‐
Florida
70.3%
80.4%
75.4%
82.7%
80.9%
73.8%
67.5%
Florida
-‐
NYC
82.8%
81.7%
76.4%
79.4%
0.0%
10.0%
20.0%
30.0%
40.0%
50.0%
60.0%
70.0%
80.0%
90.0%
On-Time Arrivals (A14%)"
16!
39. Methodology"
Notes & Methods"
Methodology. masFlight operations data is collected from various operational and schedule
providers and matched using proprietary algorithms. Data sources include flight, schedule and aircraft
position data obtained from airlines, purchased from third-party commercial vendors, and collected
from real-time information feeds from the Federal Aviation Administration, NOAA and other
government sources. !
!
Legal Terms of Use. You may not sell, sublicense, transfer, reverse engineer, distribute or otherwise
alter any part of masFlight Daily Reports without prior approval from Marks Systems Inc. You may not
utilize masFlight data for any aviation, commercial, operational, law enforcement, or judicial activity
that relies on the accuracy, availability, or validity of the data or summaries provided, including for any
passenger rights claims actions such as those under DOT Part 259 or EU Regulation 261/2004.!
!
masFlight is a registered trademark of Marks Systems Inc.!
Copyright 2012 Marks Systems Inc., masflight.com, All Rights Reserved!
!
For more information, please contact:!
Edmund Otubuah"
Director of Aviation Products"
edmund@markssystems.com!
39!
40. About Marks Systems"
We host, normalize, link and expose big data to users
worldwide. Our vertical market solutions feature easy-
to-use self-service tools. masFlight is our aviation Marks Systems is a privately
platform focused on airlines, airports, and analysts.! held company based in the
Washington, DC area."
Marks Systems provides integrated data warehousing and analysis !
applications for vertical markets.! !
! Marks Systems Inc.!
Marks Systems provides a core platform of climate, geography, 4833 Rugby Avenue!
population demographics, transportation/logistics, energy, and other
official and commercial data sets that can be easily referenced and
Suite 301!
incorporated into other applications.! Bethesda, MD 20814!
! (888) 809-2750 Toll-Free!
We provide advanced query tools that can search, link, validate and !
present information, either through our hosted web/tablet applications, MarksSystems.com!
masXML, our web services interface, or our SQL hosting service.! !
!
With extensive backgrounds in enterprise software, data warehousing, Press Contact:"
and analysis tools, our team knows validation, optimization and interface media@markssystems.com!
design. We set out to build a flexible, scalable solution for warehousing !
and linking diverse data sets by leveraging cloud infrastructure.!
!
40!