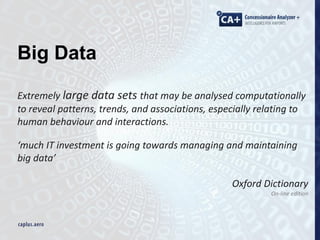
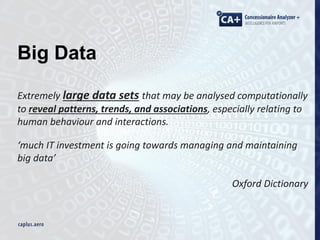
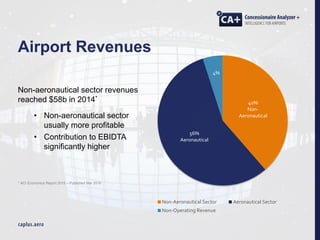
Optimizing Big Data Analytics to Achieve
Customer Insights and Strategizing non-
Aeronautical Activity for Maximized Revenue
John de Giorgio
CEO – CA Plus Limited
jdg@caplus.aero
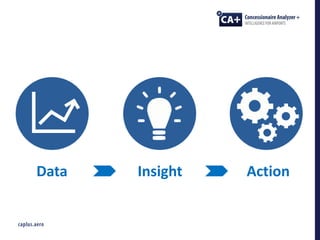
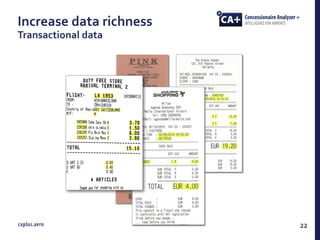
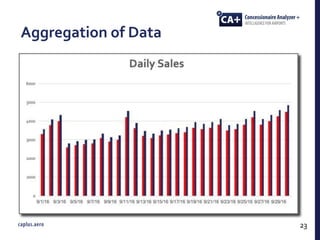
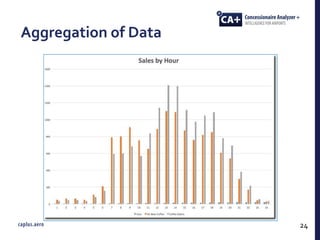
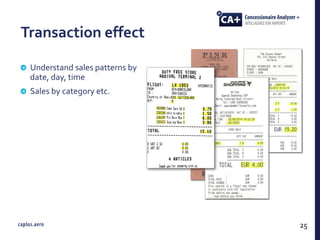
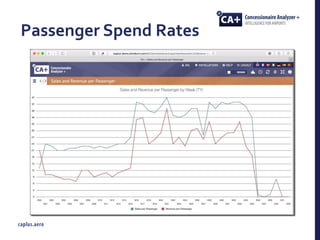
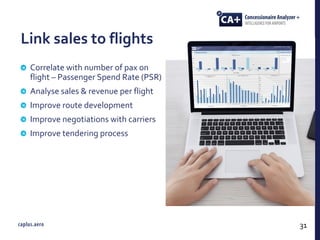
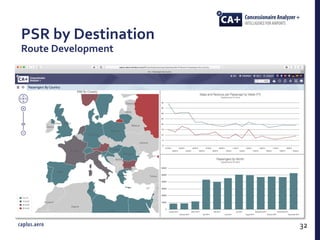
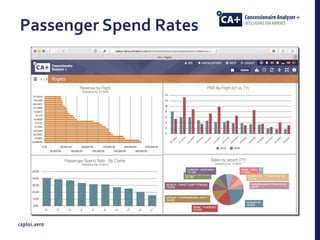
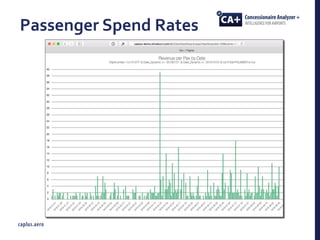
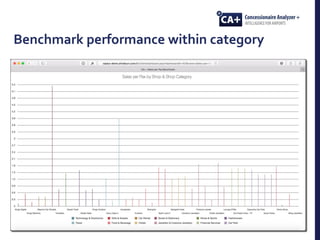
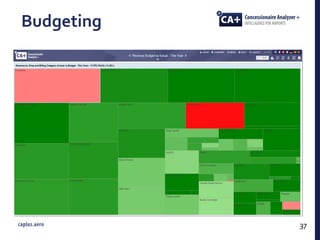
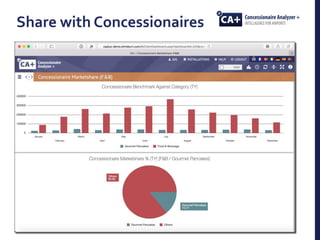
Concessionaire Analyzer+ (CA+) is a software solution that helps
airports to manage, control and boost their non-aeronautical
revenues through:
automated collection of detailed sales data
management of concession agreements
billing
provision of insight through data analytics
Big Data
Extremely large data sets that may be analysed computationally
to reveal patterns, trends, and associations, especially relating to
human behaviour and interactions.
‘much IT investment is going towards managing and maintaining
big data’
Oxford Dictionary
On-line edition
Big Data
Extremely large data sets that may be analysed computationally
to reveal patterns, trends, and associations, especially relating to
human behaviour and interactions.
‘much IT investment is going towards managing and maintaining
big data’
Oxford Dictionary
40%
Non-
Aeronautical
56%
Aeronautical
4%
Non-Aeronautical Sector Aeronautical Sector
Non-Operating Revenue
Non-aeronautical sector revenues
reached $58b in 2014*
• Non-aeronautical sector
usually more profitable
• Contribution to EBIDTA
significantly higher
* ACI Economics Report 2015 – Published Mar 2016
Airport Revenues
Low Hanging Fruit
Aeronautical Revenues
Increase passenger numbers
Increase charges
Decrease costs
Passengers are costly
the more passengers, the more…..
check-ins
security lanes
gates
aero-bridges
ground handling equipment
transport facilities
car parks
staff
possibly even runways
etc.
Cost of revenue acquisition is high
Increasing non-Aeronautical Revenues
Increasing retail and F&B
revenues through expansion
• Relies on passenger growth
• Diseconomies of scale
• Capital intensive
Increasing car park revenues
• Relies on passenger growth
• Capital intensive
Business parks, hotels, lounges,
airport cities
• Relies on passenger growth
• Capital intensive
Cost of revenue acquisition is high
Aviation 67%
Non-Aviation 33%
Aviation 59%Non-Aviation 41%
Non-Aviation 76%
Aviation 24%
Source: Kinetic Consultancy from Schiphol Group Annual Report 2015
Schipol Group Airport Results
Low Hanging Fruit
Optimisation
of
Non-Aeronautical Performance
Data Insight Action
Success factors for Big Data Analytics
1. Data
2. Analysis of data to provide insight
3. Opportunity to improve
14
Data Sources
Concession sales data
Contract information
• Revenue shares
• MAGs
Outlet locational data
Operational data
• Flights & code shares
• No. of pax
• Terminal &gate
Passenger counting data
Queue waiting measurement
15
Convince concessionaires
of value of data sharing
Solve technical issues re
collecting detailed sales
data from heterogeneous
environment
Other technical issues
• Integration with operational
systems
• Integration to people counting
16
What are the challenges?
Data Collection situation
Data collected monthly or weekly
• data latency
Insufficient detail
• little/no transaction level data
• sales totals
• sometimes by category
Limited automation
• Concessionaires usually report by email
• Significant effort spent on collection and chasing
• High dependence on Excel™ by commercial team
• Process lacks control, auditing and monitoring
17
Data Collection Capabilities – CA+
19
Concessionaire’s
Back-Office
CA+ Capture
Server
Analysis
CA+ Server
20
1. automate sales data collection
2. collect more detailed data for improved
analysis and insight
3. collect fresher data
4. improve control & auditing of concessionaires
5. increase productivity of processes
6. combine sales data with operational data for
improved insight
7. share analysis with concessionaires for
broader performance analysis
8. boost non-aero revenues
What’s are the Opportunities?
STORY
TIME
Increase data richness
Transactional data
22
Aggregation of Data
23
Aggregation of Data
24
Transaction effect
Understand sales patterns by
date, day, time
Sales by category etc.
25
Impact of Digital Advertising
26
Special Events
27
Link to operational systems
Passenger Spend Rates
Scan Boarding Passes
30
Link sales to flights
Correlate with number of pax on
flight – Passenger Spend Rate (PSR)
Analyse sales & revenue per flight
Improve route development
Improve negotiations with carriers
Improve tendering process
31
PSR by Destination
Route Development
32
Passenger Spend Rates
PSR BY GATE
35
Benchmark performance within category
Budgeting
37
Share with Concessionaires
Tactical Insight
LAGs example
39
40
ROI DRIVERS
Control Automation Insight
•Impose data sharing obligations in your contracts
• Data is key
•Spread your contract expiry dates
•This is not a BI project
• Contract management
• Sales data collection
• Integration with operational systems
• Billing
• Integration with ERP
• BI
Control, Manage and Boost
Non-Aeronautical Revenues
www.caplus.aero
Questions?

Optimising Big Data Analytics for Non-Aeronautical Activity