Download as PDF, PPTX


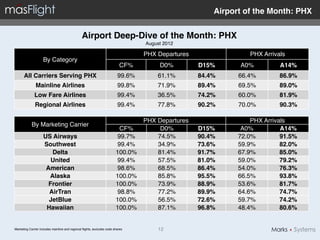
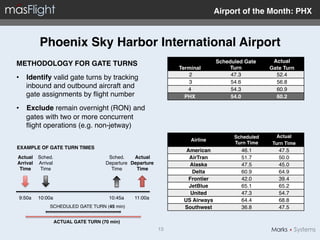


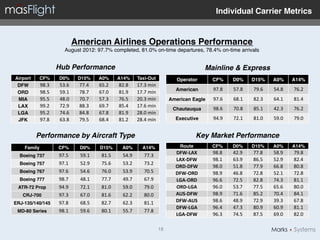

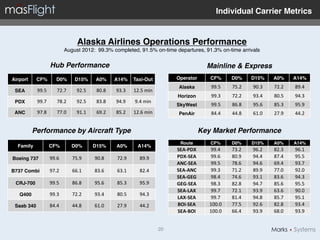


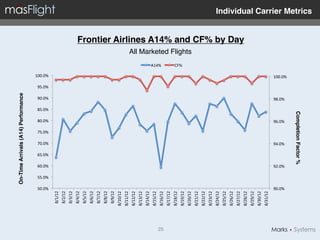


The monthly performance report for U.S. airlines in August 2012 provides detailed statistics on flight performance, including metrics such as completion factor and on-time departures and arrivals across various airlines and airports. Key highlights include Hawaiian Airlines' leading on-time arrival percentage at 91.6%, while airports like Salt Lake City and Minneapolis/St. Paul showed strong departure performances. The report also features a deep-dive analysis of Phoenix Sky Harbor International Airport and a market profile of the LAX to Sydney route.


