Transportation KPI Dashboard & Report - Example
•
3 likes•9,778 views

This is an example dashboard that shows the key performance indicators that a moving company used to get a snapshot of its performance in all areas of the company. Use this as a guide for creating your own project or company's dashboard to quickly share operational data with others.
Recommended

Recommended
More Related Content
More from Equilibria, Inc.
More from Equilibria, Inc. (20)
Recently uploaded
Recently uploaded (20)
Transportation KPI Dashboard & Report - Example
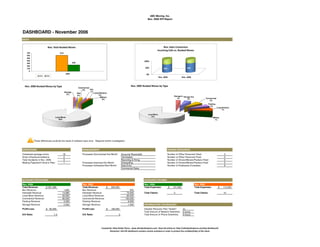
- 1. ABC Moving, Inc. Nov. 2006 KPI Report DASHBOARD - November 2006 SALES Nov. Total Booked Moves Nov. Sales Conversion Incoming Calls vs. Booked Moves 700 613 600 500 400 100% 244 244 613 300 200 100 50% 943 558 0 year 0% 2005 2006 Nov. 2005 Nov. 2006 Nov. 2006 Booked Moves by Type Nov. 2005 Booked Moves by Type Commercial 2% SVL Storage 1% TRA Long Distance 2% 2% 0% Storage In Storage Out Storage In Storage Out Military 3% 3% 5% 5% Commercial 0% Commercial 6% 6% Packing 6% Long Distance 7% Local Move Local Move 72% Military 93% 1% These differences could be the result of software input error. Requires further investigation. OPERATIONS MANAGEMENT HUMAN RESOURCES Crewsheet package errors: 18 Processes Documented this Month: Accounts Receivable Number of Office Personnel Hired: 3 Driver Infractions/violations: 2 Termination Number of Office Personnel Fired: 0 Total Accidents in Nov. 2006: 0 Recruiting & Hiring Number of Drivers/Movers/Packers Hired: 0 Missing Paperwork Driver's Files: 1 Processes Improved this Month: Onboarding Number of Drivers/Movers/Packers Fired: 5 Processes Scheduled Next Month: Data Entry Number of Employees Evaluated: 8 Commercial Sales ACCOUNTS RECEIVABLE ACCOUNTS PAYABLE Nov. 2006 Nov. 2005 Nov. 2006 Nov. 2005 Total Revenue: $ 201,280 Total Revenue: $ 293,050 Total Expenses: $ 121,000 Total Expenses: $ 113,000 Box Revenue: 1,800 Box Revenue: 550 Interstate Revenue: 14,680 Interstate Revenue: 70,000 Total Claims: 5 Total Claims: 10 Local Move Revenue: 93,500 Local Move Revenue: 65,000 Commercial Revenue: 85,500 Commercial Revenue: 150,000 Packing Revenue: 3,300 Packing Revenue: 6,500 Storage Revenue: 2,500 Storage Revenue: 1,000 INFORMATION TECHNOLOGY Profit/Loss: $ 80,280 Profit/Loss: $ 180,050 Disaster Recovery Plan Tested? no Total Amount of Network Downtime: 0 hours D/E Ratio: 1.5 D/E Ratio: 2 Total Amount of Phone Downtime: 0 hours Created By: Alicia Butler Pierre. www.aliciabutlerpierre.com View full article at: http://aliciabutlerpierre.com/kpi-dashboard/ Disclaimer: this KPI dashboard contains certain omissions in order to protect the confidentiality of the client.