This spreadsheet guides users through an 8-step rigid pavement design process according to FAA standards. It prompts users for input parameters at each step and calculates pavement thickness requirements. The final step provides a design summary, thickness charts, and print/export options. The spreadsheet automates a complex process to help aeronautical engineers accurately design rigid pavements.
The project involved designing of two different types of Rigid pavements using the
AASHTOWare Pavement ME software.
1) JPCP (Jointed Plain Concrete Pavement) : It was designed as a three layered structure,
the layer distribution being as follows:
Layer 1 – PCC – 16 inch
Layer 2 – NonStabilized (Crushed gravel) – 8 inch
Layer 3 – Subgrade (A-1a) – Semi Infinite
Jointed plain concrete pavement uses contraction joints to control cracking and uses
reinforcing steel in form of dowel bars.
Transverse joint spacing is selected such that temperature and moisture stresses do not
produce intermediate cracking between joints.
This typically results in a spacing no longer than about 6.1 m (20 ft.).
2) CRCP (CONTINUOUSLY REINFORCED CONCRETE PAVEMENTS) : It was
designed as a 4 layered structure, the layer distribution being as follows:
Layer 1 – PCC – 11.3 inch
Layer 2 – Stabilized – 4 inch
Layer 3 – NonStabilized – 8 inch
Layer 4 – Subgrade – Semi infinite
CRCP is concrete pavement reinforced with continuous steel bars throughout its length.
Its design eliminates the need for transverse joints (other than at bridges and other
structures) and keeps cracks tight, resulting in a continuous, smooth-riding surface.
DESIGN OF RIGID PAVEMENT AND ITS COST-BENEFIT ANALYSIS BY USAGE OF VITRIFIED ...IAEME Publication
A country can achieve sustainable and rapid growth in all fields by improving its connectivity and transit systems. Connectivity of people to resources by improved transit mechanism results in improved living standards. Apart from other means, the major part of connectivity of any country is through road systems. Well designed and maintained pavements provide better and long lasting service. In India, all the major road systems are designed as flexible pavements only, because of their ease of construction and less time it takes to be opened to traffic operations. The major problem with flexible pavements is their design life and high maintenance costs. Also, globally reducing petrol reserves, which are used for bitumen and asphalt production are also increasing the need for alternatives. To tackle these problems, rigid pavements can be constructed. Although the cost of construction of rigid pavements is high, its long life, high load carrying capabilities and low maintenance cost will balance the initial cost aspect. Recently, many studies are being conducted on different pozzolanic admixtures which can be used as partial replacement of cement in rigid pavements, thereby reducing its cost and enhancing properties of the mix. Here, an attempt is made to reduce the construction cost of rigid pavements by incorporating Vitrified Polish Waste (VPW) as partial cement replacement in proportions of 5% for M40 grade concrete. Further, to enhance flexural properties of pavement, Recron fibre is added to optimum VPW in increments of 0.1%, then after C.C pavement is designed for two lane two way national highway and cost benefit analysis is performed.
Heavy duty pavements are pavements subjected to the extremely heavy wheel loads associated with freight handling vehicles in industrial facilities, such as container terminals and warehouses. Heavy duty pavement need to handle many types of freight handling vehicles, such as forklifts, straddle carriers, gantry cranes and side loaders. Heavy duty pavement often deals with slow moving or even static traffic load with ultra high load magnitude. Furthermore, the load wandering for heavy duty pavement such as contain port or warehouse is more significant than normal highway or urban road pavement. The goal of pavement design is to determine the number, material composition and thickness of the different layers within a pavement structure required to accommodate a given loading regime.
Can AI do good? at 'offtheCanvas' India HCI preludeAlan Dix
Invited talk at 'offtheCanvas' IndiaHCI prelude, 29th June 2024.
https://www.alandix.com/academic/talks/offtheCanvas-IndiaHCI2024/
The world is being changed fundamentally by AI and we are constantly faced with newspaper headlines about its harmful effects. However, there is also the potential to both ameliorate theses harms and use the new abilities of AI to transform society for the good. Can you make the difference?
You could be a professional graphic designer and still make mistakes. There is always the possibility of human error. On the other hand if you’re not a designer, the chances of making some common graphic design mistakes are even higher. Because you don’t know what you don’t know. That’s where this blog comes in. To make your job easier and help you create better designs, we have put together a list of common graphic design mistakes that you need to avoid.
Dive into the innovative world of smart garages with our insightful presentation, "Exploring the Future of Smart Garages." This comprehensive guide covers the latest advancements in garage technology, including automated systems, smart security features, energy efficiency solutions, and seamless integration with smart home ecosystems. Learn how these technologies are transforming traditional garages into high-tech, efficient spaces that enhance convenience, safety, and sustainability.
Ideal for homeowners, tech enthusiasts, and industry professionals, this presentation provides valuable insights into the trends, benefits, and future developments in smart garage technology. Stay ahead of the curve with our expert analysis and practical tips on implementing smart garage solutions.
White wonder, Work developed by Eva TschoppMansi Shah
White Wonder by Eva Tschopp
A tale about our culture around the use of fertilizers and pesticides visiting small farms around Ahmedabad in Matar and Shilaj.
Book Formatting: Quality Control Checks for DesignersConfidence Ago
This presentation was made to help designers who work in publishing houses or format books for printing ensure quality.
Quality control is vital to every industry. This is why every department in a company need create a method they use in ensuring quality. This, perhaps, will not only improve the quality of products and bring errors to the barest minimum, but take it to a near perfect finish.
It is beyond a moot point that a good book will somewhat be judged by its cover, but the content of the book remains king. No matter how beautiful the cover, if the quality of writing or presentation is off, that will be a reason for readers not to come back to the book or recommend it.
So, this presentation points designers to some important things that may be missed by an editor that they could eventually discover and call the attention of the editor.
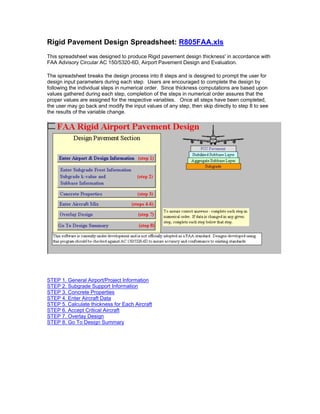
1. Rigid Pavement Design Spreadsheet: R805FAA.xls
This spreadsheet was designed to produce Rigid pavement design thickness' in accordance with
FAA Advisory Circular AC 150/5320-6D, Airport Pavement Design and Evaluation.
The spreadsheet breaks the design process into 8 steps and is designed to prompt the user for
design input parameters during each step. Users are encouraged to complete the design by
following the individual steps in numerical order. Since thickness computations are based upon
values gathered during each step, completion of the steps in numerical order assures that the
proper values are assigned for the respective variables. Once all steps have been completed,
the user may go back and modify the input values of any step, then skip directly to step 8 to see
the results of the variable change.
STEP 1. General Airport/Project Information
STEP 2. Subgrade Support Information
STEP 3. Concrete Properties
STEP 4. Enter Aircraft Data
STEP 5. Calculate thickness for Each Aircraft
STEP 6. Accept Critical Aircraft
STEP 7. Overlay Design
STEP 8. Go To Design Summary
2. STEP 1. General Airport/Project Information - Displayed with Output
Provides general project data which is displayed with the design summary.
This information is optional and does not affect numerical calculations.
3. STEP 2. Subgrade Support Information
The user must determine what level of frost protection will be provided to the pavement section.
The spreadsheet can determine the required thickness for the non-frost condition and the
Reduced Subgrade Support conditions. If the user elects to use the RSS method they should
click the button labeled "Use the RSS method for this pavement Design". The program will over-
ride the input values for subgrade modulus (k-values) with predetermined values in accordance
with the following table
Frost Code Reduced Subgrade k-value
F-1 50
F-2 35
F-3 25
F-4 Not Applicable
4. These values represent a weakened subgrade during the frost thaw period. Note that the RSS
method is no longer applicable when F-4 Frost code soils are encountered. When F-4 soils are
involved, the user must protect against frost weakening by improving the subgrade materials
within the anticipated frost depth.
Frost depth information is in tabular form as provided by the Corp of Engineers in 1986. Frost
depth values are simple interpolations of the tabular data.
Frost Penetration (Inches)
Soil Unit Weight lb/cf
Degree Days 100 115 125 150
200 20.5 21.5 23.8 25.5
400 27.5 30.5 35 38.5
600 34 38 44.5 49
800 40 44.5 54 59
1000 45 51 62 69
2000 69.5 79 102 113
3000 92 105 140 156
4000 115 130 177 205
4500 125 145 197 225
5. If Complete Subgrade Protection or Limited Subgrade Protection are desired, the user may enter
the Degree-Days and Soil Unit Weight to determine the depth of frost penetration. This
information does not affect the thickness calculations.
The final pavement section should be checked against the required depth for complete frost
protection. If additional thickness is required, it should be constructed of non-frost susceptible
material.
When the user elects to design the pavement based upon the Reduced Subgrade Support (RSS)
method they will be asked for a thickness of a free draining material beneath the slab. This layer
is not discussed in AC 150/5320-6D but is recommended for design in Chapter 5 of TMS-818-2 /
AFM 88-6 "Pavement Design for Seasonal Frost Conditions." If the designer elects to include
this layer, it will improve the subgrade k-value above the default frost values. If the pavement
section requires a stabilized base layer the free draining material should be below the bound
layer. The free draining material should never be "sandwiched" between relatively impervious
bound layers.
The user then selects the subgrade soil frost code. The frost code determines the minimum
subgrade support value as shown above and as detailed in Table 3-1 of AC 150/5320-6D.
6. Since the use of the Reduced Subgrade Support method is no longer permitted with F-4 soils, the
spreadsheet will not allow RSS for F-4 soils. If the user wishes to verify previous designs, then
may do so by designing a non-frost section with a manually reduced subgrade support value.
To complete the subgrade data input, the user should enter the subgrade k value and the
thickness of all stabilized and non-stabilized layers. The improved k-value will appear at the
thickness of each layer is entered. If the design uses the RSS method for frost design, the k-
value will default to the k-value determined by the soil frost code.
The user must also input the thickness of any subbase layers. The thickness of un-bound
aggregate or stabilized layers must be determined by the user. Minimum thickness requirements
are provided in AC 150/5320-6D, paragraphs 326 and 327. Other factors such as constructability
may determine the minimum subbase requirements.
7. STEP 3. Concrete Properties
The user should enter the Flexural Strength of the new concrete. The Poisson's Ratio and
Modulus of Elasticity may also be modified in the spreadsheet, however the default values are
recommended and represent the values assumed in AC 150/5320-6D. Thickness designs
performed with modified values for Poisson's Ration or Modulus of elasticity will not be consistent
with the requirements of AC 150/5320-6D.
There is considerable debate regarding the age of the concrete in relationship to the flexural
strength. Previous guidance had recommended that a 90 day flexural strength be specified for
design purposes. Current guidance recommends that the design flexural strength of the concrete
be based upon the age and strength the concrete will be required to have when it is scheduled to
be opened to traffic.
8. STEP 4. Enter Aircraft Data
The user can enter up to 21 aircraft in the traffic mix. The aircraft selection is limited to those
aircraft originally listed in the R806faa.exe program. Any combination of aircraft may be selected
and aircraft types may be repeated.
The user may also select whether to use the optional design method discussed in AC 150/5320-
6D, paragraph 332b, which considers aircraft gear skewed relative to the concrete joints.
The program will prompt the user for aircraft weight and annual operations. Since each gear type
is based upon a reasonable anticipated weight for the gear configuration, the program will limit
the permissible weight range. If desired, the user may over-write these values directly in the
spreadsheet. The user is cautioned to observe the weight limitations and select gear
configurations appropriately. Greater thickness requirements will result from overloading a small
gear versus under loading a larger gear. For example, a dual wheel aircraft weighing 125,000
pounds could be input as a DUAL100 or a DUAL150 aircraft.
9. The user can assign a local name to an aircraft for ease of identification. Local names can be
entered directly into the spreadsheet. This is particularly useful when numerous aircraft are from
a common gear configuration but vary in weight.
STEP 5. Calculate Thickness for Each Aircraft
Step 5 calculates and displays the required pavement thickness for each aircraft in the mixture
and determines the most demanding (critical) aircraft.
This step is provided for the user's information and may be skipped as it is repeated by step 6.
This step is particularly useful when analyzing the impact of one design variable. Suppose the
user wants to see the impact of increasing weight while keeping annual departures constant. By
entering the same aircraft multiple times and varying the weight, the user can immediately see
the change in thickness required for each change in weight. Likewise, any variable can be
changed while holding other variables constant.
STEP 6. Accept Critical Aircraft (Return)
This step repeats step 5 and accepts the aircraft data entered. The user is returned to the initial
program entry screen.
10. STEP 7. Overlay Design
The user is asked if they wish to calculate overlay thickness. If the user answers no, the data in
the overlay section of the summary page will be eliminated. The program defaults to this
conditions to avoid erroneous overlay design. It the users answers yes, the program will prompt
the user for subgrade information.
The subgrade Frost design will re-appear and should be answered as appropriate.
11. Much of the information presented in Step #2 is repeated for the users to view and/or modify as
appropriate. In addition to the subgrade information, the user is prompted for information
regarding the properties and condition of the existing pavement.
12. STEP 8. Go To Design Summary
Step 8 takes the user to the summary sheet
All information regarding the design is displayed on the summary sheet.
The summary display is dynamic and will change depending upon design features. e.g. if a
stabilized base is required, a note will appear on the summary sheet to indicate the requirement.
From the summary sheet, the user is permitted to print the summary and/or the aircraft mix.
The user may also elect to view a plot of annual departures versus required total thickness or a
plot of flexural strength versus required total thickness for the design aircraft. These plots provide
an indication of how sensitive the design is to changes in concrete flexural strength or annual
departures.
13. To prepare the thickness chart for the design aircraft the program will prompt the user for the
minimum and maximum number of annual departures. These values will determine the limits of
the thickness chart.
14. To prepare the thickness versus flexural strength chart the program will prompt the user for the
range of flexural strength These values will determine the limits of the chart.