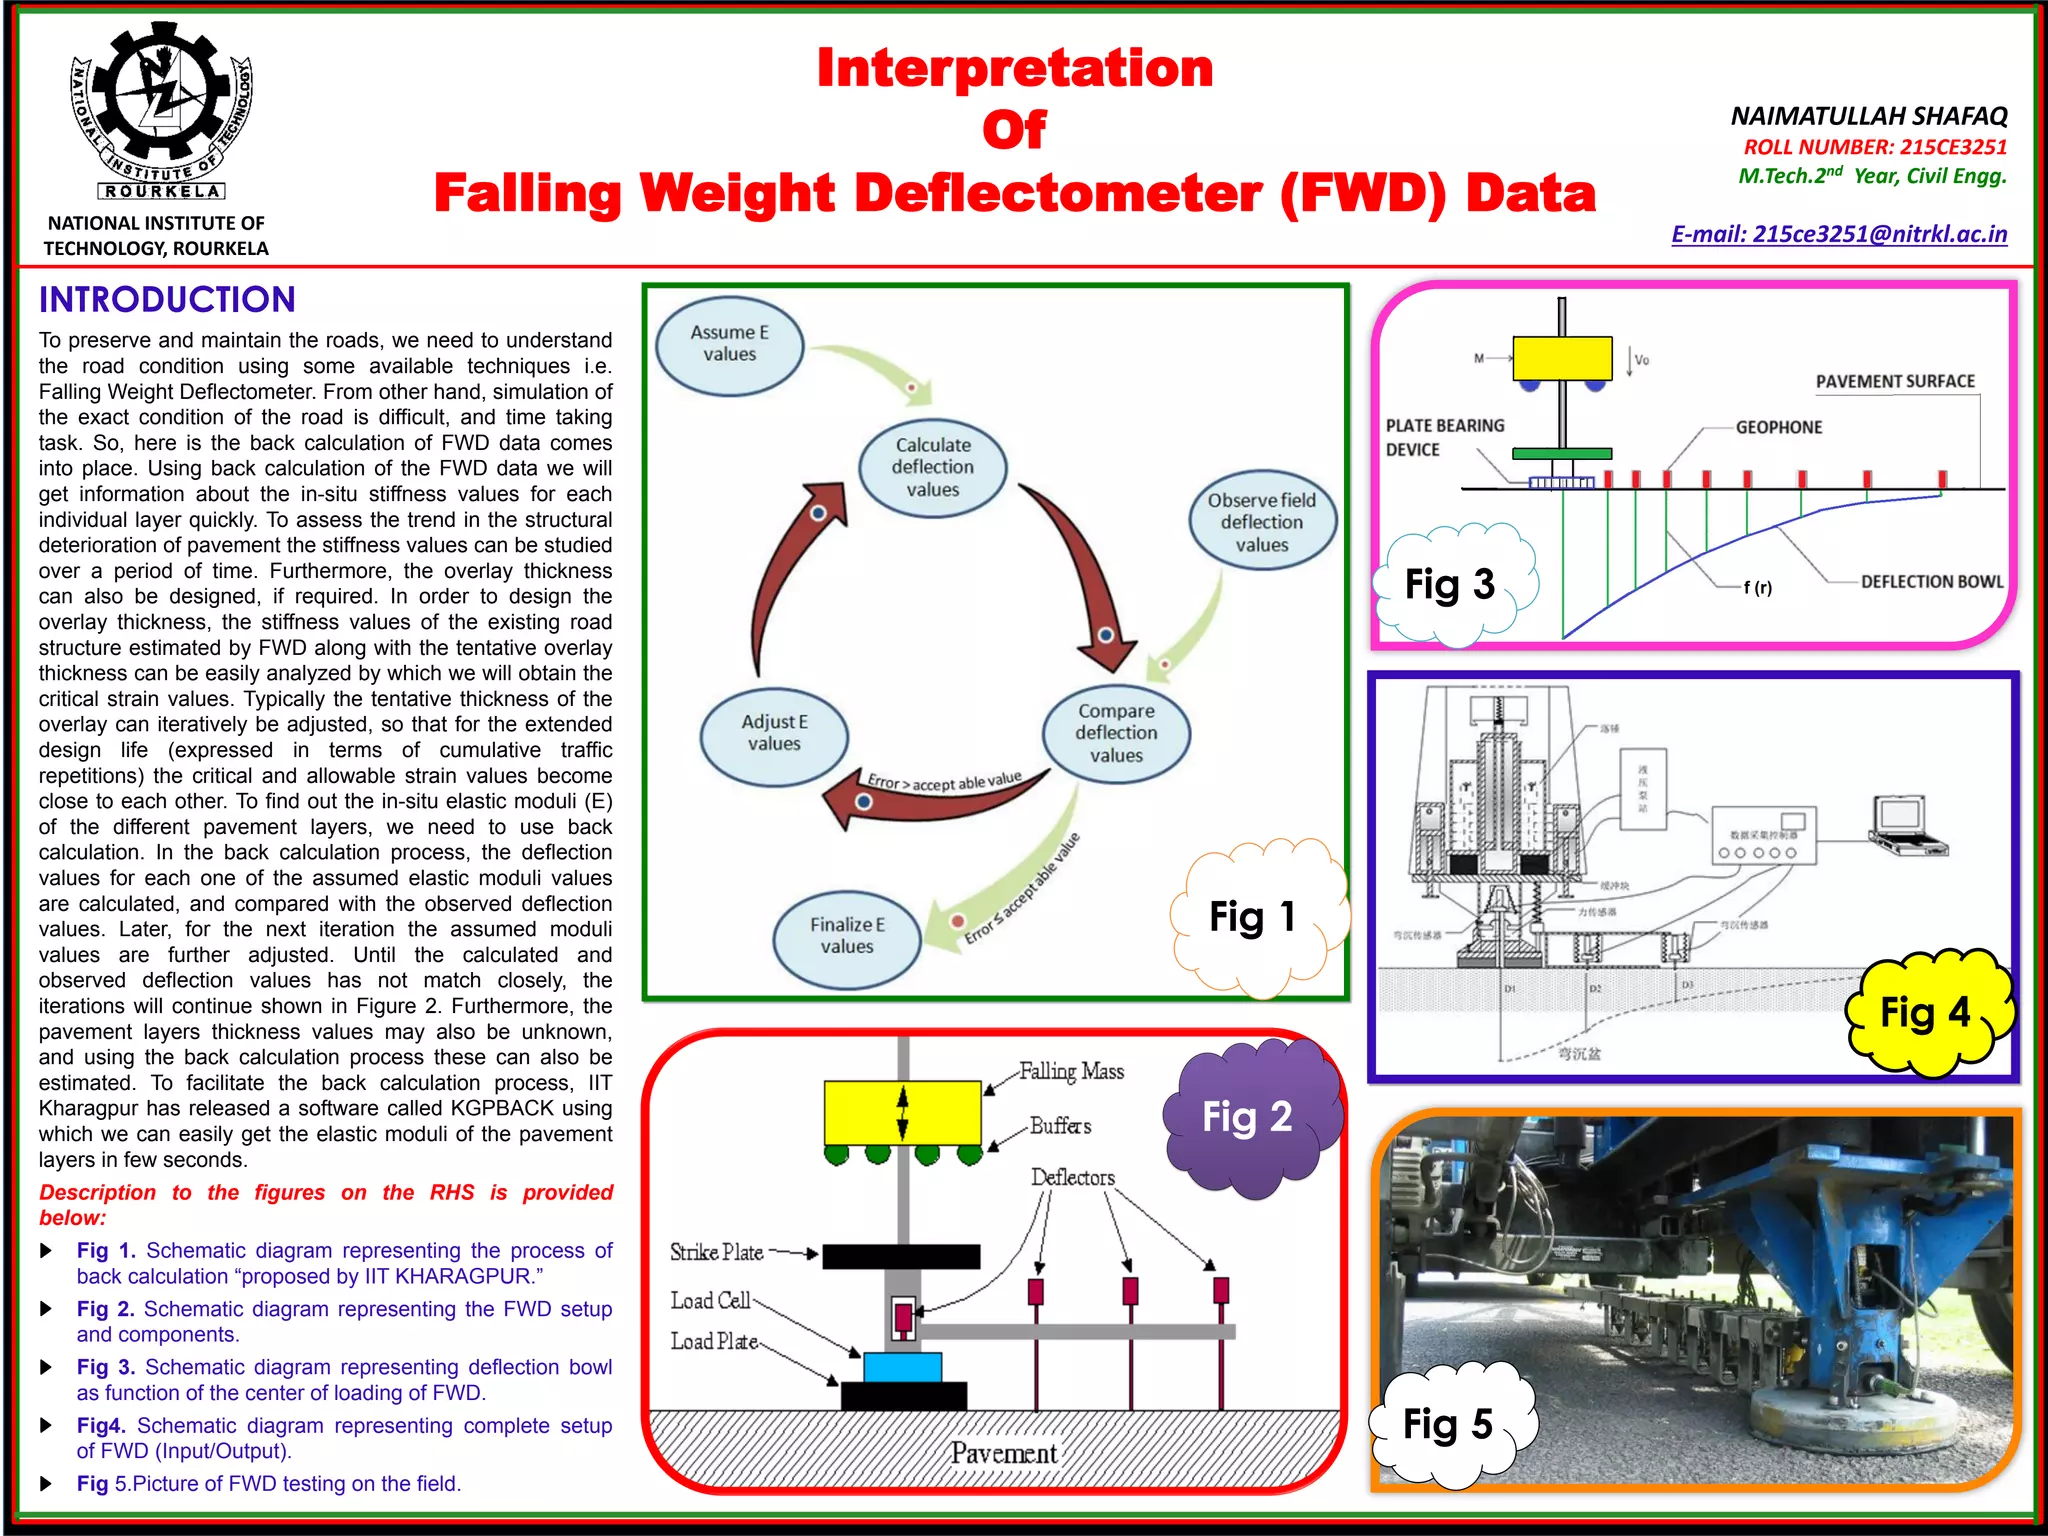
Interpretation
Of
Falling Weight Deflectometer (FWD) Data
NAIMATULLAH SHAFAQ
ROLL NUMBER: 215CE3251
M.Tech.2nd Year, Civil Engg.
E-mail: 215ce3251@nitrkl.ac.inNATIONAL INSTITUTE OF
TECHNOLOGY, ROURKELA
INTRODUCTION
To preserve and maintain the roads, we need to understand
the road condition using some available techniques i.e.
Falling Weight Deflectometer. From other hand, simulation of
the exact condition of the road is difficult, and time taking
task. So, here is the back calculation of FWD data comes
into place. Using back calculation of the FWD data we will
get information about the in-situ stiffness values for each
individual layer quickly. To assess the trend in the structural
deterioration of pavement the stiffness values can be studied
over a period of time. Furthermore, the overlay thickness
can also be designed, if required. In order to design the
overlay thickness, the stiffness values of the existing road
structure estimated by FWD along with the tentative overlay
thickness can be easily analyzed by which we will obtain the
critical strain values. Typically the tentative thickness of the
overlay can iteratively be adjusted, so that for the extended
design life (expressed in terms of cumulative traffic
repetitions) the critical and allowable strain values become
close to each other. To find out the in-situ elastic moduli (E)
of the different pavement layers, we need to use back
calculation. In the back calculation process, the deflection
values for each one of the assumed elastic moduli values
are calculated, and compared with the observed deflection
values. Later, for the next iteration the assumed moduli
values are further adjusted. Until the calculated and
observed deflection values has not match closely, the
iterations will continue shown in Figure 2. Furthermore, the
pavement layers thickness values may also be unknown,
and using the back calculation process these can also be
estimated. To facilitate the back calculation process, IIT
Kharagpur has released a software called KGPBACK using
which we can easily get the elastic moduli of the pavement
layers in few seconds.
Description to the figures on the RHS is provided
below:
Fig 1. Schematic diagram representing the process of
back calculation “proposed by IIT KHARAGPUR.”
Fig 2. Schematic diagram representing the FWD setup
and components.
Fig 3. Schematic diagram representing deflection bowl
as function of the center of loading of FWD.
Fig4. Schematic diagram representing complete setup
of FWD (Input/Output).
Fig 5.Picture of FWD testing on the field.
Best fitted function selected
‫سبسبسبسسسبسبیلیلیل‬
Fig 1
Fig 2
Fig 3
Fig 4
Fig 5

Interpretation Of Falling Weight Deflectometer (FWD) Data

  • 1.
    Interpretation Of Falling Weight Deflectometer(FWD) Data NAIMATULLAH SHAFAQ ROLL NUMBER: 215CE3251 M.Tech.2nd Year, Civil Engg. E-mail: 215ce3251@nitrkl.ac.inNATIONAL INSTITUTE OF TECHNOLOGY, ROURKELA INTRODUCTION To preserve and maintain the roads, we need to understand the road condition using some available techniques i.e. Falling Weight Deflectometer. From other hand, simulation of the exact condition of the road is difficult, and time taking task. So, here is the back calculation of FWD data comes into place. Using back calculation of the FWD data we will get information about the in-situ stiffness values for each individual layer quickly. To assess the trend in the structural deterioration of pavement the stiffness values can be studied over a period of time. Furthermore, the overlay thickness can also be designed, if required. In order to design the overlay thickness, the stiffness values of the existing road structure estimated by FWD along with the tentative overlay thickness can be easily analyzed by which we will obtain the critical strain values. Typically the tentative thickness of the overlay can iteratively be adjusted, so that for the extended design life (expressed in terms of cumulative traffic repetitions) the critical and allowable strain values become close to each other. To find out the in-situ elastic moduli (E) of the different pavement layers, we need to use back calculation. In the back calculation process, the deflection values for each one of the assumed elastic moduli values are calculated, and compared with the observed deflection values. Later, for the next iteration the assumed moduli values are further adjusted. Until the calculated and observed deflection values has not match closely, the iterations will continue shown in Figure 2. Furthermore, the pavement layers thickness values may also be unknown, and using the back calculation process these can also be estimated. To facilitate the back calculation process, IIT Kharagpur has released a software called KGPBACK using which we can easily get the elastic moduli of the pavement layers in few seconds. Description to the figures on the RHS is provided below: Fig 1. Schematic diagram representing the process of back calculation “proposed by IIT KHARAGPUR.” Fig 2. Schematic diagram representing the FWD setup and components. Fig 3. Schematic diagram representing deflection bowl as function of the center of loading of FWD. Fig4. Schematic diagram representing complete setup of FWD (Input/Output). Fig 5.Picture of FWD testing on the field. Best fitted function selected ‫سبسبسبسسسبسبیلیلیل‬ Fig 1 Fig 2 Fig 3 Fig 4 Fig 5