Download to read offline
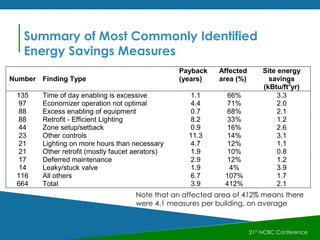
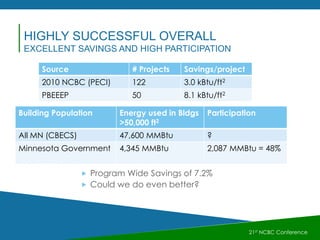
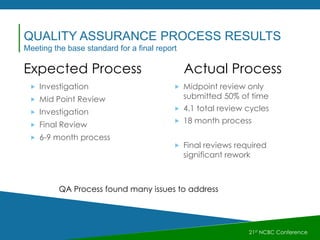
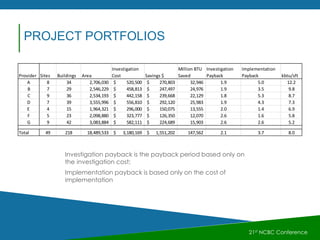
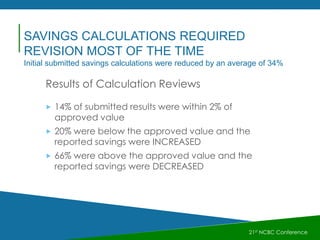
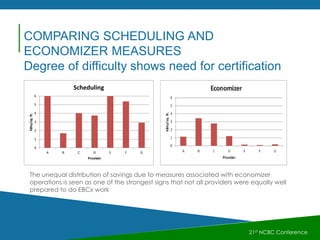
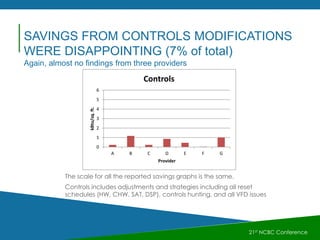


The document summarizes the results of Minnesota's Existing Building Commissioning Program, which investigated 227 state government buildings containing nearly 19 million square feet. Key findings include that specialized training and provider certification would benefit commissioning programs, investigations identified an average of over 4 measures per building with average site energy savings of 2.1 kBtu/ft2yr, and implementation of measures resulted in a program-wide savings of 7.2%. Quality assurance improved outcomes for customers but identified a need for more consistent, high-quality work from commissioning providers.


